Fiscal Reforms and Finances of
Government of Andhra Pradesh
Fiscal Reforms and Finances of
Government of Andhra Pradesh
#R. Sudarsana Rao
♣Introduction
The Indian constitution entrusted the states with functions both expensive and expansive such as agriculture, irrigation, roads and buildings, rural development, education, medical and public health, and law and order, along with some revenue powers, mostly inelastic in nature. Since the advent of Five Year Plans, these expenditure commitments have been increasing phenomenally. For instance, the states’ share of current expenditure in the combined current expenditure of the centre and states was about 58 percent in 1999-2000. The share of the states in the combined non-developmental expenditure was about 35 percent in 1990-91, which rose to 43 percent in 1999-2000. It is quite interesting to observe that the rise in the states’ share was even more pronounced in the case of developmental expenditure – from 59 percent to 72 percent during the same period. It is to be noted that while the centre’s total expenditure in the combined total expenditure has declined from 57 percent in 1990-91 to 46.5 percent in 1999-2000, the decline implied a corresponding increase in the states’ share from 43 percent to 53.5 percent. This amply demonstrates the crucial role played by the states’ expenditure in the Indian union. This growth of expenditure needed to be accompanied by commensurate revenue efforts, but has been lacking for a long time in most of the states. Moreover, the expenditures need to be targeted at the twin objectives of economic growth and welfare of the people. In order to achieve higher levels of economic growth, larger investments have to be made for the development of both physical and social infrastructure. Public investments are not only required for their direct impact on growth, but also to attract private investments that contribute to economic
# This paper was prepared under the umbrella programme of “Capacity Building for Budgetary Analyses at the State Level” administered by National Institute of Public Finance and Policy and funded by the World Bank.
♣ Professor, Department of Economics, Andhra University, Visakhapatnam,
growth of the state. Further, the benefits of accelerated growth need to be percolated to the larger sections of people, so that the welfare objective is achieved in terms of reduction in both income poverty and human poverty. However, the development of infrastructure depends not only upon the availability of adequate fiscal resources in the state concerned but also development-oriented expenditure policies of the Government. But almost all the states now face acute fiscal crisis owing to their economic policies, especially on account of their competitive populism coupled with laxity in taxation. The fiscal situation has further deteriorated with poor cost-recovery measures. The ever-increasing commitment of states’ expenditure on interest payments, which have resulted from rising interest rates as well as increasing indebtedness caused by accumulated losses and consequent budgetary support to public enterprises, particularly in the power sector, and the spurt in pension expenditure have also contributed to fiscal problems. This turn of events is reflected in the appearance of large fiscal and revenue deficits in most states during mid-nineties. Moreover, the number of fiscal transfers, especially shared tax revenue has declined considerably in several states consequent upon the economic reforms initiated by the union government, since 1991. All these factors have led to substantial decline in public investment in infrastructure, the worst hit being the social sector, in several states. In order to remedy the situation, several major states which were hesitant and lagging behind the central government in adopting the fiscal reforms have now come forward to initiate economic reforms with multiple goals to achieve. In fact, it has been felt that “reform at the state level is critical for stabilising the fiscal economy, accelerating (economic) growth and improving access to and the quality of social services”( Fardoust and
Lahiri, 2003).Moreover, it has been well recognised that reforms at
the central government level cannot be successful and will not yield the desired results without complementary reforms at the states’ level. Hence, the much needed encouragement from the union government with financial incentives to states to initiate reforms without further delays. In these circumstances, several states felt that the implementation of economic reforms, especially fiscal reforms is almost inevitable rather than a matter of choice. Consequently, most of the major states have adopted some fiscal reform measures during the nineties. Andhra Pradesh has been one of the front-runners in implementing reforms since 1995-96, at a time when several major states were still skeptical about initiating reforms.
Andhra Pradesh is one of the major states in India endowed with rich natural resources having large potential for economic growth and development. It is the fifth largest state in the country covering a geographical area of 274.40 lakh hectares with a population of about 7.56 crore, being the fifth populous state in the country. It has often been asserted that its development is still below its potential in spite of its endowment of natural resources (Sarma, 2002). While the growth of GSDP in Andhra Pradesh in 1980s was marginally higher or nearly the same compared with the GDP of the nation, there has been no improvement in the growth rate of GSDP during the 1990s while the GDP of the nation did record an improvement. However, there is an improvement in the per capita SDP during the 90s compared to 80s, though it has always been lower than the all-India level of per capita income (Hanumantha Rao, 2003). These facts underline the importance of further developments in infrastructure services in order to accelerate the economic growth and per capita income.
The revenue and expenditure policies of successive governments in the state were such that there was surplus on its revenue account in 1980-81, 1981-82, and 1982-83 but subsequently it experienced fiscal and revenue deficits, affecting capital expenditures and the development of infrastructure, resulting in stifling of economic growth. During the late 1980s and mid-90s the non-plan, non-developmental expenditure has increased phenomenally, which led to huge fiscal and revenue deficits. The frequent changes in the political parties in power since 1983-84 have influenced the revenue mobilisation and expenditure policies of the state, resulting in changes in the composition, pattern, direction, and growth of both revenue and expenditure. In other words, both economic and political factors over a period of time are responsible for leading the state government to a fiscal crisis. As a response to this situation, the government initiated several fiscal reforms in the state since 1995-96. In continuation of the fiscal reforms initiated especially since July-August 1996 and in the light of the feedback on
the draft Fiscal Reforms Strategy Paper released in February 2001,
the government prepared a Medium Term Fiscal Framework (MTFF) covering the period 2001-02 to 2005-06. The state is also covered by
the Fiscal Reforms Facility of the Government of India as
recommended by the Eleventh Finance Commission. The
Government of Andhra Pradesh also has undertaken a Medium Term
Fiscal Reforms Programme by revising the targets already set for the
MTFF. The state has undertaken a number of measures relating to revenue mobilisation, expenditure restructuring, debt and deficits and several sectoral reforms with a view to achieve the set goals. Though
it takes some time to reap the full benefits of the reform process, still it is pertinent to analyse and assess the usefulness or otherwise of the reforms already initiated. Such an analysis will provide insights either to deepen, revise or redesign the reform process in future. Therefore, a modest attempt is made in this paper to address the following:
• analyse the important reasons for the fiscal crisis that
necessitated the introduction of reforms in the state; • discuss the fiscal reforms initiated in the state including
reforms in the power sector and public enterprises;
• briefly discuss the implementation of the Medium Term
Fiscal Reform Programme; and
• make suggestions useful for future reform policy.
Data Sources and Methodology
This paper covers the period 1980-81 to 2003-04. The fiscal situation that prevailed during 1980-81 to 1995-96 has been presented to explain the resource crunch experienced by the state in 1995-96 that necessitated urgent fiscal reforms. The analysis is largely based on information and findings of earlier studies on the subject pertaining to the state. The year 1995-96 has been chosen as the beginning of fiscal reforms while 2003-04 is the last year for which least revised estimates are available. The data are obtained from the Reserve Bank of India Bulletins, Budget Documents, Economic Surveys, Annual Fiscal Framework 1996, 2001-02, 2002-03, 2003-04, Strategy Paper (January 2001), budget speeches, Government of Andhra Pradesh, Reports of the CMIE besides other documents of the Government of India and World Bank. Simple analytical tools have been used to analyse the information obtained from these sources. The paper is presented in four sections. The first section deals with an analysis of the important reasons for introducing fiscal reforms. Section II presents an analysis of the details of the reforms undertaken and their progress. Section III
attempts a broad evaluation of the implementation of the Medium
Term Programme under Fiscal Reform Facility. Some suggestions
Section - I
Important Reasons to Undertake Fiscal Reforms
Revenue Performance
The revenue receipts of the state witnessed considerable expansion during the period 1980-81 to 1984-85. The total revenue receipts of the state as a proportion of GSDP increased from 15.44 percent in 1980-81 to 16.90 percent in 1984-85. But this proportion subsequently declined from 16.04 percent in 1990-91 to 12.75 percent in 1994-95 and further to 12.37 percent in 1995-96 (Chart-1). Similarly, own tax revenues showed an expansionary trend during the period 1980-81 to 1984-85. The ratio of own tax revenue in GSDP increased from 7.11 percent in 1980-81 to 8.64 percent in 1984-85 which then declined to 7.94 percent and 5.16 percent in 1990-91 and 1995-96 respectively, as the proportion of almost all the state taxes, including sales tax revenue declined substantially mainly because of too many concessions, exemptions, and administrative bottlenecks that cropped up in the tax structure since the latter half of 1980s. Moreover, the revenue from share in central taxes declined from 3.44 percent in 1990-91 to 2.73 percent in 1994-95 due to a significant decrease in the revenues from union excise duties consequent upon economic reforms, and then recovered a little to 3.21 percent in 1995-96.
Chart -1 Growth of Revenue Receipts in Andhra Pradesh 0 5 10 15 20 25 30 35 40 45 1980-81 1984-85 1990-91 1994-95 1995-96 1996-97 1997-98 1998-99 1999-00 2000-01 2001-02 2002-03 2003-04r %age in GSDP
Share in Central Taxes State Own Tax Revenue Tax Receipts Revenue Receipts
Similarly, revenue from non-tax sources as a proportion of GSDP also declined during the same period. For instance, it increased from 4.72 percent in 1980-81 to 4.95 percent in 1984-85 and declined during the latter years to reach 4.0 percent in 1995-96. The decline may be attributed to the decline in both own non-tax revenue as well as in grants from the centre. It may be observed from chart–2 that between the period 1990-91 and 1995-96 the percentage decline is more in the central grants compared to own non-tax revenues. The decline in the revenue from interest receipts and social services is the main reason for the decline in own non-tax revenues during the period.
Chart - 2 Growth of Non-Tax Revenue in Andhra Pradesh 0 2 4 6 8 10 12 1980-81 1984-85 1990-91 1994-95 1995-96 1996-97 1997-98 1998-99 1999-00 2000-01 2001-02 2002-03 2003-04 r Percentage in GSDP
G rants from the Centre O w n N on-tax Revenue N on-Tax Revenue
Public expenditure needs to grow as the economy grows in order to provide the required public services at adequate levels. In other words, growth in expenditure needs to follow the growth in the GSDP. Moreover, the composition of expenditure – the relative proportion of revenue and capital expenditure – is also important as the growth of an economy very much depends upon the size and growth of capital expenditure. The pattern and composition of expenditure underwent a substantial change between 1980-81 and 1995-96 during which the proportion of revenue expenditure was not only very high but also increased substantially, minimising the role of capital expenditure. For instance, the revenue expenditure as a proportion of total expenditure increased from 78 percent in 1980-81 to 86 percent in 1995-96. Similarly, the revenue expenditure as a proportion of GSDP shows an increasing trend until 1990-91 but has then declined to 13.29 percent in 1995-96 from 14.18 percent in 1980-81 (Chart-3). It is a matter of concern that the capital expenditure as a proportion of GSDP has declined from 3.98 percent in 1980-81 to just 2.10 percent in 1995-96 (Chart-4). The growth of revenue expenditure in the total expenditure has been mainly due to the introduction of new welfare schemes and expansion of the already existing schemes, increased salary bill and pension commitment, increasing number of loss making public sector enterprises and the resultant budgetary support. The changes in the political parties in power in the state during this period brought a sea-change in the public policies wherein the composition and direction of the public expenditure was changed for the worse, although the need was for restructuring and reorientation in order to have a developmental impact that would lead to accelerated economic growth of the state.
Chart - 3 Trends in the Revenue Expenditure of Andhra Pradesh 0 5 10 15 20 25 30 35 40 1980-81 1984-85 1990-91 1994-95 1995-96 1996-97 1997-98 1998-99 1999-00 2000-01 2001-02 2002-03 2003-04 r Percentage in GSDP
Compensation to local Bodies Non-Developmental Expenditure Developmental Expenditure Revenue Expenditure
Growth of Establishment Costs
The state government incurs expenditure on salaries, wages, and pensions of its employees, judiciary, aided educational institutions and local bodies besides the state public sector undertakings (PSUs), universities and cooperatives. The expenditure on salaries of employees of municipalities, universities and PSUs etc. are paid out of the budget support from the government and from their own resources. But the burden of the state government has been increasing over the years, as most of these institutions have not been generating enough own resources to meet their establishment costs. The increase in the establishment costs is mostly on account of an increase in the number of employees, pay revisions in every five/ten years as the case may be and the hike in dearness allowance which is indexed to inflation. While the employees of the state government and local bodies constituted about 69 percent of total public sector employment, the rest of the employees in the PSU, universities and cooperatives constituted about 31 percent in 1993. The number of employees grew by about 19 percent between 1988 and 1993. In fact there was a notable increase of 4 lakh employees between 1981 and 1993 in the state. Consequently, the establishment expenditure in terms of pay and allowances, wages,
salary grants, pensions etc., have increased remarkably. It may be seen from table-1 that the establishment costs as a percentage of state’s own revenue have increased from 77 percent in 1984-85 to 96 percent in 1995-96. It is observed that there is considerable redundancy and surplus staff in practically all the departments and institutions, which called for reform to reduce establishment costs.
The observation of the Staff Review Committee appointed by the
state government that there is 40 percent surplus staff in the irrigation department reflects the intensity of the problem and suggests need for reform.
Table 1: Establishment Expenditure of the Government of Andhra Pradesh (Rs. crore) Pay and allowances (including traveling allowances) Wages Grants-in-aid for salaries Pen-sions Total expen diture Establi-shment costs as % of states own revenue 1984-85 574 14 375 117 1080 76.9 1989-90 1152 9 96 269 1525 86.5 1994-95 2197 14 1588 780 4580 88.5 1995-96 2351 14 1553 928 4845 95.6
Source: Compiled from Strategy Paper on Fiscal Reforms, GoAP, February 2001.
Bulging Expenditure on Subsidies
The government has been providing a numerous of subsidies through its various budgets. The subsidies may be explicit or implicit. While the subsidies given for food (rice), power, housing, and other public enterprises are explicit subsidies, subsidies given to wards irrigation, education, health etc., are implicit subsidies. Of all the explicit subsidies, subsidy for rice is the most popular and sought after in the state.
The subsidised rice programme was started in 1983 as one of the electoral promises of the then ruling party and has since undergone several changes. Initially rice was given at Rs. 2 a Kg, and 5 kg per person and a maximum of 20 kg per family through fair price shops. Though the issue price was raised subsequently to Rs.3.50, it was again revised downwards to Rs. 2 in December 1994, increasing the maximum quota given to a household. The total subsidy on rice was Rs.137 crore in 1984-85 constituting 7 percent of total revenue receipts. This has since increased to Rs.1,143 crore constituting 12 percent of the total revenue receipts. The rice subsidy in 1995-96 was so huge that it was about half of the total budgetary allocations to education and health put together. With such a huge amount of subsidy, the Rs.2 per kilo rice scheme was the largest subsidised programme among the states in India (Government of Andhra Pradesh, 1996).
Another important explicit subsidy in the state has been the power subsidy. This subsidy was given to the erstwhile AP State Electricity Board (APSEB) to compensate for its losses and also to enable the board to ensure a 3 percent return on net capital invested
in the power sector. The government gave a subsidy of about Rs. 944 crore and Rs 1,259 crore in 1994-95 and 1995-96 indicating the need for applying corrective measures not only to reduce the fiscal impact on government but also to provide uninterrupted power of adequate quality in the state.
Besides power subsidy, the government provides implicit subsidies to irrigation, housing, education, health, and public enterprises in various forms. Almost all these subsidies are not well targeted and the cost recovery has been very poor impacting adversely on the state budget. For instance, the cost recovery varies from 20-25 percent with regard to irrigation, about 1 to 10 percent in housing, 6 to 8 percent in health and only below 1 percent in higher and technical education (World Bank, 1997). The poor cost-recovery measures coupled with the subsidy given to power sector has led to draining of fiscal resources of the state government causing fiscal distress which ought to be reformed and remedied.
Loss Making Public Enterprises
The state government has established different forms of public enterprises not only to provide public services to its citizens but also to produce goods on commercial and profitable lines. The activities of these enterprises encompass promotional, developmental, trading, marketing, manufacturing and service sectors. The number of State Level Public Enterprises (SLPEs) have increased over the plan period. There were about 39 SLPEs by 1995-96. Government participates by providing equity investment, loans and also by giving guarantees to the loans undertaken by the SLPEs. But most of the SLPEs have been incurring losses and have been running on budgetary support. Their performance was pathetic in that the return on investments was meagre. For instance, the return in terms of dividend on its investments was only 0.3 percent in 1993-94 and the accumulated losses of SLPEs were as high as Rs. 913 crore, which constituted almost 12 percent of the revenue receipts of the state. These accumulated losses have further increased by 1995-96 thus aggravating the fiscal stress of the state government. Clearly, the situation was ripe for reforms in public enterprises in the state.
Declining Investments
The rising costs of establishment, increased commitments of subsidies and of other welfare programmes have crowded out the resources for physical and social infrastructure and for non-wage operation and maintenance (O &M). The capital expenditure (total of
capital outlay and net lending) as a proportion of total expenditure declined sharply from 21.92 percent in 1980-81 to 13.65 percent in 1995-96. As a proportion of GSDP, it declined from 3.98 percent in 1980-81 to 2.10 percent in 1995-96. Though the state government subsequently made efforts to push up investment in infrastructure areas mainly through externally aided projects, the after effects of the resource crunch in 1994-95 and 1995-96 severely limited the rise in investments. The resource crunch also led to smaller resource allocation in the social service sectors as well as the expenditure on non-wage O & M, the least protected item in the expenditure budget. For instance, the expenditure on education and health as a proportion to GSDP fell from 3.18 percent and 1.84 percent respectively in 1980-81 to 0.71 percent and 0.34 percent in 1995-96. This indicates the need – despite increased private participation in these sectors – to reorient and restructure the public expenditure in order to have a long-term growth inducing expenditure pattern.
Low Standard of Human Development
Human development is critical for long term and sustainable economic growth. Andhra Pradesh is one of the states lagging behind several others in the country as far as education and health standards are concerned. The literacy levels are far less than the national average; one of the lowest among the major states in the country. For instance, male and female literacy in Andhra Pradesh was 55 and 33 percent in 1991 while the national average was 64 and 39 percent respectively. The gross enrolment ratio for primary schooling is also lower and the dropout ratio higher than several other comparable states including the southern states. About 30 lakh children of school-going age are out of school. Government expenditure on education was not only low but also declining. For instance, education expenditure as a proportion of total expenditure declined from 16.41 percent in 1984-85 to 15.26 in 1994-95, and to14.02 percent in 1995-96; as a proportion of GSDP it declined from 3.5 percent in 1984-85 to 2.46 percent in 1994-95 and to 2.16 percent in 1995-96. Moreover, the relative importance of primary education has been declining which needs to be remedied.
Though the usual health indicators such as crude birth rate, crude death rate and infant mortality rate are either similar or close to the national average, Andhra Pradesh lags behind several major states including the southern states in certain other aspects. Incidence of communicable diseases has been rising in the rural areas and non-communicable diseases were also assuming prominence, which need policy interventions. Of course, private
health sector in the state compared to the government sector is large and fast growing, however, concentrating on diagnostic and curative services. In contrast, the health care provided by the government is more of preventive nature, but obviously inadequate. Budgetary allocations for health sector are far less than needed by any standard. Health care was allocated 7.81 percent of the total expenditure in 1984-85 which declined to about 5.05 percent in 1994-95 while the same as a proportion of GSDP declined from 1.67 percent in 1984-85 to about 0.82 percent in 1994-95. It is pertinent to note that almost 70 percent of the expenditure on health at the secondary hospital level has been spent for salary and wages leaving only a small part for non-wage recurring expenditure. While salaries and wages are expected to account for a large part of revenue expenditures on social services, there is a minimum level of other expenditures that need to be made, keeping in view the complementarities between wage and non-wage expenditures. It is to be noted that the non-wage recurring expenditure at the secondary level declined by 10 percent during 1991-92 to 1994-95, which needs correction.
The Resource Crunch
The Government of Andhra Pradesh, like several other state governments, experienced severe fiscal stress in 1994-95 and 1995-96. The state, which enjoyed revenue surpluses in 1980-81, 1981-82 and 1982-83, was reeling under revenue deficits in all the subsequent years until 1995-96. As a result of unabated growth of expenditure with revenue receipts falling short, budgetary deficits emerged. Fiscal and revenue deficits as a proportion of GSDP were at 3 percent and 0.93 percent respectively in 1995-96. These were not large by themselves, but indicated the emergence of the vicious cycle of deficitsgreater borrowingrising interest burdenhigher deficits. The borrowings increased from Rs.266 crore in 1980-81 to Rs.2,563 crore in 1995-96. The outstanding debt also increased from Rs. 1,781 crore in 1980-81 to Rs.15,164 crore in 1995-96. Besides, almost 31 percent of the borrowed funds were utilised for current expenditures crowding out capital outlays to that extent. The growing debt burden was evident from the increase in per capita outstanding debt, average effective interest rate and per capita interest payments which increased from Rs.336, Rs.4.58 and Rs.15 respectively in 1980-81 to 2115, 11.8 and 213 respectively in 1995-96. Between 1984-85 and 1996-97, interest payments have increased by 12 times reflecting the increased recourse of the government to debt financing and the increasing cost of debt. Plan outlays came down in 1995-96 mainly due to the non-release of the promised level of central
assistance, smaller market borrowings allocated by the Planning Commission and a sharp decline in the resources of the State Electricity Board. Moreover, revenues from taxes like sales tax, and stamp duty and registration fees were well below the budgetary projections. Consequently the government experienced severe resource crunch even in 1994-95, so that it had to rely on overdrafts on a number of days to maintain the cash balance, as may be seen in table-2. The government which did not utilise overdrafts in 1992-93 and 1993-94 at all had to rely on overdrafts for 16 days in 1994-95 and 30 days in 1995-96. In the context of its faltering finances, the state decided to initiate reforms at its level without further delay.
Table 2: Overdrafts by the Government of Andhra Pradesh
Item 1992-93 1993-94 1994-95 1995-96
1) Number of Days on which Minimum cash Balance was Maintaining A Without obtaining any advances 365 36 308 245 B By obtaining Ways and Means Advances - - 41 91 2) Number of Days on which overdraft was taken
- - 16 30
365 365 365 366*
Source: CAG Report, various issues, Andhra Pradesh
• 1996 was a leap year and hence had 366 days.
Section - II
Fiscal Reforms in Andhra Pradesh 1995-96 – 2003-04 In view of the persistent and growing budgetary deficits leading to fiscal crisis and growing levels of public debt, the state government initiated several reforms after 1995-96, more specifically since July-August 1996, the important ones being:
• augmentation of own revenues;
• reprioritisation and restructuring of expenditure;
• better management of expenditure and budgetary practices;
• reforming the power sector and other state level public enterprises (SLPEs); and
• improving governance and transparency in the fiscal
mechanism.
An attempt is made below to analyse important aspects of fiscal reforms implemented by the government with the specific objectives listed above, expected to have direct impact on state finances in most cases. The others, like reform in public enterprises, particularly power sector reforms, were expected to have an indirect impact on state finances.
The government embarked upon the reforms process on the basis of recommendations made in the reports of the Chelliah Committee (1994), the World Bank (1995), Sarma (1995) and the Hiten Bhaya Committee (1995). The vision 2020 document also envisaged the development of plans with short term, medium term, and long term goals. Furthermore, the government released several strategy papers, and Annual Fiscal Framework (MTFF) in Feb. 2001 while implementing the fiscal reforms. These fiscal reforms can be assessed under the broad heads of: i) augmentation of own revenues; ii) expenditure reforms; iii) power sector reforms; iv) reforms in public enterprises; and v) others. Under the last head ‘Others’, issues such as governance, decentralisation having indirect bearing on state finances are discussed.
Augmentation of Own Revenues
Augmentation of own revenues can be through augmenting own tax revenues and own non-tax revenues. Own taxes consisted of 53 percent of total tax revenue in 2001-02. The own tax revenue predominantly consists of revenue from indirect taxes in combination with negligible amount of revenue from direct taxes. For instance, as much as 92 percent of own tax revenue comes from indirect taxes. The important individual indirect taxes that contribute to own tax revenue are sales tax (67 percent), state excises (14 percent), stamp duties and registration fees (7 percent), and motor vehicles tax (8 percent). Entertainment tax is also an important indirect tax in the state but the net proceeds are given to local bodies. The proportion of revenue from other indirect taxes is negligible. The individual indirect taxes comprising sales tax, stamps and registration tax, motor vehicle tax and state excises put together contributed 96 percent of total indirect tax revenues in 2001-02. Direct taxes, such as land revenue and agricultural income tax, contributed only around 8 percent of the total own tax revenue. In view of their importance in
state finances, the analysis is confined to individual indirect taxes such as sales tax, state excises, stamps and registration and motor vehicle tax followed by an analysis of non-tax revenues.
Sales Tax
As stated above, sales tax is the most important tax for the state government but has been riddled with the problem of multiplicity of rates, too many slabs and commodity groups besides a plethora of exemptions and concessions, and requires a thorough reform. The state government has already implemented almost all the recommendations made by the Chelliah Committee (1994). It has abolished the turnover tax, additional tax, surcharge and introduced the trade margin VAT for dealers trading at the second and subsequent points of sale of 19 groups of the commodities. Andhra Pradesh is one of the major states that has introduced the agreed floor rates of sales tax, since January 2000. It has also withdrawn the tax incentives hitherto provided to industries in order to discourage the rate war among the states to attract the industrial investments. Moreover, the tax slab rates and the commodity grouping have been thoroughly rationalised. The Department of Commercial Taxes all over the state has been computerised to improve the administration and efficiency of the tax system. As far as the implementation of VAT at the state level is concerned, Andhra Pradesh has been one of the best prepared states to launch the same and prepared a draft VAT law and also completed preparation for establishment of large VAT taxpayers units (LTUs). Out of the forty four check posts in operation earlier, twelve were inter-state check posts and thirty-two were internal check posts. While the government abolished all the check posts initially, the internal check posts had to be restored later. Also, the turnover tax abolished earlier was restored. The reforms initiated with regard to sales tax yielded good results as the revenue from this tax as a proportion of GSDP increased from 3.70 percent in 1995-96 to 5.21 percent in 2003-04. As there has been some rollback of reform measures, it remains to be seen whether the improvement in revenue performance can be sustained.
State Excise Duty
Prohibition was in force in 1995-96 when the need for reforms was felt. In view of the fiscal pressure and government’s realisation of the difficulties in implementing total prohibition, it was partially withdrawn since August 1996. More reforms are necessary in this second most important own tax revenue with regard to systematic changes and further simplification of the administrative
procedures including broadening of the base. The government has now fully withdrawn prohibition and has also liberalised the policy of licensing for sales outlets and bars, which further increased the buoyancy of revenue in the subsequent years. As a result, the excise revenue has increased from 0.10 percent in GSDP in 1995-96 to 1.05 percent in 2003-04.
Stamp Duties and Registration Fees
The objective of stamp duties and registration fees are totally different. The aim of stamp duty is to collect revenue. Registration fees controls and regulates the transaction of property rights. Both ad
valorem and specific methods of taxation are in vogue. The
differential rates prescribed for property valuation and utilised to determine the value of the tax base used to be revised at irregular intervals till 1995. This system was revised in 1997. Accordingly, the annual revision of market value for urban areas is scheduled from first August every year and for rural areas the same is fixed with effect from first April of every alternative year. The government’s revision of market value guidelines for sale registrations and for the General Power of Attorney (GPAs) has become indeed effective for augmenting revenue. The registration fees have been cut down by half in order to lessen the burden on the registering public which may also enhance the tax compliance. In order to reduce the high level of evasion, the Committee of State Finance Ministers on Stamp Duty Reform recommended that the duties of states should be brought in the range of 5 to 10 percent in the short run, and 6 to 8 percent over the medium range. The government made a policy that the photographs of both the parties should be affixed on the sale deeds with effect from May, 2002 by which the bogus transactions could be controlled. The introduction of Computer-aided Administration of Registration Department (CARD), office computerisation and rationalisation of procedures and concessions yielded good results and improved the tax yields. Revenue from this source as a proportion of GSDP increased from 0.41 percent in 1995-96 to 0.57 percent in 2003-04.
Motor Vehicles Tax
Motor vehicles tax (MVT) is more important than stamp duty and registration from the point of view of revenue right from the beginning since the revenue of MVT as a proportion of GSDP has been higher than that of stamp duty and registration. The proportion of revenue from motor vehicles tax in GSDP was as high as 0.69 percent in 1984-85 which declined during the latter period. This is
mainly because of large scale exemptions and concessions provided by the government to different types of private operators. The revenue loss may be partly attributed to the differential tax rates of motor vehicles tax and illegal operations of the private vehicle owners in the state. The government’s efforts to increase revenue realisation by better administration and enforcement yielded good results though a lot more can be done with regard to this revenue.
Taxes on Professions, Trades and Callings
The state is empowered to levy a tax on professions, trades, callings and employments as per the state list of the seventh schedule of the Indian constitution. The maximum amount of tax, fixed at Rs. 250 per annum originally, has been revised in 1988 to Rs. 2,500 per annum through an amendment of the constitution. There are about 20 categories of professions with certain sub-categories within them, which are subject to profession tax. However, the revenue from this tax has been less than its potential as several potential taxpayers especially the self-employed are not brought into the tax net. Moreover, the state government does not have the benefit of the revenue from this tax as 95 percent of net revenue is assigned to the local bodies on the basis of origin principle. An increase in revenue from this will improve the financial position of the local bodies reducing their fiscal dependence on the state government for financial resources.
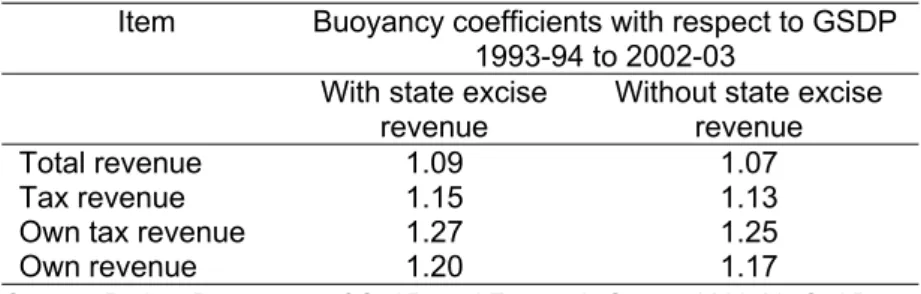
Table 3: Buoyancy Coefficients of Revenue
Item Buoyancy coefficients with respect to GSDP
1993-94 to 2002-03 With state excise
revenue Without state exciserevenue
Total revenue 1.09 1.07
Tax revenue 1.15 1.13
Own tax revenue 1.27 1.25
Own revenue 1.20 1.17
Source: Budget Documents of GoAP, and Economic Survey 2002-03, GoAP.
As a whole, tax revenues have recorded buoyancies above unity during the reform period. Buoyancy coefficients of important aggregate revenue variables for the period 1993-94 to 2002-03 have been estimated with state excise revenue and without it. In both the cases, own tax revenues obtained the highest coefficient indicating the good effort of the state on the tax front. Also an attempt is made to compare, in a broad way, the tax effort of the state in relation to
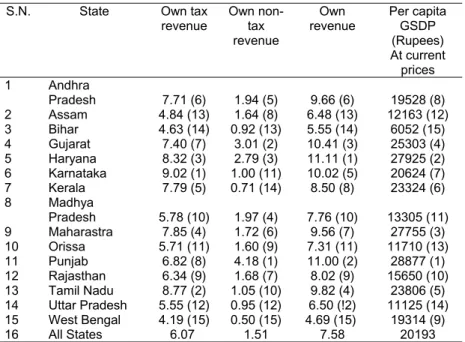
per capita GSDP for the year 2001-02. Own tax revenue, own non-tax revenue, own revenue and per capita GSDP of the major fifteen states and their respective ranks are presented in table 4. It may be observed from the table that Andhra Pradesh revenue ratios in GSDP are higher than the all-states ratios even though its per capita GSDP is less than the all-states average. The state obtained rank 6 with regard to own revenue and own tax revenue and rank 5 with regard to own non-tax revenue while having rank 8 in per capita GSDP. It may also be inferred from the table that the state’s tax performance is better than states like Maharashtra, Gujarat, Punjab, and West Bengal. The government needs to gear up its administration to collect the huge amount of Rs. 2,231 crore of the tax arrears in 2001-02 of which Rs. 1,981 crore are in sales tax (Report of the CAG, GoAP 2001-02).
Table 4: States’ Own Revenues as a Ratio of GSDP – 2001-02
S.N. State Own tax revenue Own non-tax revenue Own revenue Per capita GSDP (Rupees) At current prices 1 Andhra Pradesh 7.71 (6) 1.94 (5) 9.66 (6) 19528 (8) 2 Assam 4.84 (13) 1.64 (8) 6.48 (13) 12163 (12) 3 Bihar 4.63 (14) 0.92 (13) 5.55 (14) 6052 (15) 4 Gujarat 7.40 (7) 3.01 (2) 10.41 (3) 25303 (4) 5 Haryana 8.32 (3) 2.79 (3) 11.11 (1) 27925 (2) 6 Karnataka 9.02 (1) 1.00 (11) 10.02 (5) 20624 (7) 7 Kerala 7.79 (5) 0.71 (14) 8.50 (8) 23324 (6) 8 Madhya Pradesh 5.78 (10) 1.97 (4) 7.76 (10) 13305 (11) 9 Maharastra 7.85 (4) 1.72 (6) 9.56 (7) 27755 (3) 10 Orissa 5.71 (11) 1.60 (9) 7.31 (11) 11710 (13) 11 Punjab 6.82 (8) 4.18 (1) 11.00 (2) 28877 (1) 12 Rajasthan 6.34 (9) 1.68 (7) 8.02 (9) 15650 (10) 13 Tamil Nadu 8.77 (2) 1.05 (10) 9.82 (4) 23806 (5) 14 Uttar Pradesh 5.55 (12) 0.95 (12) 6.50 (!2) 11125 (14) 15 West Bengal 4.19 (15) 0.50 (15) 4.69 (15) 19314 (9) 16 All States 6.07 1.51 7.58 20193
Source: CMIE, Public Finance, November 2003. Note: Figures in brackets indicate ranks of the states.
Non-Tax Revenues
Non-tax revenue consists of own non-tax revenues and grants-in-aid from the central government for various purposes. Own non-tax revenues of the state consist primarily of interest receipts and dividends from different types of public sector undertakings. More than half of the own non-tax revenues accrue from this source. The remaining own non-tax revenue comes from user charges relating to general, social, and economic services provided by the government departments. Own non-tax revenues of the state as a proportion of GSDP exhibit a decline since late 1980s (chart-2). It may be observed that the proportion of receipts from economic services have been higher than the proportion of receipts from social and general services throughout the period though the proportion never exceeded 1 percent in GSDP.
The government has initiated several cost recovery measures and user charges with regard to various departments and has allowed the departments concerned to retain the amount to provide incentives as well as to improve the delivery systems of the services. The retention system of user charges should allow the users themselves to have the benefits of the amount they pay. The cost recovery and user charges are more evident in the departments of irrigation, transport, police and hospitals wherein the concerned authorities are empowered to collect and plough back the user charges they collect. The Water Users Associations (WUAs), which were established to maintain and improve the efficiency of the
irrigation systems, and the Vana Samrakshana Samithies (VSS)
have been vested with the authority to utilise a share of the collected fees and proceeds of minor forest produce respectively. As a result of these measures, own non-tax revenue as a proportion of GSDP shows improvement since 1997-98 over the ratio of 1996-97 though the ratio has not reached the level that prevailed before 1995-96. Non-tax revenue as a proportion of GSDP declined in 1996-97, 1997-98, and 1998-99 from the 1995-96 level but showed an improvement since 1999-2000. The increase in the ratio in 2001-02 is due more to an increase in the grants-in-aid than an increase in the own non-tax revenues implying the need for further reforms to augment own non-tax revenues in the state.
Reforms in Expenditure
The most important element of reforms in expenditure is restructuring public expenditure in such a way as to increase the developmental impact of expenditure and simultaneously reducing
unproductive revenue expenditure through a policy of reprioritisation of the expenditure items. In concrete terms, these would imply reducing the establishment costs, rationalisation of subsidies, revamping welfare schemes, reforming the SLPEs and simultaneously increasing expenditure on infrastructure, both physical and social, as well as expenditure on operation and maintenance of public assets.
Public expenditure can be categorised as revenue and capital expenditure, Plan and non-Plan expenditure, and developmental and non-developmental expenditure. While revenue expenditure includes expenditure on maintenance of the government machinery and its assets, which includes items like establishment costs, interest payments, subsidies, and pensions and gratuity, capital expenditure means expenditure used for creation of assets. It is to be noted that in general, higher the size and growth of capital expenditure, higher would be the growth prospects of the economy. The same classification is used in the present analysis as the other two types automatically fall in one of these categories of expenditure.
Growth of Expenditure
Revenue Expenditure
As the structure of public finances in an economy is defined by the level and composition of public expenditure and the method of its financing, an analysis of the growth of revenue and capital expenditure assumes importance. Revenue expenditure, which was Rs. 1,161 crore in 1980-81, increased to Rs. 30,315 crore in 2003-04 (revised estimate) registering an increase of 2,511 percent. The proportion of revenue expenditure in GSDP during 1980-81 to 2003-04 is presented in chart-3. Revenue expenditure was 16.51 percent of GSDP in 1990-91, but shows a declining trend since 1995-96 indicating some compression of public expenditure due to fiscal reforms. It again shows an increasing trend from 2000-01 onwards. The ratios relating to revenue expenditure show comparatively greater increase than those relating to capital expenditure. Revenue expenditure as a proportion of total expenditure has increased from 78 percent in 1980-81 to 83 percent in 1999-2000 and further to 87 percent in 2003-04. This reveals the undue growth of revenue expenditure at the cost of the growth of capital expenditure in the state. These trends may be observed in chart 4.
Chart 4: Public Expenditure of Andhra Pradesh -5.00 0.00 5.00 10.00 15.00 20.00 1980-81 1984-85 1990-91 1995-96 1996-97 1997-98 1998-99 1999-00 2000-01 2001-02 2002-03 2003-04 As Percentage to GSDP
Revenue Expenditure Capital Expenditure
Major Items of Revenue Expenditure
The large size and fast growth of Plan non-developmental expenditure in the revenue account is mainly due to certain items of expenditure, such as, pay and allowances (including salary grants), pensions and gratuity, and interest payments as shown in table 5. The indices for these expenditure items have been calculated and presented in the table. It may be seen from the table that the index of salary expenditure has increased to 905 in 1995-96 and has further increased by 2032 in 2003-04. This is mainly due to the fast growth of public sector employment until 1995-96 and the
revision of scales of pay thereafter, imposing a heavy burden on the government budget. Of course, this is not a unique experience of Andhra Pradesh as several other states have had similar experiences. For example, the expenditure on administrative services in Maharashtra, which was just about 10 percent of revenue expenditure for more than a decade and a half (from 1980-81 to 1997-98), shot up to 25 percent in 1998-99 mainly owing to the impact of the Fifth Pay Commission (Godbole, 2003). Moreover, the impact of revision of pay scales is much more severe on the states than on the centre as the share of salary expenditure is higher (Rao, 2002). The pay revision created a fiscal crisis of unprecedented dimension for the state government (Kurian, 1999) and Andhra Pradesh was no exception.
Table 5: Indices of Select Items of Non-Developmental Expenditure
Year Pay &
Allowances (including salary grants) Pensions/ Gratuity Interest payments Revenue expenditure Rs. crore Ind-ex Rs. crore Ind-ex Rs. crore Ind-ex Rs. crore Ind-ex 1980-81 433 100 38 100 82 100 1161 100 1991-92 2608 602 441 1161 695 848 6452 556 1994-95 3799 877 780 2053 1256 1532 9514 819 1995-96 3917 905 928 2442 1529 1865 10614 914 1996-97 4394 1015 1004 2642 1839 2243 14392 1240 1997-98 4939 1141 1139 2997 2153 2626 14544 1253 1998-99 5628 1300 1373 3613 2644 3224 16944 1459 1999-00 6981 1612 1626 4279 3161 3855 18038 1554 2000-01 7612.11 1758 2378 6258 3793 4626 23070 1987 2001-02 7791.87 1800 2321 6108 4584 5590 24725 2130 2002-03 8371.06 1933 2364 6221 6131 7477 26057 2244 2003-04 r.e. 8799.3* 2032 2426 6384 6919 8438 30315 2611
Source: Same as Table 1.
Note: r.e indicates revised estimates.
Similarly, the expenditure commitments on pension and gratuity have also spurted, the index of this expenditure being 6,826 in 2002-03 mainly due to the large scale retirements and also owing to revision of pension alongwith the revision of scales of pay of the employees. Again the situation is more or less similar in several states and possibly more serious in some other major states than in Andhra Pradesh. On top of this, the expenditure on interest payments has increased phenomenally registering an index of 8,438 in 2003-04. The spurt in expenditure on interest payments is a consequence of not only a continuous increase in the volume of borrowings but also the change in the nature of borrowings, rising interest rates, and reduction in the size of low cost borrowings from the public account. It is pertinent to note that while revenue expenditure registered a growth in index of 2,611, gratuity and pensions and interest payments registered an index of 6,384 and 8,438 respectively over the period 1980-81 and 2003-04. Though the expenditure on rice subsidy – another element of revenue expenditures – was large prior to 1996, it has been successfully lowered.
Table 6: Pension Payments of Major States in 2002-03 (b. e.) (Rupees in crore) State Pension Andhra Pradesh 2560 Bihar 2038 Gujarat 1435 Karnataka 1943 Kerala 1820 Maharastra 2307 Orissa 1451 Rajasthan 2028 Tamil Nadu 3176 Uttar Pradesh 2662 West Bengal 2095 All States 30396
Source: The Economic Times, Feb.27th 2004.
With a view to reducing the salary bill, several measures were initiated to check the growth of employment in the public sector.
An Act emphasising upon prior approval for making fresh
appointments was passed and the government appointed the
Gangopadhyay Committee to assess the available positions in the
government, identify redundant staff, and recommend for their redeployment. The committee identified a large amount of redundancy, e.g., 40 percent in the irrigation department. The government followed an attrition policy (by which it reduced 0.9 percent of employment every year since 1996-97) besides the policy of voluntary retirement and redeployment among different government departments. The overall size of the civil services was reduced by 2.6 percent through attrition (Strategy Paper, 2001). As a result, the growth of government employees was less than one percent on an average per annum in the post reform period compared to 3.4 percent per annum, prior to 1996-97. The downsising policy has been extended to the aided institutions as well. However, the government allowed fresh recruitment in the human development departments of education, health, and police, besides the limited recruitment of backlog posts for SC and ST categories. The abovementioned measures helped the government to keep the salary bill under control, thereby compressing the revenue expenditure in the state. For instance, the expenditure on salaries and pensions as a percentage of states’ own revenue declined from 68.17 percent in 2000-01 to 62.18 percent in 2002-03 (r.e) (Annual Fiscal Framework, 2003-04).
Though the government successfully contained the salary bill, the pension commitment has been on the increase mainly due to the extension of the pension benefit to the local bodies and other aided institutions besides the revision of pensions. Efforts have been made to adopt pension reforms by devising appropriate strategies to contain the future pension commitment, but the immediate impact on the pension bill is likely to be small.
Rice Subsidy
The rice subsidy, which was a huge burden to the government, has been reduced both by revising the issue price from Rs. 2 to Rs.3.50 per kg and by weeding out bogus cards on a large scale. The rice subsidy as a proportion of the total revenue expenditure has come down except in the year 1999-2000. The subsidy expenditure increased suddenly in 1999-2000 due to steep price increase in the issue price of Food Corporation of India and the consequent absorption of the full impact by the government. In fact
Rs.100 crore were expected to be saved in expenditure on rice subsidy during 2002-03 on account of efficiency brought about in the public distribution system, based on issue of food coupons to draw monthly entitlements. Further streamlining and weeding out of bogus cards would further reduce the financial commitment.
Chart -5 Trends in Capital Expenditure in A dh Pradesh -2 0 2 4 6 8 1980-81 1984-85 1990-91 1994-95 1995-96 1996-97 1997-98 1998-99 1999-00 2000-01 2001-02 2002-03 2003-04 r Pe rc en ta g e i n G SD P
Capital O utlay Capital Expenditure Capital Expenditure
The unabated increase in revenue expenditure has resulted in the reduction of capital expenditure. The proportion of capital expenditure in GSDP during 1980-81 to 2003-04 (r.e) is presented in chart 5. It may be observed from the chart that the capital expenditure-GSDP ratio declined to 2.10 percent by 1995-96 from 3.98 and 3.29 percent in 1980-81 and 1984-85 respectively. The negative ratio of capital expenditure in 1996-97 is due to a decline in net lending which is one of the components of capital expenditure, the other being capital outlay. The negative net lending in 1995-96 and 1996-97 is owing to the waiver off of government loans to APSEB and also due to the conversion of government loans to APSEB into equity. The sudden fall in capital outlay during 1996-97 is due to the conversion of Rs. 907 crore of equity of APSEB as subsidy by the government. The proportion of capital expenditure has increased gradually during the reform period to reach 2.99 percent in 1999-2000 but subsequently declined. The capital outlay which declined to an all time low of 0.15 percent in 1995-96, gradually increased and reached 2.31 percent in 2002-03. Chart–6 shows the average capital expenditure and its constituents during the initial and the concluding period of reforms with a view to making a comparison. A substantial increase in capital expenditure may be observed. The increase in capital expenditure is mainly due to the allocations for the development of social sector and infrastructure. Of the three
categoriesgeneral services, social services and economic services
the share of economic services, though the largest throughout the
period, declined gradually while the share of general services and the social services increased considerably. The increased expenditure
on social services has been mainly caused by the enhanced outlays on primary education, primary health and rural water supply schemes. It is pertinent here to note that the proportion of plan expenditure in the total expenditure has been on the rise continuously from 19.74 percent in 2000-01 to 21.29 percent in 2001-02 and to 26.24 percent in 202001-02-03; this is perhaps a good omen for economic development.
Infrastructure Development
Infrastructure (in the conventional sense) needs to be developed by enhancing the capital expenditure as it has high correlation with economic development. The government constituted an Infrastructure Development Fund in 2001-02 by allocating Rs. 82 crore to meet the critical counterpart investments to encourage public-private partnerships. It has enacted an Infrastructure Development Enabling Act (IDEA) besides making huge investments in irrigation and power, roads, communications, transport, ports and airports and information technology. Besides domestic resources, the government of Andhra Pradesh mobilised foreign investments to develop infrastructure especially in the area of power, ports, and information technology. However, the spread of investments in the state during the reform period especially in roads, communications, and IT has been subjected to criticism that a large chunk of
resources mobilised for infrastructural development has been invested in and around the city of Hyderabad only ignoring the considerations of balanced regional development. For example, seven flyovers have been constructed in Hyderabad at an estimated cost of Rs. 52 crore and a few more are in progress, but in some parts of the state roads are awaiting normal maintenance. On the positive side, while developing economic infrastructure, the government simultaneously encouraged development of social infrastructure as well.
Increased Allocations for the Social Sector
Adequate allocation to the vital sectors within social services of health and education in general and primary education and primary health in particular, was a priority area of the fiscal reform programme. The allocations to social sector have increased in recent years. As a result, the expenditure on social services as a proportion of GSDP has been 5 to 6 percent except in 1998-99, the capital expenditure shows a discernible improvement during the period 1995-96 to 2002-03. Similarly, education and health expenditure as a proportion of GSDP shows quite an improvement. The thrust of the reforms have been to achieve the target of universal primary education and improving the primary health care especially in the rural areas. The government made efforts to improve the service reach to remote areas and communities as far as primary education and primary health care are concerned.
The government has increased budgetary allocation on primary education to achieve universal elementary education by 2005, the key strategy being improved access to schools (providing 98 percent of the rural habitations with primary schools within a distance of 1 km). A massive recruitment drive of school teachers and construction of thousands of primary school buildings have been
taken up under different programmes especially under the A.P.
Economic Restructuring Project. Moreover, the government enacted
a lawA.P School Education Community Perception Act 1998to
encourage community participation in order to improve both the spread and quality of education. School committees are constituted in every village which would plan, manage and promote education by
engaging Vidya volunteers. In order to encourage primary education
among specific social groups and to discourage dropouts, the government implemented programmes like ‘Back to School’. As the financial resources earmarked for primary education are transferred to these committees accountability and transparency of this amount of public expenditure has increased.
With regard to primary health, especially in the rural areas, the investments are scaled up to ensure that all primary health centres (PHCs) have their own buildings, providing the staff necessary equipment and also with adequate drugs and consumables. Besides, several referred hospitals have been
upgraded under the A.P First Referral Health Systems Project. While
the increased budgetary allocations have helped in the construction of new buildings and renovation of old buildings of the PHCs, provision of adequate drugs and consumables is still a dream in the rural areas. It is pertinent to increase the allocations further in order
to achieve the goals envisaged in Vision 2020 with regard to
education and health. Moreover, it is necessary to increase the capital component compared to the salary component of the allocation for these two vital sectors.
Operation and Maintenance Expenditure
The government allocated more funds for the non-salary operation and maintenance in view of its importance in the economy. Consequently it has increased from 0.5 percent of GSDP in 1995-96 to 1.7 percent in 2000-01 and was estimated to go up to 1.8 percent of GSDP in 2002-03. This may be attributed as a significant outcome of the fiscal reforms in the state. However, the purpose of increased allocation would not be served unless the funds are purposefully and properly utilised.
Treasury Reforms
Several reforms have been introduced in the treasury to enhance fiscal discipline and transparency in financial transactions. While the government has computerised the pensions and salaries of government employees, and the same are being paid through banks, it has also introduced Treasury Audit System (TAS) to counter check any irregular payments. It also introduced Integrated Finance Information System (IFIS) to capture detailed information on a daily basis and has standardised the accounting system in all the treasuries throughout the state. Relational Data Base Management
System (RDBMS) software known as ‘e- Khajana’ has been
introduced in all treasuries besides implementing several measures to improve the performance and accountability in all the treasuries and sub-treasuries in the state.
Budgetary Reforms and Expenditure Efficiency
As part of fiscal reforms, the government changed several budgetary practices and introduced new procedures. It made available the budget document, for the first time, in electronic form on the internet and also in a compact disc. Several attempts have been made to demystify and simplify the budget and overlapping of schemes has been avoided by merging similar schemes into generic programmes integrating the respective heads of account by which precious and scarce resources could be conserved. Experience has shown that heavy rush of expenditure in the last couple of months, especially in March, impairs the quality and questions the accountability of public spending. A new cash management system has been formulated which assures compliance with the budget and consistency with seasonality. With assured budget releases, the government departments concerned are now in a position to plan their schemes and execute them. The performance of each department is to be reviewed half-yearly, which facilitates better cash management and provides a broad link to the ensuring budget preparation. All these measures are supposed to enhance the expenditure efficiency and avoid rush of expenditure. But there still exists extraordinary rush of expenditure in the last months of the financial year. It may be seen from table 7 that instead of spreading the expenditure evenly in all the four quarters, 39 percent was spent during the last quarter in 2001-02. It is also interesting to observe that 22 percent of the total expenditure has been spent only during March 2002 in spite of several reforms initiated with regard to cash management and release of funds.
Table 7: Year -End Rush of Expenditure
Quarter ended Expenditure
(Rs. crore) Percentage to totalexpenditure
30th June 2001 4259.49 15.31
30th bSep.2001 6806.29 24.47
31st Dec. 2001 5787.50 20.81
31st March 2002 10964.00 39.41
Total Expenditure 27817.29
Expenditure during March
2002 6172.08 22.19
Reforming the Public Sector Units
The government appointed an implementation committee to suggest appropriate measures for restructuring, privatisation, downsising or closure of the public as well as cooperative enterprises. The committee recommended that the reform process be split into two phases. Accordingly, the government privatised 8 units, closed 6 while downsising and restructuring or divesting 5 units during the first phase, namely, 1999-2001. The reforms during the first phase encompassed cooperatives and public enterprises including some important corporations like the Andhra Pradesh State Agro-Industries Development Corporation, Andhra Pradesh State Irrigation Development Corporation and A.P Meat Development Corporation. Under the second phase, the government intended to initiate reforms relating to 68 units during 2001-05, but actually the reform process had started in April 2002 to be over by 2006. The target of reforming 22 units out of 68 has already been achieved by 2003-04. The 68 identified units under the second phase include cooperative sugar mills, spinning mills besides the APSRTC and the AP Seeds Corporation. Consequent upon the reforms in SLPEs, a large number of employees have opted for or have already availed of voluntary retirement scheme (VRS) and the government successfully counseled, retrained, or redeployed the employees as shown in table 8. The VRS has also been implemented in those units which are not identified for privatisation or closure in order to improve operational efficiency, financial health, and cost effectiveness of these units. The government has incurred an outgo of Rs.323.44 crore on account of VRS schemes. The bulk of the proceeds that are augmented through reforms would be used for settling the outstanding liabilities of the enterprises concerned.
Table 8: VRS to SLPE Employees from 1999
Item Number
Number of employees opted / availed VRS 22269
Amount disbursed under VRS (Crs) 323.44
Employees counselled 8600
Employees retrained 4819
Employees redeployed 1748
The Fiscal Impact
Reforms in public enterprises will have an important fiscal impact on the finances of the state government. The estimated gross fiscal impact of 54 units is shown in table 9. It may be observed from the table that the companies/cooperatives and the Listed companies put together enjoyed budgetary support of Rs.1,283 crore during the pre-reform (1996-2001) scenario. The budgetary support would have increased to Rs. 2,512 crore during 2001-05 in the absence of reforms. The table also shows the estimated savings under the reform programme, an amount of Rs.1,332 crore. This indicates the fiscal importance of reforms in public enterprises in the state. Moreover, the resources that are freed from these inefficient units can be used for the development of the social sector. It has been
estimatedi that the resources available to the state government by
implementing the first phase of the enterprises reform project could be utilised either for creation of 9.16 lakh new jobs or for implementing a mega water supply scheme worth Rs. 886 crore or 11 thousand new primary schools, 7,333 kms of metalled road or setting up of 4,400 primary health centres or 44 new medical colleges or for resettlement of 2,200 households in slums (FIA study). However, the government needs to take into consideration the amount of social welfare generated by these units. For example, a large public sector undertaking like the Road Transport Corporation, with its wide network and huge investment may not be easy to replace in terms of the several social objectives it has been serving. A manufacturing or trading enterprise which is not rendering any social welfare to the community and incurring financial losses continuously is a better bet for reform.
Table 9: Gross Fiscal Impact of Public Enterprises on State Finances Nature and Number of
Public Enterprises 48 Companies/ Cooperatives 6 Joint Stock Listed Companies Total Amount (Rs. In crs.) Budgetary support (1996-2001) Pre-reform scenario 1259 24 1283 (2001-2005)No reform scenario 2483 29 2512 Estimated savings under reforms 1308 24.16 1332
The Power Sector
The power sector reform is crucial to fiscal reforms due to its heavy dependence on budgetary support. The gross budget support to this sector, including interest payments on outstanding power sector liabilities totals over 2 percent of GSDP (Memorandum to Third Finance Commission, 2003). The power sector was financially comfortable until 1991-92 (Rao and Dev, 2003). The financial position deteriorated slowly since 1992-93 with losses accumulating for a variety of reasons like increase in the cost of inputs, steep increase in the growth of consumption of subsidised segments like agriculture and domestic compared to industry and business, shift of industrial consumers from the grid to captive generation, growing interest burden, borrowing for unremunerative purposes, non-revision of tariffs from time to time and on top of all a significant fall in the hydro-thermal mix in generation. In order to financially bail out the APSEB and in line with the general economic reform process, the
government implemented the Hiten Bhaiya Committee
recommendations. Andhra Pradesh is one of the major states that has implemented a wide range of comprehensive reform measures in
the power sector. The government enacted A.P. Electricity Reform
Act 1998 and accordingly has unbundled the APSEB into two
separate companies – AP Transmission Company (APTRANSCO) and A.P. Generation Company (APGENCO) with effect from February, 1999. The government also established an independent regulatory commission known as Andhra Pradesh Electricity Regulatory Commission (APERC) in March 1999, which is solely responsible for electricity generation and transmission licenses and also for regulation of tariffs.
Since the government initiated power reforms, several international funding agencies from Japan, UK, China, Germany, and Canada besides the World Bank came forward for the construction of power projects, improving the distribution system and otherwise to participate in the power restructuring programme. The World Bank agreed to extend a loan of $1billion in five tranches under the Adaptable Program of Lending (APL) for strengthening the transmission and distribution network of APTRANSCO. Four separate distribution companies (DISCOMS) have been established in April, 2000 which are responsible for distribution of power in the state. The APERC has so far given five tariff orders for 2000-01, 2001-02, 2002-03, 2003-04 and 2004-05 besides directing enumeration of agricultural pump sets in order to estimate the agricultural consumption. Agricultural consumption in Andhra Pradesh is one of the highest among several major states especially
among the southern states at 43 percent of the total sales, being also higher than the developed state of Maharashtra and the power reforms pioneering the state of Orissa. The consumption share of domestic, the other subsidised segment, is also relatively high.
The APERC issued directives to ensure that metering is completed so as to have better data on the agricultural sales and transmission and distribution (T&D) losses. As a result of several measures initiated to reduce the T&D losses, they have been reduced from 38 percent of the energy availability in 1999-2000 to about 24 percent by March 2004 (Budget Speech, 2004), but needs further reduction. In order to bring down the commercial losses due to theft and malpractice, an anti-theft law has been passed in September, 2000. Even though several reform measures have been initiated to reduce the T&D losses and increase the efficiency, and even after the new tariff orders have been issued, the commercial losses persist. The APTRANSCO proposed in April, 2000 to cover the losses in the following manner: 22 percent by tariff hikes, 14 percent through efficiency gains and 63 percent through government subsidies. The ERC increased the tariff on agriculture consumption through its orders, but the agriculture tariff contribution is still too low. For instance, according to the tariff order 2004-05 of APERC, the revenue from agriculture is Rs.409 crore while the total subsidy amounts to 1442 crore for 2004-05. This suggests an increase in the agriculture tariff along with other hitherto subsidised segments. Otherwise, the financial impact on the state budget in terms of subsidies (Rs.1,666 crore in 2000-01 and Rs.1,500 crore in 2003-04) would continue unabated. The reform process in the power sector needs to be continued as envisaged in the business plan for power sector, 1998 in order to attain the target of phasing out budgetary support by 2005-06. Private participation, which is at present comparatively low in this vital sector, needs further encouragement to fulfil the targets of reform. While private participation is low, the power plants which were started under the private sector have been facing the problem of scarcity of inputs (natural gas) which needs urgent attention by the government. The decision of the government to provide free power1 to agricultural irrigation pump sets will further intensify the adverse fiscal impact on the state budgets.
Governance
Governance plays an important role in implementing policy initiatives, both financial and non-financial. Moreover, governance issues have an implicit relationship with improving compliance and reducing compliance costs (Howes, Lahiri, and Stern, 2003). It is