Study prepared for the European Commission,
DG Information Society and Media under reference
SMART 2009/0066
Final Report
March 2011
of Photonics Technologies:
the European Perspective
Knowledge Transfer Network
Authors:
Maurits Butter,
Miriam Leis,
Marijn Sandtke
(TNO)
Mick McLean
(Technologia)
John Lincoln,
Alastair Wilson
(Electronics,
Sensors,
Photonics Knowledge
Transfer Network)
Study prepared for the European Commission,
DG Information Society and Media under reference
SMART 2009/0066
Final Report
March 2011
of Photonics Technologies:
the European Perspective
Authors:
Maurits Butter, Miriam Leis, Marijn Sandtke (TNO)
Mick McLean (Technologia)
John Lincoln, Alastair Wilson (Electronics, Sensors,
Photonics Knowledge Transfer Network)
Knowledge Transfer Network
The opinions expressed in this study are those of the authors and do not necessarily reflect the views of the European Commission.
© 2011, European commission Printed by TNO, Delft
Contact information: Maurits Butter (TNO)
Contents
Executive Summary . . . 5
1 Introduction to the study . . . 9
1.1 Backgrounds to the study . . . 10
1.2 Objectives of the study . . . 11
1.3 Approach to the study . . . 12
2 The photonics industry . . . 17
2.1 Introduction . . . 18
2.2 The Photonics industry is substantial and still in its early industrial stage . . . 19
2.3 Strengths of the EU photonics industry. . . 22
2.4 Implications for EU policy. . . 25
2.5 Conclusions for the assessment of the photonics industry . . . 29
3 Looking at the value chains . . . 31
3.1 Introduction . . . 32
3.2 Scanning, sensing and imaging . . . 33
3.3 Information, communication and networks . . . 46
3.4 Screens and displays . . . 58
3.5 Advanced lighting . . . 69
3.6 Photonic energy systems . . . 79
3.7 Laser systems . . . 89
3.8 Conclusions for the value chain analysis . . . 100
4 Leverage of photonics . . . 103
4.1 Introduction . . . 104
4.2 Leverage assessment on markets and employment . . . 105
4.3 Trends in industries 2010-2020. . . 108
4.4 Trends in leverage from photonic technologies . . . 111
4.5 Conclusion on the leverage assessment . . . 118
5 Main drivers for change . . . 119
5.1 Introduction . . . 120
5.2 Demographic drivers . . . 121
5.3 Economic drivers . . . 124
5.4 Social drivers . . . 128
5.6 Ecological drivers . . . 133
5.7 Political drivers . . . 135
5.8 Conclusions for the drivers of change . . . 137
6 Scenario analysis . . . 139 6.1 Introduction . . . 140 6.2 Gadget world . . . 141 6.3 Green innovation . . . 142 6.4 Budget society. . . 144 6.5 Emergency . . . 145 6.6 Conclusions . . . 147 7 Final conclusions . . . 151 7.1 Introduction . . . 152
7.2 The European photonics research and industry base is globally significant . . . 152
7.3 The field of photonics is growing fast and creating vast opportunities . . . 154
7.4 Also focus on large sectors where photonics has the potential to enhance competitiveness . . . 155
7.5 Establish a specific policy to support SMEs . . . 155
7.6 Support the vertical connection between research and industry . . . 156
7.7 Participate actively in photonics as government . . . 157
7.8 Create an active policy to ensure the availability of highly skilled personnel . . . 158
7.9 Focal areas: Non–consumer markets, with exceptions . . . 159
References . . . 162
Annexes:
A Overview of photonics technologies in application domains B Backgrounds on leverage assessment
C Four future scenarios of Photonics
D Overview of experts consulted in the interviews and the workshop E Overview of sources used in the economic assessment
F Overview of connections made between the leveraged industries and markets and the NACE sectors
Executive Summary
The objective of this study was to understand and quantify the impor-tance of photonics as key enabling technology for the European economy, by investigating the leverage effect of photonics technologies on photon-ics-enabled applications, markets and related value chains, and by assess-ing the potential socioeconomic and environmental impact of photonics technology take-up. A central element of the study was the analysis of the structure and dynamics of the European value chains in key photonics technologies, and of how these value chains may develop in the future. To understand better the European position, a full analysis of six distinct photonics value chains was conducted considering a number of drivers for change drawn from social to economic, demographic to political and technological to environmental factors. The six value chains are:
● Scanning, sensing and imaging systems
● Data transmission, storage, communication and networks
● Screens and displays
● Advanced lighting (confined to solid state lighting alone)
● Photonic energy systems
● Laser systems
In all value chains Europe was found to have a strong research and de-velopment position, although in many cases R&D in more consumer oriented areas was not well represented. Volume manufacturing was absent in most value chains with the clearest gaps in displays and low value imaging components. This results in poor linkages in some value chains between early stage development and volume production that make it difficult for Europe to gain full economic benefit of successful mass market products. However, Europe was found to be strong in high value, high performance products, including the production of manu-facturing equipment, giving it some economic gain from increases and improvements in volume production. The value chain in laser systems, in particular, was found to contain many significant global players and the links between the value chain elements were strong. Several value chains were also found to be threatened by a dependency on Rare Earth materials available as raw materials from only a few global locations.
The economic impact of all value chains was seen as positive with sub-stantial potential for growth in some areas such as photonic energy system (i.e. photovoltaics). In general their environmental impact was less certain, with photonics technologies mostly offering greater effi-ciencies and more effective ways of working, but often creating greater demand (e.g. for displays) in the process. In general photonics is built into complex systems resulting in difficult end of life recycling. How-ever, both advanced lighting and photovoltaic technology offer the po-tential for major impact on energy consumption/generation, although future scenarios where subsidies or economic prosperity are reduced would significantly impact developments in these areas.
Social impacts are slightly more diverse with the scanning, imaging and sensing value chain having positive impacts on healthcare and security. Other value chains such as displays and communications have positive social impact by enabling more informed decisions, but there is the risk of social exclusion for those that are not able to access the latest tech-nology in these areas.
The ‘leverage’ of photonics was defined as the contribution photonics makes to the value of an end product, or service, either by enhancing the productivity of the manufacturing process, or by providing/enhanc-ing the functionality in the end device. A method was devised to quan-tify leverage, by combining the size of main markets impacted by phot-onics, with an assessment of how critical photonics was to those markets based on an expert survey. The results indicated that as an order of magnitude estimate photonics impacts around 10% of the European economy. This leverage is generated by a European photonics market worth €58.5billion (21% of the world market) and a European photon-ics industry employing 290,000 people.
Photonics leverage was seen in multiple markets as diverse as retail, medical and healthcare, manufacture of electronics and vehicles, trans-port, and telecommunications. The size and diversity of this impact and the large ratio (>50) between the total leveraged market and the phot-onics market illustrates how crucial photphot-onics technologies are to many very significant products and processes. Furthermore, the photonics market has consistently grown at ~10% in real terms - faster than in-dustry in general and therefore its influence is likely to further increase in the future. In particular, the study concludes that photonics leverage
will increase significantly in the areas of construction (based on photo-voltaic and lighting technologies), retail (based on displays and light-ing), transport (based on scanning, imaging and lighting) and medi-cal and healthcare (based on almost all photonics technologies). With Europe comprising over 20% of the global photonics market, having some 5,000 companies active in the field and well over 1,000 research organisations extending knowledge in the area, Europe has a consider-able photonics capability.
A number of future scenarios differing on the rate of economic growth and the role of government in the economy were used to provide further insights into the robustness and vulnerabilities of European photonics. The global nature of the photonics market, and the high concentration of active Small and Medium-sized Enterprises (SMEs) are seen to make European photonics both more adaptable to change, and more sensitive to international market fluctuations. The focus on the high end markets requires a strong research, design and development base to be maintained. Public investments in photonics research play a crucial role in this regard, and thus have a significant impact on Euro-pean competitiveness. In all future scenarios energy efficiency becomes an increasingly important parameter and one where photonics should have a significant role.
Overall it is concluded that the European photonics market is significant on a global scale and has very high leverage on other industries and markets. The future of photonics is bright, as leverage on most mar-kets and industries is set to increase in the coming decade with very substantial gains in some areas. However, the photonics industry is by no means homogeneous, technically or structurally, and its many varia-tions enhance products and processes in many different ways, requiring a heterogeneous policy approach. Photonics is still at the early stages of its development and thus its impact will continue to grow in new and unforeseen ways.
the study
1.1
Background to the study
Photonics can be seen as one of the major enabling technologies of the last decades, leading to new products and services with significant economic benefits. The huge diversity of products with photonic com-ponents demonstrates the positive impact to our economy of this per-vasive technology. However in the field of photonics production there is a strong competition with companies in the US and the Far East. Pho-tonics is a high-tech field, being at the forefront of R&D and innova-tion. For the future European policy on research and innovation in this area, more insight is needed into the actual impact of and the benefits generated by the photonics industry (leverage) for European industry at large, both to legitimize policy as well as helping setting priorities in the field.
To analyse this and provide information for future policies, this study was conducted for the European Commission‘s Directorate General for Information Society and Media to address these issues. The study results will contribute to the process regarding future orientation and struc-turing of European photonics research for the latter stages of FP7 and future FP8. It will give guidance for future investments in photonics re-search by providing qualitative and quantitative information about the leverage the photonics industry has on the industries that use photonics technologies (the ‘photonics enabled’ industries).
The study was carried out by a consortium of three partners. The main contractor was TNO, where both the methodological expertise in the field of photonics was provided, as well as technological knowledge of photonics. The Electronics Sensor and Photonics Knowledge Network (ESP KTN) provided access to the European Photonics network, as well as their in depth expertise in the field. Technologia was responsible for the quantitative economic data analysis, where the input of the Euro-pean photonics networks was also crucial.
1.2
Objectives of the study
The overall aim of the study was to investigate the leverage effect of photonics technologies on photonics-enabled applications, markets and related industrial value chains, particularly as applied to the European situation, to illustrate the degree to which this affects the development of new markets and to assess the potential socioeconomic and environ-mental impact of photonics technology take-up.
Another element of the study focused on the future. The major trends that could change the size and structure of photonics research and in-dustry were assessed, including the identification of major photonic technology trends.
This information on the future trends and related driving factors of change were integrated into four scenarios. These scenarios formed the basis for the analysis of emerging and new markets for photonics-enabled technologies, processes, applications and devices. Part of this was the assessment of the Strengths, Weaknesses, Opportunities and Threats (SWOT) of the various value chains of the photonics industry, as well as an assessment of the major social, environmental and economic impacts.
The specific objectives of the study were:
1. Overview of today‘s size and structure of the photonics market. 2. Survey of today‘s markets of photonics-enabled technologies,
proc-esses, applications and devices and the relative position of Europe in the value chain and key European market players.
3. Qualitative and quantitative analysis of major trends and drivers for the development of new markets for photonics-enabled technolo-gies, processes, applications and devices.
4. An analysis of emerging and new markets for photonics-enabled technologies, processes, applications and devices
5. Assessment of the potential socio-economic and environmental im-pact of photonics technology today and in the future.
1.3
Approach to the study
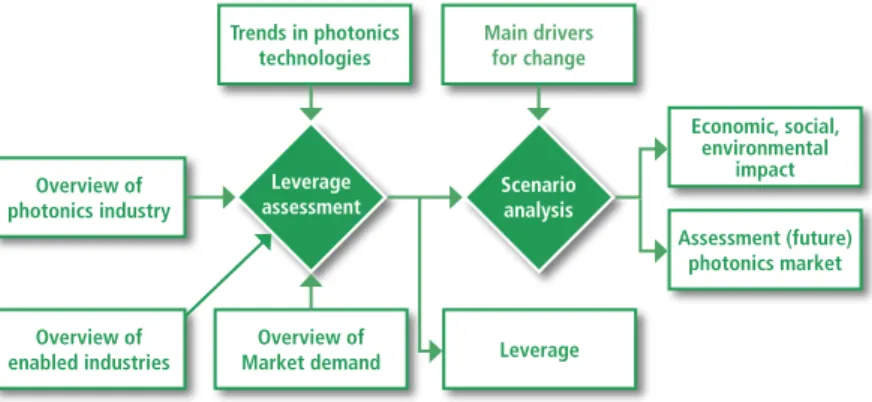
These different parts of the study were performed using different methods, but connected to each other. In the following overview the links are illustrated.
In the first stage of the study, the main aim was to assess the present situation. A quantitative industrial and market analysis was conducted, based on readily available information, using input from the European photonics networks. The assessment of leverage was based on a combi-nation of the quantitative industrial and market analysis with the out-comes of an expert survey on the leverage of photonic technologies on manufacturing and consumer markets. The results were evaluated by a group of experts during a workshop. The analysis of trends in photonic technologies was based on desk research. The final outcomes of the desk research and workshops were integrated in a detailed description of six photonics value chains, including SWOT analyses for each one. The Photonics21 database1 was used as an important source of information. The second stage of the work focused on future developments. The drivers of change to the photonics (enabled) industry were identified 1 See Section 2.1
Figure 1: Methodological overview of the project
Trends in photonics
technologies Main driversfor change
Overview of photonics industry
Overview of
enabled industries Market demandOverview of Leverage
Assessment (future) photonics market Economic, social, environmental impact Scenario analysis Leverage assessment
by desk research and individual expert interviews. Based on the driv-ers, four scenarios were developed in order to assess future trends and changing SWOTs. The results of the project were strategically analysed using a scenario analysis, including a second expert workshop. This pro-vided a future-oriented SWOT analysis.
To enable a more specific assessment of impact, a distinction is made within the analysis between six photonic technology clusters, based on technological and economic linkages:
1. Scanning, sensing and imaging systems
This cluster includes sensory devices for the measurement of physical properties and conversion to a signal that can be read by observers or other instruments. It deals with the capturing of 1, 2 and 3 dimensional images. Examples vary from small sensors for measuring temperature or distance, to infrared imaging for defence and security to large systems used for medical scanning and semiconductor production.
2. Information, communication and networks
At the core of this cluster are the many photonics technologies behind the high speed data transmission of data that form the backbone of the modern information/knowledge society. The Internet and modern global telecommunications have been revolutionized by fibre optics and associated photonics technology. This cluster includes both the fi-bre infrastructure, as well as the many photonics devices for routing, transmitting and receiving data. It also extends to storage devices such as DVDs and Blu-ray players and may in the future extend to optical computing.
The study distinguishes between six photonics technologies, which are also considered the core of the value chains in Europe: 1. Scanning, sensing and imaging
2. Information, communication and networks 3. Screens and displays
4. Advanced lighting 5. Photonic energy systems 6. Laser systems
3. Screens and displays
Displays are critical for the presentation and visualization of informa-tion both for leisure and business. The technologies behind 2 and 3 dimensional displays of all sizes are at the core of this cluster which focuses mainly on the flat screen displays, but also includes devices such as head mounted displays and projection displays. The applications are numerous, from use in mobile phones, television, computing, to large screen advertisement and professional entertainment.
4. Advanced lighting
The shift from traditional light bulbs to LED based solid state lighting is at the core of this cluster. Applications extend from basic domestic, retail and industrial lighting, to automotive and street lighting as well as advanced adaptive lighting, specialist lighting (e.g. surgical theatre lighting and photo-dynamic therapy). To focus on emerging develop-ments this cluster specifically excludes traditional incandescent lighting and fluorescent lighting and focuses on light sources based on organic and inorganic semiconductors i.e. OLEDs and LEDs.
5. Photonic energy systems
Photovoltaic technology has been available for niche electricity genera-tion applicagenera-tions for many years but in recent years interest in photo-voltaic technologies has exploded as it is now seen as a more widely applicable long term sustainable energy source. This cluster includes the technologies for the use of solar energy to produce electricity including the many new technologies in development. However additional pho-tonic energy technologies are also relevant such as laser driven fusion. Solar thermal systems e.g. applied to water heating, are excluded, since although they still relay on the interaction of solar light they have mini-mal dependence on photonics technology development.
6. Laser systems
Laser systems prove to be a core enabling technology for many appli-cations. Lasers vary widely from the very low power lasers used in bar code scanning to the very high power used in cutting and welding and this clusters includes all lasers types notable both diode and non-diode systems. Lasers are available in many formats with very different prop-erties dependent on a wide range of technologies making this cluster very heterogeneous. Applications are equally varied from systems for manufacturing (e.g. welding and marking), lasers for surgery, lasers in
defence (e.g. ranging and weaponry) and lasers used in scientific re-search and development.
To inform the assessment of leverage within the economic analysis a distinction is made between the following three entities:
1. the photonics industry itself, manufacturing photonics components and sub-systems, like lasers, LEDs, PV panels, screens and optical de-vices,
2. the ‘photonics enabled’ industries, which use those components and sub-systems both in their products and as part of their manufactur-ing processes. The automotive industry, the telecoms industry, the lighting industry and the medical equipment industry are all exam-ples of these enabled manufacturing industries.
3. The final end use or consumer markets where photonics based prod-ucts are used in transport, healthcare, retail, science and construc-tion for example.
An overview of the enabled manufacturing industries and final markets distinguished within the study is included in the following table.
Enabled manufacturing industries Final Markets
Manufacture of Electronics and Optical Equipment Medicine & Healthcare Activities Manufacture of Vehicles and Large Machinery Defence and Security Activities Manufacturing of Fine Chemicals and Pharmaceuticals Aviation and Space Infrastructure
Manufacturing of Textiles and Clothing Road & Rail Transport and Logistics Infrastructure Media Production and Broadcasting Telecommunications Infrastructure
Food and Beverage Production Science, Research & Development Printing & Publishing Activities Electricity Generation & Supply Oil and Gas Exploration Construction and Built Environment
Environmental Monitoring and Protection Recreation, Culture and Education Retail & Services
Table 1: Overview of the main enabled manufacturing industries and final markets in which photonics technologies are significantly relevant, based on the study results (see Annex B).
An overview of possible photonics based technologies and products for the enabled manufacturing industries and final markets can be found in the Annex A.
Within the study, three basic perspectives for the economic and technological assessment are distinguished:
1. The photonics industry, where manufacturing of photonic components is core.
2. Enabled manufacturing industries, where these components are used in the production process.
3. Final markets, in which the photonics-enabled products are used as end products.
industry
2.1
Introduction
The photonics industry has been assessed several times in recent years. Therefore this study did not include additional fieldwork, but rather un-dertook the systematic analysis and representation of the data that are already available in the various sources. An overview of those sources is provided in Annex E. Alongside these sources, information was also used from individual experts in the ESP KTN, TNO and several other Eu-ropean photonics networks.
The photonics industry is defined as those sectors that produce photonic technologies: photonic components and systems that are used in end user products, processes and services.
This chapter of the report is structured around the key conclusions that were drawn from our analysis of the data collected during the study.
Photonics21 as data source
The data used for the analysis of the various value chains are largely based on the Photonics21 database provided by the EU funded 'Phorce21' project. Phorce21 has been assessing the Photonics industry and research infrastructure for the last few years, within the framework of the Photonics21 European tech-nology platform. The partners involved in the Phorce21 project are: VDI Technologiezentrum GmbH (GER), OpticsValley (FR), Enterprise Ireland, IMEC (BE), EOS and TNO (NL). A vast amount of data is collected in the Dynamo database, hosted by TNO. It includes 774 European research organizations involved in phot-onics and 2609 European companies involved in photphot-onics.
2.2
The Photonics industry is
substantial and still in its early
industrial stage
The world market for civil photonics products in 2008 was worth
€256bn, the defence market adding an additional €21bn - leading to an
overall total of €277bn [Optech Consulting, April 2010]. The two largest
civil sectors were flat panel displays and information technology. They accounted for €71.8bn and €49.0bn respectively and together made up
nearly half the total market volume (44%). The remaining seven non-defence sectors accounted for between €15bn and €27bn each.
The total of €277bn can be put in perspective by comparing this with
other important industries. In total, the overall worldwide GDP is around
€60trillion (2008), where the EU GDP is around €12trillion (2008). The
overall production of defence related photonics in 2008 was around
€22bn, which can be compared to defence procurement of €44bn in
Europe and $154bn in the USA in 2009 (EDA2). Compared to
technol-2 European Defence Agency
8% 10% 24% 7% 18% 7% 6% 8% 6% 6% Defence photonics Solar energy
Flat panel displays
Lighting
Information technology
Medical tech. & life sciences
Optical communications
Measurement and automated vision
Production technology
Optical components & systems
Figure 2: World photonics production by sector (2008). Total: €277B, redrawn with modifications from [Optech Consulting, April 2010].
ogy focused sectors, the world pharmaceutical market, which is around
€500bn, is about twice as large as the total photonics market. The
con-clusion is that the photonics market is significant relative to other tech-nology sectors although it may appear more limited relative to major end markets such as food or automotive.
From 2005-2008, the global civil photonics market grew by 21.2% on a Euro basis, equivalent to a median annual growth rate of 6.6%. How-ever, photonics supply and demand is highly global, with some 30% share within the Euro zone, and with the appreciation of the Euro relative to other relevant currencies, it is useful also to measure the photonics world market in US dollar terms. On this basis, the global civil photonics market grew even by a total of 42%, or at a median annual growth rate of 12.4% between 2005 and 20083. Taking into account a core inflation rate of ap-prox. 2% for this period, this growth equates to a real annual growth rate of 10%. By comparison worldwide gross national income (GNI) growth was approximately 4.4% over the same period and the GDP increase of OECD countries on average was around 2.5%. Other sectors in general showed significantly less increase (Food: 2%; Automotive: 3-5%).Overall, the employment within the photonics industry is around 290,000 people. Although consistent updated information for the EU is not generally available, the world market as given in [Southern European Cluster in Photonics and Optics, 2010] can be compared for 2008 with the infor-mation from 2005 in [Optech Consulting, 2007] to extract some indica-tive trends. Most sectors have roughly the same proportion of world production in both years. The exceptions are information technology (down from 21% to 18%) and solar energy (markedly increased from 4% to 10%). It can be concluded that the major recent change to be expected in the composition of the EU photonics sector is the growth of solar energy, since information technology is not very significant as a proportion of EU production. This is consistent with [Optech Consult-ing, April 2010] , which found that in Germany, the solar PV sector rep-resented 23% of production (the largest proportion of any sector) in 2008 having grown at an annual rate of 45.5%, compared to 6.8% for the other sectors. While a complete and consistent data set for all major EU producers is not available, based on all the available indicators, the
3 Differences between the annual growth in euros and dollars are due to the disproportionate
best estimate of the size of EU photonics production in 2008 is €58.5bn.
The evaluation workshop and recent growth figures of e.g. ASML indi-cate that production and markets in 2010 are back to their 2008 growth path, following the impact of the credit crunch. This is confirmed by recent market analysis on laser markets and other markets [Anderson, 2010; Solarbuzz, 2010].
Whilst the overall size of the photonics industry is not vast relative to other industries, the growth rate of the photonics industry is strong com-pared to industry in general. Growth is far above average and new mar-kets are constantly emerging. The conclusion can therefore be drawn that the sector shows characteristics of an industry still in its early phases of evolution. As discussed in Chapter 4, the impact of photonics on other industrial sectors is strong, e.g. on automotive, building & construction, science and consumer electronics. New photonics-enabled products and connected services are expected to emerge and their enabling character-istics will have strong impacts on industrial activities. Two clear examples are the enabling characteristics of the flat screen displays and the ever growing use of photonics enabled high speed internet. This not only offers the potential for economic growth, but the potential impact of photonics on the rest of the industry and society requires attention to ensure optimal usage of its changing impulse. Based on its high econom-ic growth and leverage to the rest of the industry (see chapter 4), it can be said that photonics is a key enabling technology of the ICT Kondratiev wave now fully emerging. Support of research and development is also crucial for an industry that is still in its development stage.
Kondratiev waves of economic growth
In the 1920-ties, the economist Nikolai Kondratiev discovered the existence of 60 year long waves of macro economic growth [Kondratiev, 1984]. Based on important enabling technologies, historically the economy shows expansions that lead to
restructuring of our economy. Examples are the steam engine in the 18th century, electrical and chemical engineering, as well as petrochemicals in the 19th century. Today, we experience the long wave based on ICT, which is believed to have started in the 1970s.
2.3
Strengths of the EU photonics
industry
Although recent (2009-2010) consistent information about the EU photonics industry is not readily found, within the study the differ-ent Photonics Networks were consulted and additional national infor-mation has been provided. Also the Photonics21 database provided valuable insights in the economic structure of the European photonics industry.
Within the EU around 5,000 companies are presently active in the field of photonics technologies and a raw estimate of research is that some 1,000-2,000 organisational units work in the field of photonics (insti-tutes, labs, university groups).
The photonics industry is highly globalized industry with an estimated production level of €277bn (2008). The sector shows
a rapid overall growth and even further increases can be expected for the coming decade. But within the sector, strong differences can be seen and its character is heterogeneous. The EU is a significant player in this field, with an annual produc-tion of about €58bn (2008), which is about 20-25% of the total
global production. However, the heterogeneous character also applies for Europe, as it is world leader in certain fields and only has a marginal position in others.
The Leverage Effect of Photonics Technologies: the European Perspective
Looking at the Photonics21 database, the strongest industrial partici-pation can be seen in Germany and the relative number of large com-panies in Germany is significantly higher than in the other countries. UK, France, Italy and the Netherlands are also important for photonics activities with a significant number of large companies (>10). What is important to see is that many of the other EU countries also show a representation by photonics companies. The conclusion is that although most of the activities are based in a small number of countries, also other EU countries show a critical mass.
Some highlights from the updates from individual national photonics networks have also been collected during the study. Germany’s phot-onics production reached a volume of €23.1bn in 2008, with an export
rate of 65%. Over the period 2005-2008, output rose by 41.4%, at an average annual rate of well over 10%. Following these positive trends in revenues, 27,000 new jobs were created in the sector across Germany between 2005 and 2008. The employment growth rate was 8.8% in the same time period, nearly as strong as real production growth in the sector (10.2% p.a.). A 2009 survey by the UK ESP KTN indicated that the value of the UK Photonics market had grown to €7 billion and
indica-tions showed the sector attaining strong growth again in 2010. The out-put of the Spanish photonics industry was worth an estimated ~ €1.5bn
in 2008, not including the photovoltaic sector, whose output alone was worth €16.3bn in 2008. An average compound annual sector growth of
18% was reported between 2000 and 2006, according to a study car-ried out by the trade association SECPhO. Production value of the Swiss Figure 3: Overview of the company distribution mapped in the Photonics21 database
(total 2,600 companies). 0 100 200 300 400 500 600 700 Germany UK FranceItaly
NetherlandsSwedenSwitzerlandBelgium Spain
DenmarkAustriaFinland Czech Rep.
IrelandPolandGreeceNorwayIsraelPortugalLithuaniaTurkeyBulgariaHungary LuxembourgRomaniaSlovakia
CyprusEstonia the growth rate of the photonics industry is strong compared to industry in general. Growth is far above average and new markets are constantly emerging. The conclusion can therefore be drawn that the sector shows characteristics of an industry still in its early phases of evolution. As discussed in Chapter 4, the impact of photonics on other industrial sectors is strong, e.g. on automotive, building & construction, science and consumer electronics. New photonics-enabled products and connected services are expected to emerge and their enabling characteristics will have strong impacts on industrial activities. Two clear examples are the enabling characteristics of the flat screen displays and the ever growing use of photonics enabled high speed internet. This not only offers the potential for economic growth, but the potential impact of photonics on the rest of the industry and society requires attention to ensure optimal usage of its changing impulse. Based on its high economic growth and leverage to the rest of the industry (see chapter 4), it can be said that photonics is a key enabling technology of the ICT Kondratiev wave now fully emerging. Support of research and development is also crucial for an industry that is still in its development stage.
2.3 Strengths of the EU photonics industry
Although recent (2009-2010) consistent information about the EU photonics industry is not readily found, within the study the different Photonics Networks were consulted and additional national information has been provided. Also the Photonics21 database provided valuable insights in the economic structure of the European photonics industry.
Within the EU around 5,000 companies are presently active in the field of photonics technologies and a raw estimate of research is that some 1,000-2,000 organisational units work in the field of photonics (institutes, labs, university groups).
0 100 200 300 400 500 600 700 Ger man y UK Fran ce Italy Net herla nds Swed en Switzerland BelgiumS pain Den mar k Aus tria Finl and Czech Rep.Ireland Pol and Gre ece Nor wayIsrael Por tuga l Lith uani a Turk ey Bul garia Hun gary Luxe mbo urg Rom ania Slo vaki a Cyp rus Est onia
Figure 0: Overview of the company distribution mapped in the Photonics21 database (total 2,600 companies).
The photonics industry is highly globalized industry with an estimated production level of 277bn (2008). The sector shows a rapid overall growth and even further increases
can be expected for the coming decade. But within the sector, strong differences can be seen and its character is heterogeneous. The EU is a significant player in this field, with an annual production of about 58bn (2008), which is about 20-25% of the total global production. However, the heterogeneous character also applies for Europe, as it is world leader in certain fields and only has a marginal position in others.
The Leverage Effect of Photonics Technologies: the European Perspective
photonics sector in 2008 was 2.97bn Swiss Francs (CHF), a 4 % reduction compared to 2007. The biggest decline in production was in the laser material processing sector (which fell CHF150 million). Measurement technology & image processing also suffered – together these sub-sec-tors made up over 65% of Swiss production. The estimated production volume of the photonics industry in Sweden in 2007 was €2.5bn. A 2007
survey found that Sweden has the second highest number of photonics companies/per capita in Europe.
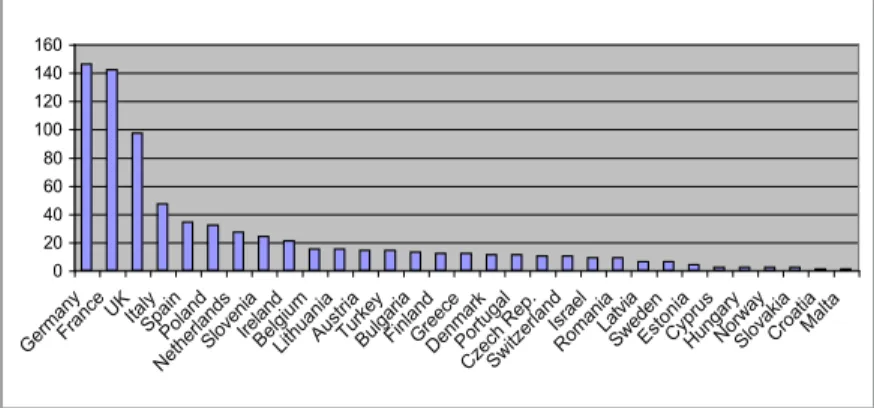
The strengths of the EU research community are slightly different as illustrated in the following figure. Although the same strong countries can be seen, Poland is also an important country for photonics research.
As in production, photonics research activities are present in almost all countries leading to the conclusion that there is a broad critical mass for photonics research across Europe. Additionally the 1000-2000 research institutes, labs and, university groups active in photonics are distributed among ~ 400 universities and large research & technology organisations present across Europe [EARTO4]. The relatively large average of ~5 un-derlying departments working in photonics per organisation reinforces the broad ranging influence of photonics across multiple disciplines
es-4 EARTO: is the trade association of Europe’s specialised research and technology organisations.
EARTO represents RTOs with a total staff of some 150,000 scientists, engineers and technicians and an annual turnover of €15 billion.
Figure 4: Distribution of the research activities mapped in the Photonics21 database to the coun-tries (total: 774 mapped).
0 20 40 60 80 100 120 140 160 GermanyFrance UKItalySpain Poland NetherlandsSlovenia IrelandBelgium
LithuaniaAustriaTurkeyBulgariaFinlandGreeceDenmarkPortugal Czech Rep.Switzerland
Israel
RomaniaLatviaSwedenEstoniaCyprusHungaryNorwaySlovakiaCroatiaMalta
in Germany and the relative number of large companies in Germany is significantly higher than in the other countries. UK, France, Italy and the Netherlands are also important for photonics activities with a significant number of large companies (>10). What is important to see is that many of the other EU countries also show a
representation by photonics companies. The conclusion is that although most of the activities are based in a small number of countries, also other EU countries show a critical mass.
Some highlights from the updates from individual national photonics networks have also been collected during the study. Germany’s photonics production reached a volume of 23.1bn in 2008, with an export rate of 65%. Over the period 2005-2008, output rose by 41.4%, at an average annual rate of well over 10%. Following these positive trends in revenues, 27,000 new jobs were created in the sector across Germany between 2005 and 2008. The employment growth rate was 8.8% in the same time period, nearly as strong as real production growth in the sector (10.2% p.a.). A 2009 survey by the UK ESP KTN indicated that the value of the UK Photonics market had grown to 7 billion and indications showed the sector attaining strong growth again in 2010. The output of the Spanish photonics industry was worth an estimated ~ 1.5bn in 2008, not including the photovoltaic sector, whose output alone was worth 16.3bn in 2008. An average compound annual sector growth of 18% was reported between 2000 and 2006, according to a study carried out by the trade association SECPhO. Production value of the Swiss photonics sector in 2008 was 2.97bn Swiss Francs (CHF), a 4 % reduction compared to 2007. The biggest decline in production was in the laser material processing sector (which fell CHF150 million). Measurement technology & image processing also suffered – together these sub-sectors made up over 65% of Swiss production. The estimated production volume of the photonics industry in Sweden in 2007 was 2.5bn. A 2007 survey found that Sweden has the second highest number of photonics companies/per capita in Europe.
The strengths of the EU research community are slightly different as illustrated in the following figure. Although the same strong countries can be seen, Poland is also an important country for photonics research.
0 20 40 60 80 100 120 140 160 Ger man y France UKIta ly Spa in Polan d Net herla nds Slo veni a Irela nd BelgiumLithua nia Aus tria Turk ey Bul garia Finl and Gre ece Den mar k Por tuga l Czech Rep. Switzerland Isra el Rom aniaLatvia Swed en Est onia Cyp rus Hun gary Nor way Slo vaki a Cro atia Mal ta
Figure 1: Distribution of the research activities mapped in the Photonics21 database to the countries (total: 774 mapped).
pecially at the research level. The conclusion can be drawn that phot-onics research is well represented within the European research com-munity.
The following research areas are highly represented within the EU:
● Laser technology
● Thin film
● Photonics related design research
● Nanophotonics
2.4
Implications for EU policy
2.4.1 A heterogeneous industrial sector, demanding heterogeneous policies
The photonics industry includes various subsectors, from energy oriented products, to imaging, medical and information technologies (Figure 5). The various subsectors are often based on different technologies, and not all subsectors grew at the same rate between 2005-2008.
The European photonics research and industry is represented
in most of the EU27 countries, but most of the research and industrial activities take place in Germany, France and the UK (over 50%). Overall, it is estimated that around 5,000 companies
are involved in photonics related industrial activities, employing about 290,000 people. Some 1,000-2,000 research organisations
are estimated to be present in Europe. The photonics industry includes a relative high proportion of SMEs, but also a signifi-cant number of multinational companies have their main office in Europe.
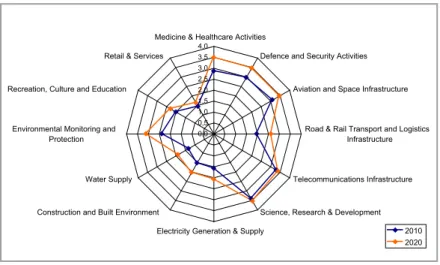
As has previously been said, the overall growth rate of the photonics sector was around 10% in the period 2005-2008. However, some subsec-tors have shown more growth than others. The largest subsector is flat panel displays (over $100bn in 2008), which also shows a strong growth (almost 30%). But perhaps the most important relative growth can be seen in energy, where growth was over 250%. This finds its origin in the further political attention to the energy challenge, but is combined with the improvement in technological efficiency and cost reduction. However, it can be expected that growth may be slowed in an envi-ronment where governmental funding for renewable energy may be under pressure as part of measures to reduce overall state spending and associated debt. However there are also several other subsectors of importance that show a highly dynamic future trend. Information and communication technologies can expect further growth, as the demand for high speed data communication continues to increase exponentially. Solid state lighting will also see substantial growth as LED lighting be-comes cost effective and offers higher efficiency than traditional light-ing with equivalent or improved user experiences. It can also be expect-ed that the market for mexpect-edical technologies will become increasingly important because of the pressure on the healthcare system demanding more efficient and effective healthcare. Also photonics enabled produc-tion technologies can be expected to grow, as a consequence of their impact for improving the efficiency of many manufacturing processes (e.g. production of chips, and materials processing).
Figure 5: Overview of the world civil photonics market sectors on a US$ basis in 2005 and 2008, adapted from [Optech Consulting, April 2010].
Optical Components and Systems Energy Technology Flat Panel Displays Lighting Technology Information Technology Communication Technology Medical Technology and Life Sciece Image Processing and Measurement Technology Production Technology
0 20 40 60 80 100 120
Mrd. US-$ 2008 2005
An analysis of the impact of the ’credit crunch’ shows that although the impact on the overall photonics industry was limited, situations vary along the different subsectors, with some sectors, such as materials processing, hit harder than others such as medical and biophotonics. An example is given by [Optech Consulting, 2009] , which indicates that the German photonics production and markets in 2010 should be back to their 2008 levels – thus we would broadly expect the future pattern of growth to revert close to the trends forecast in 2005. [Southern Europe-an Cluster in Photonics Europe-and Optics, May 2010] Europe-and [Optech Consulting, 2009] track aggregate revenues of leading publicly quoted laser and photonics firms. [Optech Consulting, 2009] shows that these fell from Q2 to Q3 2008 slightly, then markedly in each of the next two quar-ters, finally stabilising in Q2 2009 before starting to grow again. Sales were down 26% in 2009, with materials processing down 35%. Laser revenues worldwide fell to 2003 levels in 2009. Further evidence comes from the underlying semiconductor base. [Southern European Cluster in Photonics and Optics, 2010] shows a ‘devastating’ decline from 2008 to 2009 in EU optoelectronic component revenues – a 25% drop with all product types suffering. The same estimate for world revenues shows an 8% decline, with displays (up 31%), LEDs (12%) and ‘other’ (9%) showing positive growth globally but not in the EU.
Although various elements of the photonics industry are linked to eco-nomic cycles, the conclusion to be drawn from this overview is that the photonics industry is a highly dynamic and heterogeneous industry and a supportive policy on the subsectors should not be homogenous. Sup-porting existing subsectors and related networks should be looked at with intelligence, as new and upcoming markets could be more inter-esting. Within the support, this dynamic nature should be addressed by allowing significant changes in participation, activities and focal themes, including a forward looking component. Continuous anticipa-tion on future developments is crucial.
2.4.2 Focus on the winners, but do not neglect new markets
The EU is not strong in every subsector of the photonics industry. It is com-monly accepted that, in general, the EU position in large volume consum-er products is weak. Howevconsum-er, more tailor made high end and high tech products and manufacturing systems are strong in Europe. As innovation and new product developments are an important aspect of the photonics industry, research is crucial to optimally benefit from the opportunities
of photonics in an economical way. However, there are barriers to entry, as the workshops conducted within the scope of this study showed that the connection between universities and business is crucial for the future position of companies. Research needs full public and private support in order to keep the innovative capacity strong enough. But to support all possible research fields would limit its effectiveness. Support of weak are-as of research should be limited and strong research communities should be further strengthened, but with future developments in mind.
However, the dynamic character of the industry and stage of evolution also leads to the conclusion that policy should support small and upcom-ing areas of research and innovation. As described before, the photon-ics industry is highly characterized by new and emerging (sub) markets. These new markets will have some connections to existing strengths in research, but need support to grow out of infancy. As the photonics industry has strong presentation of SMEs5, adjacent policy needs to be developed that supports SMEs to connect to research and develop new innovations in new markets (more radical innovations).
5 Within the Photonics21 database some 2,600 companies are collected. Over 90% is SMEs, and
less than 10% have over 500 employees. It is estimated that some 200,000 people work in the SMEs within the EU photonics industry.
Looking at the assessment of the photonics industry in Europe, two policy implications can be drawn:
1. The photonics industry is highly heterogeneous, including several subsectors with fundamentally different characteris-tics. A general policy will be suboptimal and a thematic policy is needed.
2. The industry shows many growth markets with critical mass, but also several new emerging markets can be identified. So next to a policy of “backing the winners”, also support is needed for newcomers and for innovative SMEs.
2.5
Conclusions for the assessment
of the photonics industry
The assessment of the photonics industry shows that it is a significant industry, about half the size of the pharmaceutical industry. The esti-mated world production is €277bn (2008), of which Europe contributes
about €58bn (2008). This is about 20-25% of the total global production
and it can be said that the EU is a significant world player. However, al-though Europe is considered a world leader in certain fields it only has a marginal position in others. It can be concluded that the photonics industry is significant for Europe, but not in all fields (see chapter 3 for more information).
In the last decade, the photonics industry has shown a growth rate that is significantly higher than average and it can be said that the industry is still in its early phase of economic life (this is supported by the lever-age assessment). Although the credit crunch has had a large impact on the industry, already in 2010 the growth paths have shown it to be back to the level before the credit crunch. Even further increases can be ex-pected for the coming decade, but within the sector, strong differences can be seen and its character is heterogeneous.
The European photonics research and industry is broadly addressed by most of the 27 EU countries. However, over 50% of research and indus-trial activities take place in Germany, France and the UK. Some other countries like Spain, the Netherlands. Poland, Sweden and Italy are also considered substantial players in the field of photonics, but focal areas of the individual countries vary significantly. Overall, it is estimated that around 5,000 companies are involved in photonics related industrial ac-tivities, employing about 290,000 people and some 1,000-2,000 research organisations are present in Europe. The photonics industry includes a relative high proportion of SMEs, but also a significant number of mul-tinational companies have their main office in Europe.
The assessment of the photonics industry in Europe, lead to some policy implications:
1. As the photonics industry is highly heterogeneous, the policy to support the industry needs to address this. The existence of having several subsectors with fundamentally different market, innovation and research dynamics, asks for a thematic approach.
2. The industry shows many growth markets where already a critical mass exists. Networks are present (industrial and research), as well as a sound economic position in global markets. But the industry also shows a dynamic emergence of new economic activities in new markets. So next to a policy of “backing the winners”, also support is to be provided to newcomers and to innovative SMEs enabling them to create critical mass for both research and industrial activities.
value chains
3.1
Introduction
The previous chapter assessed the European photonics industry at large and did not draw conclusions on specific clusters/networks within the Europe. As one of the objectives of the study is to create a better insight into the research and industrial base in Europe, a further systematic breaking up of the photonics related research and industrial activities is needed. The concept of value chains is used.
In the value chain approach, the main element is the assessment of the added value that different activities contribute to the full production chain. The value chain can be seen as ‘economic clusters’, wherein eco-nomic activities are connected and add value through ecoeco-nomic links (including also research). In the value chain, specific activities are identi-fied that can be analyzed on the basis of their added value.
Looking at the photonics industry, technology is an important linkage through the value chain. The photonics technology areas are set in the centre of the identified chains and therefore this view focuses on the key questions on the nature of the life cycle of specific photonics-based technologies:
1. Scanning, sensing & imaging
2. Information, communication & networks 3. Screens & displays
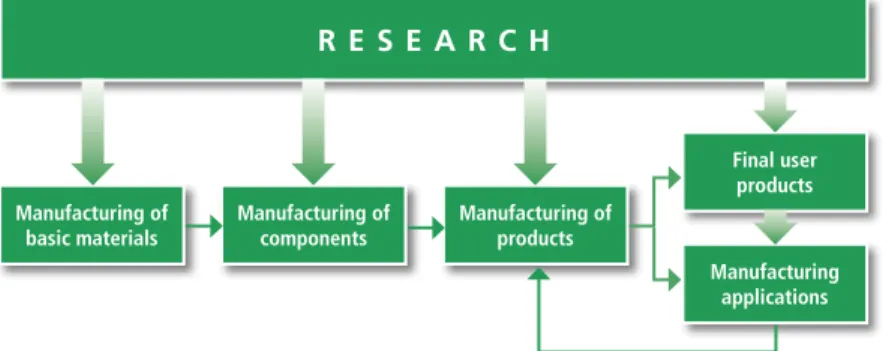
Figure 6: Methodological framework for the value chain analysis of the photonics and photonics enabled industry.
Manufacturing of
basic materials Manufacturing ofcomponents Manufacturing ofproducts
Final user products
R E S E A R C h
Manufacturing applications
4. Advanced lighting 5. Photonic energy systems 6. Laser systems
In this chapter, the following sections will discuss each value chain:
● After a short introduction, the emphasis will be given to the main characteristics of the various elements of the value chain, focusing on the European position.
● The second part of the analysis will use the Leverage survey results and provide a more detailed analysis of the present and future per-spective of both enabled manufacturing industries and final markets on their dependency to photonics for their competitiveness.
● The third element of the assessment focuses on the Strengths, Weak-nesses, Opportunities and Threats of the European economy in re-gard to the value chain.
● An assessment of the economic, environmental and social impacts of the products and services core to the value chain.
The chapter will finish with a short overview of the main conclusions.
3.2
Scanning, sensing and imaging
3.2.1 Introduction
Scanning and sensory devices are used in several application areas, usu-ally to measure physical quantities and convert them to signals that can be read by observers and/or other instruments. They deal with the capturing of 1, 2 and 3 dimensional images and the processing of in-formation. Examples vary from small sensors for temperature, chemical composition, to large systems that are used for medical scanning, litho-graphic production systems and astronomy.
Within manufacturing, scanning and sensing are often crucial elements to the production process especially in quality control, marking and positioning. Examples are the imaging systems for robotized manufac-turing and scanning systems for detection of production errors. These systems are used both in high tech manufacturing industries such as microelectronics production and increasingly in traditionally lower tech-nology areas such as food production. The use in final markets is diverse. Within Medical & healthcare activities scanning & imaging is a critical component of diagnostics in locating diseased areas. Within Defence & security, remote threat identification is just one of the examples of the use of these devices and systems. Within Transport many imaging de-vices are used with the infrastructure to e.g. enhance safety with speed and traffic monitoring cameras as well as automatic toll and congesting charging. Sensing devices are also increasingly deployed in cars to moni-tor the surrounding environment to increase safety and comfort. Also the use of sensors in Science has become crucial to conducting research, especially to make the invisible visible (e.g. microscopy and astronomy) and to assess material and process characteristics. Last, but not least, scanning and sensing is increasingly important in ICT based consumer devices such as camera’s, mobile phones and home automation. 3.2.2 The European value chain
Research in this value chain includes research on the further miniaturi-zation of sensors, higher quality, broadening the spectral response, as well as on signal processing and imaging. The European research infra-structure in this field is diverse. Based on the Photonics21 database, it can be concluded that this area is overall highly addressed in Europe, with over 50% of all organisations conduct research in some area of Scanning, sensing and imaging. Optical measurement, adaptive optics, biophotonics, spectroscopy, microscopy, astronomy and (parts of) imag-ing are well represented in Europe. The geographic distribution from Photonics21 indicates that countries that are generally highly active in Figure 7: Functionalities in scanning and imaging.
Optical emission
Image capture
Mechatronical system adjustment
photonics research show high participation in this field; the database shows also representation by numerous other EU countries.
The second key element in the sensing and imaging value chain is the manufacturing of basic materials. This area is of limited specificity to this particular area as the basic materials used are the common mate-rials for the production of electronics and sensors, although there is increased use of non-silicon semiconductor materials such as GaAs and III-V semiconductors.
The production of basic components mainly includes the actual produc-tion of sensors, light sources, as well as imaging software. Europe is underrepresented in this field, especially in high volume camera com-ponents, as most of the production is low cost and positioned in e.g. Asia. However, for some very high performance components Europe shows a significant position, especially those used in defence & security, astronomy and healthcare. General imaging design is considered a Eu-ropean strength and Europe has a significant position in the emerging high growth area of advanced image processing (e.g. augmented real-ity, automate camera monitoring).
The production of photonics based equipment used in manufacturing includes e.g. the measurement & testing, support for automation (e.g. imaging for robotics) and the use of other sensors in manufacturing. Europe is generally strong in the production of sensing and imaging equipment as it is generally in the use of photonics in manufacturing tools. An example is the production of photonics based testing meas-urement equipment, in which about 20% of the companies in the Phot-onics21 database are active. A particular strength is the use of scanning and sensors in the production of high capital cost low volume produc-tion systems (e.g. wafer steppers, robotized slaughtering).
Scanning, sensing and imaging is used in several final markets, of which Medical & healthcare activities and Defence & Security are perhaps the most prominent. But also Transport and Science are important. In the application area of Science, Europe can be considered a highly signifi-cant player making vital photonics based tools for scientific research in all disciplines, but especially relevant to Physics and the life sciences. The industry is mostly served by SMEs, although there is an important number of large multinationals. Europe also has a strong overall
pres-ence in the production of systems for Medical & Healthcare equipment using photonics. Europe (especially Germany but also the UK and the Netherlands) is particularly strong in the area of advanced microscopy and other emerging tools used in medical and life science research as well as increasingly being utilised in healthcare. In Defence & Security, infrared imaging is a major application, along with security monitoring cameras. Especially in Defence & Security companies are usually large multinationals, although some SMEs are involved. Biometrics and sur-veillance cameras are considered of high importance and have strong European representation. Also in safety Europe is a significant player, overlapping with the application area Transport where Europe also has a significant presence especially in traffic monitoring and congestion charging systems. The last application areas are Consumer products. In this area European presence is limited and this market is mostly domi-nated by Asian companies, although the design rather than the produc-tion of low cost CMOS cameras is regarded to be an EU strength. Looking at the connections between the different elements of the value chain, in general the connections are limited. For several high volume components especially imaging chips, production is based in Asia although some specialised high performance production is based in Europe. The high volume products are essentially commodities usu-ally purchased on cost and then integrated in systems. However, the linkages between research and manufacturing are relatively strong and essential. Particularly with specialised systems, the pipeline of research and manufacturing is crucial for survival of a business. But the actual situation highly depends on the concrete product groups, where less complex systems have limited linkages.
3.2.3 Present versus future
Main technology development activities in the imaging field are aimed at the realization of imaging devices with improved performance, e.g. spatial resolution, sensitivity, dynamic range, speed, compactness; ex-tended wavelength response (UV, infrared, terahertz region); develop-ment of technology for 3d imaging and hyperspectral imaging, and development of advanced data processing and analysis techniques. De-velopments also include combinations of optical and acoustic imaging. Further on, miniaturization of camera systems is an important technol-ogy driver. Overall developments in this are focused on increasing the information content of images i.e. more pixels and more data per pixel and the automated processing of images. Along with rapid cost reduc-tion, driven by some consumer applications, the impact of imaging tech-nology is continuing to grow. Many photonics technologies based on imaging and sensing systems have also been developed with continued development in sensitivity and selectivity.
Scanning, sensing and imaging
The following conclusions can be drawn from this assessment:
● EU research in this area is diverse and well represented. Sev-eral areas are broadly covered and of world class
● Europe in general is underrepresented as manufacturer of components in this chain, although on certain components it is strong (e.g. lenses, low cost CMOS)
● The application of scanning/sensing/imaging in manufactur-ing industries is significant in Europe, with even some excep-tional world players.
● Especially the non consumer markets, like healthcare, de-fence and science are important final markets for European industries, although some activities are of importance, like design of products.
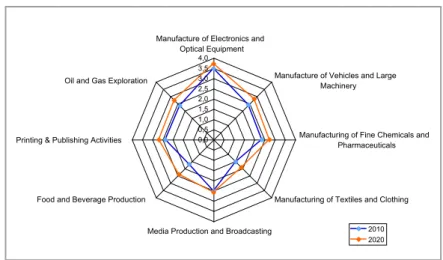
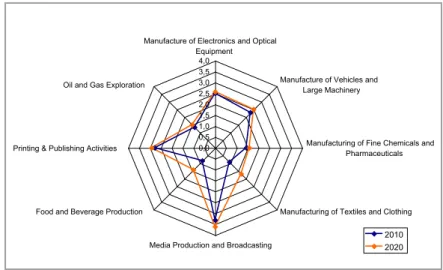
The results of the survey show that the importance of scanning and imaging for manufacturing industries is of high importance and it is expected to increase in the coming decade. It is clear that the highest dependency can be seen in the manufacturing of electronics and opti-cal equipment. As its importance is already high in 2010, the increase is limited. Another interesting assessment is that although the use of scanning and imaging in Food and beverage is currently limited, it is expected to significantly increase in the coming decade. Expected devel-opments in automation and quality control/verification in this industry using photonics technologies can explain this outcome. This is also the case in textiles and clothing, although the impact will be less.
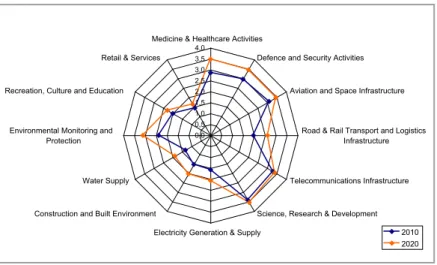
The survey shows that looking at final markets, scanning and imaging will also increase in the coming decade.
Figure 8: Overview of added value to competitiveness of scanning and imaging devices to ena-bled manufacturing industries based on Photonics survey.
Scanners, Imaging Devices and Analysis Equipment 0,0 0,5 1,0 1,5 2,0 2,5 3,0 3,5 4,0
Manufacture of Electronics and Optical Equipment
Manufacture of Vehicles and Large Machinery
Manufacturing of Fine Chemicals and Pharmaceuticals
Manufacturing of Textiles and Clothing Media Production and Broadcasting
Food and Beverage Production Printing & Publishing Activities
Oil and Gas Exploration
2010 2020
In most of the markets, scanning and imaging technologies are crucial to their further development. In some, dependencies are limited, for ex-ample, retail, water supply, construction and energy generation. How-ever, based on the analysis presented in previous chapters, even there the importance of photonics is significant. Future developments in the coming decade show a slight potential growth.
Scanning, sensing and imaging
The assessment of present versus future for this value chain shows:
● In all enabled manufacturing industries and final markets an increase in importance of this value chain is to be expected.
● Application of the technologies in enabled manufacturing industries is crucial for certain industries and significantly ap-plicable in most other industries.
● Application in final markets shows even more dominance in a selected number of markets, with even higher dependencies.
● Some final markets, now of less importance, show a sig-nificant increase in importance in the coming decade, like construction, water supply and environmental protection.
Figure 9: Overview of added value to competitiveness of scanning and imaging technologies to final markets based on Photonics survey.
Scanners, Imaging Devices and Analysis Equipment (Survey Score Indicating Importance)
0,0 0,5 1,0 1,5 2,0 2,5 3,0 3,5 4,0
Medicine & Healthcare Activities
Defence and Security Activities Aviation and Space Infrastructure
Road & Rail Transport and Logistics Infrastructure
Telecommunications Infrastructure Science, Research & Development Electricity Generation & Supply
Construction and Built Environment Water Supply Environmental Monitoring and
Protection Recreation, Culture and Education
Retail & Services
2010 2020
3.2.4 Strengths, Weaknesses, Opportunities, Threats
In the present situation, the following conclusions can be drawn on what the present European strengths are:
■ Research and development in Europe is strong in this area, especially optical measurement, adaptive optics, biophotonics, spectroscopy, microscopy, astronomy and (parts of) imaging are well represented in Europe.
■ The connection between research and industry in several subsectors is closely connected, allowing research based innovation.
■ The production of photonics enabled manufacturing systems is in Europe well represented, especially in the field of “low volume, high cost” tailor made production systems.
■ For some high value submarkets Europe is leading including e.g. medical diagnostics systems (especially biophotonics based), design of low cost CMOS cameras, light microscopes, biometrics and surveil-lance cameras, safety systems, scanning systems for science.
■ Europe shows strong capacities in system integration, where differ-ent compondiffer-ents are integrated into new complex products. The European weaknesses identified are the following:
■ In general, Europe is not the world leader in the production for final markets, especially in consumer areas.
■ Consumer oriented production is almost not present in Europe and therefore is not an important market.
■ The European imaging components manufacturing industry in gen-eral is not strong, but there are some markets where Europe is a global player, like (advanced) imaging, lenses and some high per-formance components.
The opportunities for the European industry, created by external trends and factors mainly based on the assessment that the contribution of the area to the grand societal challenges identified by both the European Commission as well as several national governments are:
■ The pressure on the healthcare system, in combination with age-ing lead to a further demand for efficient (cost reduction) and ef-fective (high quality) healthcare. Scanning, sensing & imaging can facilitate both, and a significant increase in the market demand is to

![Figure 5: Overview of the world civil photonics market sectors on a US$ basis in 2005 and 2008, adapted from [Optech Consulting, April 2010].](https://thumb-us.123doks.com/thumbv2/123dok_us/1912574.2780593/28.629.124.568.126.320/figure-overview-photonics-market-sectors-adapted-optech-consulting.webp)