BSA Lakes District
Health Board Coverage
Report
Citation: Ministry of Health. 2015. BSA Lakes District Health Board Coverage Report: period ending 30 June 2015. Wellington: Ministry of Health.
Published in August 2015 by the Ministry of Health
PO Box 5013, Wellington 6145, New Zealand ISSN 2422-9407 (online)
Contents
Introduction ... 1
Technical notes ... 2
Lakes DHB coverage ... 3
Lakes coverage by ethnicity in the two years ending 30 June 2015 ... 3
Lakes coverage trends by ethnicity ... 4
DHB coverage comparisons ... 5
DHB coverage by ethnicity in the two years ending 30 June 2015 ... 5
DHB coverage by ethnicity ... 8
List of tables Table 1: BSA coverage (%) in the two years ending 30 June 2015 by ethnicity, women aged 50–69 years, Lakes District Health Board* ... 3
Table 2: BSA number of screens in women aged 50–69 years by ethnicity and quarter, Quarter 2 2014–Quarter 2 2015, Lakes District Health Board ... 4
Table 3: BSA number of screens and coverage (%) of women aged 50–69 years in the two years ending 30 June 2015 by District Health Board ... 7
Table 4: BSA coverage (%) of women aged 50–69 years in the two years ending 30 June 2013, 2014 and 2015*, by ethnicity and District Health Board ... 8
List of figures Figure 1: BSA coverage (%) in the two years ending 30 June 2015 by ethnicity, women aged 50–69 years, Lakes District Health Board ... 3
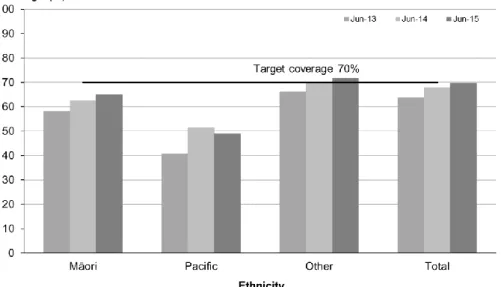
Figure 2: BSA coverage (%) of women aged 50–69 years in the two years ending 30 June 2013, 30 June 2014 and 30 June 2015* by ethnicity, Lakes District Health Board ... 4
Figure 3: BSA coverage (%) of Māori women aged 50–69 years in the two years ending 30 June 2015 by District Health Board ... 5
Figure 4: BSA coverage (%) of Pacific women aged 50–69 years in the two years ending 30 June 2015 by District Health Board ... 5
Figure 5: Overall BSA coverage (%) of women aged 50–69 years in the two years ending 30 June 2015 by District Health Board ... 6
Introduction
BreastScreen Aotearoa (BSA) is a national public health screening programme funded by the Government to offer free Mammography every two years to women aged 45–69 years of age. The aim of BSA is to reduce morbidity and mortality from breast cancer by the early detection and treatment of the disease.
BSA’s target is to screen 70 percent of eligible women aged 50–69 every two years. BSA does not have a target for women aged 45–49 years because there is less evidence of the benefits of this age group’s participation in a population health breast screening
programme.
Improving uptake of the breast cancer screening programme by Māori and Pacific women is a key priority of the National Screening Unit (NSU) as part of its commitment to
achieving equity. Coverage rates are monitored closely for these two groups.
While the majority (15) of District Health Boards (DHBs) are not directly contracted by the Ministry of Health to provide breast screening services, it is expected that all DHBs will have linkages to breast screening activities. The programme is delivered throughout the country by eight lead providers, their sub-contracted providers (where applicable), and mobile units that deliver services to rural and some urban communities. Working alongside the lead providers are 13 independent service providers in defined geographical areas providing recruitment and retention, and support services for Māori and Pacific women.
The purpose of this quarterly report is to demonstrate by DHB if the programme coverage targets are being met for the region.
Technical notes
The number of women screened for the two-year periods ending 30 June 2013, 30 June 2014 and 30 June 2015 were extracted from the national Breast Screen Aotearoa
database (the Database) on 29 July 2015.
Screened women are included in the coverage calculations based on their age at the time of their screen. This means that coverage for women aged 50–69 years includes women who may have turned 70 or 71 during the monitoring period.
For both women screened and in the denominator, women have been prioritised to a single ethnicity using the following priority order: Māori, Pacific, Other. This means that if a woman chooses more than one category, and one of these is Māori, she is counted as Māori. For screened women with no ethnicity recorded in the Database, her screen contributes to overall coverage but not to any particular ethnicity. This means that the total number of women screened may be greater than the sum of women screened by ethnicity.
The denominators used for calculating coverage for the period ended 30 June 2015 are derived from Statistics New Zealand’s District Health Board (DHB) population
projections 2014 update, based on the 2013 Census. For the periods ended 30 June 2013 and 30 June 2014, the 2014 update of the 2001 to 2013 DHB population estimates based on the 2013 Census was used.
The denominator is the projected population for the mid-point of the monitoring period. This means that for the two-year period ending:
30 June 2013, the denominator is the population estimate for 30 June 2012
30 June 2014, the denominator is the population estimate for 30 June 2013
30 June 2015, the denominator is the projected population for 30 June 2014 Delivery of BSA services through mobile units may also result in fluctuations in the number of women screened in a quarter which may impact on coverage from year to year depending on the mobile unit schedule.
Additional detail on the methodology can be obtained via a request made to screening@moh.govt.nz.
Lakes DHB coverage
Lakes coverage by ethnicity in the two years ending 30 June 2015
Figure 1: BSA coverage (%) in the two years ending 30 June 2015 by ethnicity, women aged 50–69 years, Lakes District Health BoardTable 1: BSA coverage (%) in the two years ending 30 June 2015 by ethnicity, women aged 50–69 years, Lakes District Health Board*
Ethnicity Population Women screened in last 2 years
2-year coverage Additional screens to reach 70% target
Māori 3,180 2,070 65.1% 156 Pacific 200 98 49.0% 42 Other 9,660 6,921 71.6%
Total* 13,040 9,102 69.8% 26
*For the total population the number of additional screens is the number required to move from the total population coverage to 70%. This may not be the same as the sum of additional screens required for each ethnic group to reach 70%.
Lakes coverage trends by ethnicity
Figure 2: BSA coverage (%) of women aged 50–69 years in the two years ending 30 June 2013, 30 June 2014 and 30 June 2015* by ethnicity, Lakes District Health Board
* June 2013 and June 2014 coverage is calculated using the 2014 update of the 2001 to 2013 DHB population estimates based on the 2013 Census, whereas the June 2015 uses the 30 June 2014 update of the 2013 census based population projections
Table 2: BSA number of screens in women aged 50–69 years by ethnicity and quarter, Quarter 2 2014–Quarter 2 2015, Lakes District Health Board
Ethnicity Number of screens by quarter Q2 (Apr-Jun) 2014 Q3 (Jul-Sep) 2014 Q4 (Oct-Dec) 2014 Q1 (Jan-Mar) 2015 Q2 (Apr - Jun) 2015 Māori 274 298 257 257 300 Pacific 20 17 8 10 14 Other 983 1,203 890 709 860 Total 1,277 1,518 1,155 976 1,174
DHB coverage comparisons
DHB coverage by ethnicity in the two years ending 30 June 2015
Figure 3: BSA coverage (%) of Māori women aged 50–69 years in the two years ending 30 June 2015 by District Health BoardFigure 4: BSA coverage (%) of Pacific women aged 50–69 years in the two years ending 30 June 2015 by District Health Board
Figure 5: Overall BSA coverage (%) of women aged 50–69 years in the two years ending 30 June 2015 by District Health Board
Table 3: BSA number of screens and coverage (%) of women aged 50–69 years in the two years ending 30 June 2015 by District Health Board
DHB name Eligible population Screens Coverage
Māori Pacific Other Total Māori Pacific Other N/A* Total Māori Pacific Other Total Northland 5,400 240 17,790 23,430 3,583 168 13,088 6 16,845 66.4% 70.0% 73.6% 71.9% Waitemata 4,220 3,190 58,440 65,850 2,482 2,453 39,953 11 44,899 58.8% 76.9% 68.4% 68.2% Auckland 3,290 4,430 41,500 49,220 2,054 3,299 27,189 2 32,544 62.4% 74.5% 65.5% 66.1% Counties Manukau 5,990 7,930 40,100 54,020 3,953 6,136 27,569 4 37,662 66.0% 77.4% 68.8% 69.7% Waikato 6,930 720 38,490 46,140 4,012 435 26,992 45 31,484 57.9% 60.4% 70.1% 68.2% Lakes 3,180 200 9,660 13,040 2,070 98 6,921 13 9,102 65.1% 49.0% 71.6% 69.8% Bay of Plenty 4,850 210 24,030 29,090 2,877 148 17,291 16 20,332 59.3% 70.5% 72.0% 69.9% Tairawhiti 2,170 85 3,465 5,720 1,466 42 2,531 4,039 67.6% 49.4% 73.0% 70.6% Taranaki 1,580 75 12,950 14,605 961 49 9,740 3 10,753 60.8% 65.3% 75.2% 73.6% Hawke's Bay 3,400 360 17,640 21,400 2,266 244 13,327 26 15,863 66.6% 67.8% 75.5% 74.1% Whanganui 1,430 90 6,790 8,310 985 72 5,303 6 6,366 68.9% 80.0% 78.1% 76.6% MidCentral 2,470 320 18,510 21,300 1,530 221 14,344 11 16,106 61.9% 69.1% 77.5% 75.6% Hutt Valley 1,870 910 14,380 17,160 1,238 598 10,456 14 12,306 66.2% 65.7% 72.7% 71.7% Capital & Coast 2,460 1,860 28,710 33,030 1,573 1,190 20,424 39 23,226 63.9% 64.0% 71.1% 70.3% Wairarapa 610 55 5,525 6,190 401 43 4,017 2 4,463 65.7% 78.2% 72.7% 72.1% Nelson Marlborough 1,200 120 19,780 21,100 881 72 15,273 7 16,233 73.4% 60.0% 77.2% 76.9% West Coast 350 25 4,215 4,590 265 8 3,189 3,462 75.7% 32.0% 75.7% 75.4% Canterbury 2,990 780 59,440 63,210 2,217 509 47,220 31 49,977 74.1% 65.3% 79.4% 79.1% South Canterbury 360 30 7,890 8,280 265 16 6,267 6,548 73.6% 53.3% 79.4% 79.1% Southern 2,040 270 36,380 38,690 1,264 170 26,874 33 28,341 62.0% 63.0% 73.9% 73.3% Unspecified 60 National 56,790 21,900 465,685 544,435 36,436 15,985 338,643 271 391,335 64.2% 73.0% 72.7% 71.9%
DHB coverage by ethnicity
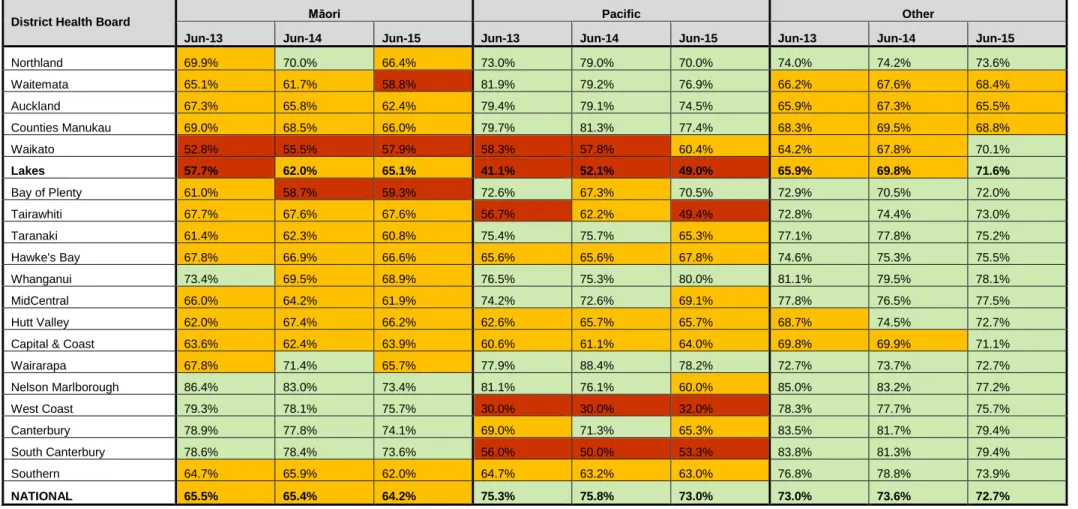
Table 4: BSA coverage (%) of women aged 50–69 years in the two years ending 30 June 2013, 2014 and 2015*, by ethnicity and District Health Board
District Health Board Māori Pacific Other
Jun-13 Jun-14 Jun-15 Jun-13 Jun-14 Jun-15 Jun-13 Jun-14 Jun-15
Northland 69.9% 70.0% 66.4% 73.0% 79.0% 70.0% 74.0% 74.2% 73.6% Waitemata 65.1% 61.7% 58.8% 81.9% 79.2% 76.9% 66.2% 67.6% 68.4% Auckland 67.3% 65.8% 62.4% 79.4% 79.1% 74.5% 65.9% 67.3% 65.5% Counties Manukau 69.0% 68.5% 66.0% 79.7% 81.3% 77.4% 68.3% 69.5% 68.8% Waikato 52.8% 55.5% 57.9% 58.3% 57.8% 60.4% 64.2% 67.8% 70.1% Lakes 57.7% 62.0% 65.1% 41.1% 52.1% 49.0% 65.9% 69.8% 71.6% Bay of Plenty 61.0% 58.7% 59.3% 72.6% 67.3% 70.5% 72.9% 70.5% 72.0% Tairawhiti 67.7% 67.6% 67.6% 56.7% 62.2% 49.4% 72.8% 74.4% 73.0% Taranaki 61.4% 62.3% 60.8% 75.4% 75.7% 65.3% 77.1% 77.8% 75.2% Hawke's Bay 67.8% 66.9% 66.6% 65.6% 65.6% 67.8% 74.6% 75.3% 75.5% Whanganui 73.4% 69.5% 68.9% 76.5% 75.3% 80.0% 81.1% 79.5% 78.1% MidCentral 66.0% 64.2% 61.9% 74.2% 72.6% 69.1% 77.8% 76.5% 77.5% Hutt Valley 62.0% 67.4% 66.2% 62.6% 65.7% 65.7% 68.7% 74.5% 72.7%
Capital & Coast 63.6% 62.4% 63.9% 60.6% 61.1% 64.0% 69.8% 69.9% 71.1%
Wairarapa 67.8% 71.4% 65.7% 77.9% 88.4% 78.2% 72.7% 73.7% 72.7% Nelson Marlborough 86.4% 83.0% 73.4% 81.1% 76.1% 60.0% 85.0% 83.2% 77.2% West Coast 79.3% 78.1% 75.7% 30.0% 30.0% 32.0% 78.3% 77.7% 75.7% Canterbury 78.9% 77.8% 74.1% 69.0% 71.3% 65.3% 83.5% 81.7% 79.4% South Canterbury 78.6% 78.4% 73.6% 56.0% 50.0% 53.3% 83.8% 81.3% 79.4% Southern 64.7% 65.9% 62.0% 64.7% 63.2% 63.0% 76.8% 78.8% 73.9% NATIONAL 65.5% 65.4% 64.2% 75.3% 75.8% 73.0% 73.0% 73.6% 72.7%