of Open Source Projects Hosted on SourceForge
Dawid Weiss
http://www.cs.put.poznan.pl/dweiss
Institute of Computing Science, Poznań University of Technology, Poland
Technical report number:
RA-001/05
Abstract
The subject of this work is to demonstrate how some very interesting statistics of
open source projects hosted on SourceForge can be retrieved effortlessly and at low-cost.
This crawled information later constitutes an ideal input for quantitative analysis of the
open source movement in general. We present the full process of our experiment from
crawling the data to performing the analysis.
This work was started when no such information existed in literature. While
per-forming the crawl, we found out about another project of similar nature, OssMole [2].
We provide the results of this experiment nonetheless because the two projects use
different strategies for crawling data. Using OssMole’s data also lets us make some
interesting cross-comparisons and derive conclusions about temporal changes going on
at SourceForge.
This report includes supplementary data in electronic format, available for download at: http://www.cs.put.poznan.pl/dweiss/site/publications/resources/tr-01-2005.zip
BibTEX entry:
@techreport{ lcosf2005, author="Dawid Weiss",
title="A Large Crawl and Quantitative Analysis of Open Source Projects Hosted on SourceForge", institution="Institute of Computing Science, Pozna{\’n} University of Technology, Poland", type="Research Report RA-001/05"
year="2005" }
Contents
1 Introduction and motivation for the work
4
2 The procedure used to crawl SourceForge data
5
2.1
Acquiring a list of Unix names for all projects . . . .
6
2.2
Fetching home pages of known projects . . . .
7
2.3
Data mining of raw pages, constructing the database . . . .
8
2.3.1
Database scheme . . . .
8
2.3.2
Data extraction . . . .
8
3 Cross-comparison of results with OssMole
10
3.1
OssMole file:
sfSummaryDeveloperData12-Nov-2004.txt
. . . .
10
3.1.1
Total number of developers . . . .
10
3.1.2
Summary of positions of developers in a project . . . .
10
3.1.3
Number of developers for each project. . . .
10
3.2
OssMole file:
sfSummaryIntAudData21-Oct-2004.txt
. . . .
11
3.2.1
Intended audience for projects . . . .
11
3.3
OssMole file:
sfSummaryLicenseData21-Oct-2004.txt
. . . .
11
3.3.1
Usage of licenses . . . .
11
3.4
OssMole file:
sfSummaryOpSysData21-Oct-2004.txt
. . . .
12
3.4.1
Target operating systems . . . .
12
3.5
OssMole file:
sfSummaryProgLangData21-Oct-2004.txt
. . . .
12
3.5.1
Language of implementation
. . . .
12
3.6
OssMole file:
sfSummaryStatusData21-Oct-2004.txt
. . . .
12
3.6.1
Declared development status . . . .
12
3.7
OssMole file:
sfSummaryRegistrationData21-Oct-2004.txt
. . . .
13
3.7.1
Registration history . . . .
13
3.8
OssMole file:
sfSummaryTopicData21-Oct-2004.txt
. . . .
13
3.8.1
Declared topic . . . .
13
3.9
Summary of the comparison . . . .
14
4 Complete results of analyses performed on the crawled data
16
4.1
Project activity . . . .
17
4.1.1
Number of projects with SourceForge activity factor
>
0
. . . .
17
4.1.2
Distribution of SourceForge activity factors . . . .
18
4.1.3
Topmost projects according to SourceForge activity factor . . . .
19
4.1.4
Number of invalid and inaccessible projects . . . .
20
4.1.5
Development status declared by projects . . . .
21
4.1.6
Number of projects with at least one bug . . . .
22
4.1.7
Distribution of the number of bugs in projects . . . .
23
4.1.8
Projects with highest numbers of submitted bugs . . . .
24
4.1.9
Distribution of the number of feature requests in projects . . . .
25
4.1.10 Projects with highest numbers of submitted feature requests . . . .
27
4.1.11 Distribution of the number of code patches in projects . . . .
28
4.1.12 Projects with highest numbers of submitted code patches . . . .
30
4.2
Developers . . . .
31
4.2.1
Average number of developers per project . . . .
31
4.2.2
Distribution of the number of developers in projects . . . .
32
4.3
History of project registrations . . . .
34
4.4
Self-declared project properties . . . .
35
4.4.1
Number of language translations per project . . . .
35
4.4.2
Most translated projects . . . .
36
4.4.3
Most popular languages . . . .
37
4.4.4
Most popular programming languages . . . .
38
4.4.5
Most popular open source licenses . . . .
39
4.4.6
Target operating systems . . . .
41
4.4.7
Target application user interfaces . . . .
43
4.4.8
Intended audience groups . . . .
44
4.4.9
Project topics . . . .
45
1
Introduction and motivation for the work
It is seldom the case that so little is known about the sources of success of so many. The
open source movement has gained an incredible momentum and still many questions
con-cerning its internal workings remain unclear. Why is open source development attractive for
programmers? What kind of factors make an open source project successful? How can a
programming model be so far from modern commercial software engineering standards and
yet spawn stable, commercial-quality software?
Luckily, researchers start to investigate the above questions and more and more is known
about the mechanics and processes ruling the open source world. In this work we would
like to contribute certain quantitative analyses of open source projects and, most of all, the
process we used to collect them. Under the term ‘quantitative’ we understand applying
certain statistics and counting properties of hundreds or thousands of open source projects.
We acquire (
crawl
) the data needed for such analyses from the largest open-source hosting
facility—SourceForge.
1This work shows how this process can be done and presents certain
selected results acquired from our experiment. An additional outcome of this research report
is to provide a ready-to-use SQL database for custom analyses and flexible methodology of
crawling data from SourceForge at low cost. This database and all associated data is available
for free download at:
http://www.cs.put.poznan.pl/dweiss/site/publications/resources/tr-01-2005.zip
.
* * *
Halfway into the work on our experiment (actually, well into the crawling phase), we found out
about a similar initiative—the OssMole project [2]. We decided to continue our experiment
because of a few significant differences between the two projects:
•
OssMole uses a crawler utility written in Perl. We use a very simple combination of
Linux shell scripts and a small Python program. Which approach is better is of course
hard to determine but certainly the two have pros and cons—we find our solution perfect
for rapid prototyping and flexible enough to follow potential SourceForge modifications.
On the other hand, a more structured solution, such as OssMole’s could be employed to
spawn an agent-like service that would provide constant feed of up-to-date data instead
of one-time batch processes.
•
OssMole only presents certain aggregated data without exposing the full SQL database.
We provide our source database for custom querying and experiments.
•
We also found out that a cross-comparison of aggegated data from OssMole and our
experiment yields some interesting results because the two crawls were separated by a
couple of months (ours is more recent) and this lets us observe certain changes over
time. According to our knowledge, such analysis was not previously available.
2
The procedure used to crawl SourceForge data
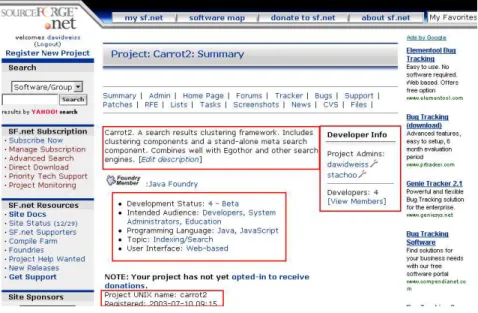
The primary observation that led us to the concept of crawling SourceForge data
automat-ically was that all home pages of projects hosted there have a very similar and predictable
structure (see Fig. 1), suggesting an underlying database of some sort. The structure and
Figure 1: Home pages of projects hosted at SourceForge demonstrate a very predictable layout of content structure (here depicted with red rectangles).
availability of data in that database was for obvious reasons unknown, but by manual
analy-sis of several dozen pages we collected the following features that appeared on most of the
pages and could be automatically retrieved from tha raw page’s source:
Registration date.
For all projects, there is a registration date on SourceForge services.
Activity percentile.
A measure of a project’s ‘activity’ as calculated by SourceForge.
Total number of developers in a project.
Note that this is the total number of
so-called
committers
(people with write-access to the repository). The number of
com-mitters heavily depends on the internal project policy of assigning such rights to people
and is hard to compare between projects.
Unix name of the project.
Name of the folder on SourceForge hosts (also indicates project
names found in the URLs).
Summary of the project.
More verbose information about the project (if defined by the
admin).
Project tracker information.
Trackers for: bugs, support requests, feature requests and
patches. Total and open counts are available for projects that declared to use such
facilities.
Trove classification data.
Trove
2classification system is based on self-declaration of
pro-ject maintainers about features and properties of the propro-ject. These include:
•
database environment,
•
development status,
•
intended audience,
•
license,
•
programming language,
2http://sourceforge.net/softwaremap•
deployment operating system,
•
topic,
•
translations of the project, its documentation,
•
user interface.
Project maintainers may locate the project in Trove’s categories by assigning it to any
of the values predefined by SourceForge. A project may opt not to use this classification
system. Usually more than one value from each category may be also assigned to a
project (i.e. more than one language of translation or a target operating system).
The next thing we observed was that the URLs
3of home pages also follow a predictable
pattern of:
http://sourceforge.net/projects/
|
{z
}
Base addresscarrot2
| {z }
Unix project name
(1)
We designed a process to fetch home pages of all projects hosted at SourceForge in order
to extract the interesting information to a relational database for further analysis. The
remaining part of this section presents this process in details. Time-consuming steps have
been marked with a clock icon on the margin, similar to the one shown to the right of this
text.
2.1
Acquiring a list of Unix names for all projects
Step 1:
Luckily, the author of this paper is an administrator of one of the projects hosted at
SourceForge and this gives access to the filesystem of SourceForge servers. To assemble
a list of Unix names for all projects we use the following shell command:
1 nice ls /home/groups/*/* >projects.listOnce the list of projects completes, you can check its size with:
1 ls -l projects.list
and the result in our case was:
1 -rw-r--r-- 1 dawidweiss users 819949 Dec 20 01:28 projects.list
Step 2:
We now get rid of the extra lines
ls
command put in the output:
1 /home/groups/a/a0: 2 3 /home/groups/a/a1: 4 a1kbms 5 6 /home/groups/a/a2: 7 a213nudh299 8 a213nudh29b
The following command does the job of filtering project paths:
1 egrep -v "(^/home)|(^$)" projects.list >projects.alpha
You can immediately check how many projects there are in the list:
1 wc -l projects.alpha
and in our case the result was:
1 89557 projects.alpha
3URL (Uniform Request Locator) is a unique identifier of a resource in the internet. Web site address is
2.2
Fetching home pages of known projects
Step 3:
We want to download all home pages for projects listed in
projects.alpha
for
further analysis. We will do this as a batch process using
wget
utility.
Please consider the impact that crawling over 80 thousand pages will have on
SourceForge’s Web servers. In fact, SF has ways to monitor and temporarily
block IP addresses that generate overwhelming traffic, so you will have to adjust
your scripts to stretch the crawling process over time.
In our experiment we split the entire crawl into
chunks
of 5000 projects. For each
chunk a Bash batch script was generated using AWK that fetched one page every 15
seconds:
1 awk -f split.awk <projects.alpha
where
split.awk
is a very simple and not-all-too-pretty AWK program:
1 BEGIN {
2 splitsize = 5000;
3 current = 0;
4 chunk = 0;
5 filename = "chunks/" "chunk." chunk ".sh"; 6 system("mkdir chunks");
7
8 printf("mkdir chunk.content.%s\n", chunk) >> filename;
9 }
10
11 {
12 printf("wget -t0 -t30 -s -O chunk.content.%s/%s.html "
13 "-nv http://sourceforge.net/projects/%s\n", chunk, $0, $0) >> filename; 14 printf("echo current: %s\n", current) >>filename;
15 printf("sleep 15;\n") >> filename; 16 current = current + 1;
17 if (current > splitsize) {
18 chunk++;
19 current = 0;
20 filename = "chunks/" "chunk." chunk ".sh"; 21
22 printf("mkdir chunk.content.%s\n", chunk) >> filename; 23 print "Printing: " filename >"/dev/stderr";
24 }
25 }
If performed from a single machine, the crawl would have taken over 15 days. To
shorten the time a bit we divided chunks to be fetched into four separate machines.
Still, the crawl took a good couple of days to complete.
You should be aware of several projects whose names have special meaning under
Windows-based systems (i.e.
aux
project will hang your scripts).
Once the crawling is finished, copy all created chunk directories to some common
folder.
4In our experiment, the crawled folders have the following sizes:
1 bash-2.05b$ du --max-depth 1 -h 2 187M ./chunk.content.00 3 190M ./chunk.content.01 4 191M ./chunk.content.02 5 189M ./chunk.content.03 6 187M ./chunk.content.04 7 187M ./chunk.content.05 8 187M ./chunk.content.06 9 187M ./chunk.content.07 10 187M ./chunk.content.08 11 186M ./chunk.content.09 12 188M ./chunk.content.10 13 187M ./chunk.content.11 14 184M ./chunk.content.12
15 187M ./chunk.content.13 16 187M ./chunk.content.14 17 187M ./chunk.content.15 18 184M ./chunk.content.16 19 167M ./chunk.content.17 20 3.3G .
Step 4:
Some of the crawled pages may be corrupted, usually due to network problems, or
outages at SourceForge (which do happen). You can easily detect these situations by
finding files smaller than 20 kilobytes. Copy these files into another directory (so that
we know their names) and re-fetch them manually using:
1 for a in ‘ls *.html‘; do
2 TMP=‘echo $a | sed s/.html$//‘; 3 echo $TMP;
4 wget -s -O $TMP.html.new -nv http://sourceforge.net/projects/$TMP; 5 done;
Step 5:
Again make sure if home pages for all projecs have been retrieved correctly:
1 find chunks -name "*.html" -print | wc -l 2 89557
The number returned by the above script should match:
1 wc -l <projects.alpha 2 89557
Let us also check if all retrieved files are correct. A correct file is more than 20 kilobytes:
1 find chunks -name "*.html" -size -20k -print | wc -l 2 0
This is just what we expected, the data is ready for mining.
Step 6:
As a final step, compress chunks for archival purposes:
1 tar -jcf chunks.bz2 chunks
The resulting file
chunks.bz2
is 94 megabytes, compared to the original 3.3 gigabytes
of raw data it is a pretty good compression ratio.
2.3
Data mining of raw pages, constructing the database
2.3.1
Database scheme
Step 7:
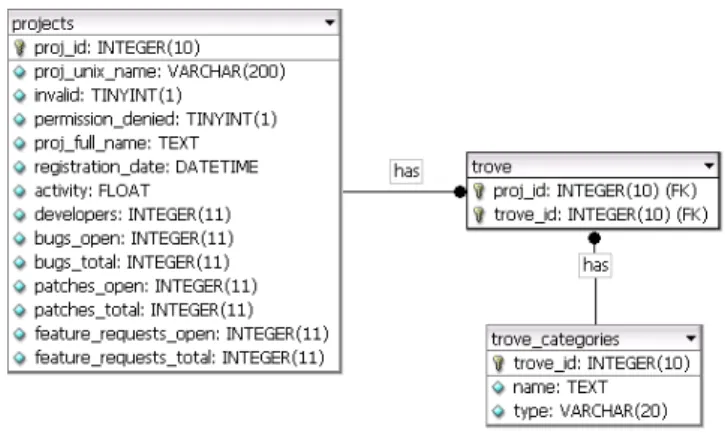
Raw home pages are inconvenient and inefficient for processing, so we extract the
interesting data and insert it into a relational database. The proposed database’s
schema is quite simple and is shown in Fig. 2. There is one table to hold all of
project-related information (
projects
) and one table to store predefined values of categories
found in the Trove system (
trove_categories
). Since there is a many-to-many
rela-tionship between
projects
and
trove_categories
, this relationship is split and forms
an additional table
trove
.
We chose to use MySQL as the database engine because of its free availability and
popu-larity. A script that creates the database can be found with the rest of the experiment’s
files. We create the database and its schema with:
1 mysql -h localhost -u root -e "create database sf_projects;" 2 mysql -h localhost -u root sf_projects < db.mysql/db.sql
2.3.2
Data extraction
Step 8:
We now extract the information from raw pages into intermediate textual SQL
scripts using a basic program written in Python and consisting mostly of regular
ex-pressions.
We choose to make intermediate SQL scripts instead of direct database connections
because it is simpler (and in fact, faster) compared to inserting data row by row at the
time of extraction.
Figure 2:Database schema for storing information extracted from SourceForge. trovetable is a normalization of many-to-many relationship.
1 python src/python/ScanFiles.py chunks
where
chunks
is a folder with subfolders containing raw crawled data.
Step 9:
When finished, there should be three SQL files present in the current directory:
general-project-info.sql
,
trove_categories.sql
and
trove.sql
.
We import
their SQL content into the database:
1 mysql -h localhost -u root sf_projects < general-project-info.sql 2 mysql -h localhost -u root sf_projects < trove_categories.sql 3 mysql -h localhost -u root sf_projects < trove.sql
In case you get errors indicating too large SQL files (ERROR 2006), increase
the packet size in your
my.ini
file using:
max_allowed_packet = 32M
Step 10:
Try the database and make sure all projects have been imported:
1 $ mysql -h localhost -u root -e "select count(*) from projects;" sf_projects 2 +---+
3 | count(*) | 4 +---+ 5 | 89557 | 6 +---+
Step 11:
A couple additional indices, or optimizations of table keys can be optionally
3
Cross-comparison of results with OssMole
Driven by curiosity, we decided to compare results from the OssMole project with our freshly
created database. Our results were a couple months more recent, so certain trends and
differences should be visible.
3.1
OssMole file:
sfSummaryDeveloperData12-Nov-2004.txt
3.1.1
Total number of developers
We lack this kind of information in our database, so there is no possibility to compare to
OssMole (OssMole has precise information about each developer because they crawl other
resources besides the home page).
3.1.2
Summary of positions of developers in a project
Again, no possibility of extracting this information using our database. We are only concerned
with projects, not developers.
3.1.3
Number of developers for each project.
We have found out the following:
•
Projects with no access (invalid or with permission denied) are omitted in OSSMole’s
results. We include all projects, even if information about them is unavailable.
•
Our list has 4744 new projects compared to OssMole’s. This is also confirmed by charts
of projects registration per month (see Section 3.7.1).
•
1187 projects gained developers, on average by
1
.
51
developer per project. Random
entries from the difference file:
1 perl-oak : 9 --> 10 2 ezybiz : 2 --> 3 3 mlnet : 1 --> 2 4 iscsi-mgmt-api : 11 --> 12 5 advanced-ado : 6 --> 8 6 darkphorums : 1 --> 2 7 icemail : 1 --> 2 8 funkboard : 1 --> 2 9 xmlbeansplug : 1 --> 3 10 koriandol : 2 --> 3 11 phpmq : 2 --> 3 12 turquaz : 4 --> 5 13 ...
•
397 projects
lost
developers, on average by
1
.
80
developer per project (which is more
than the developer gain mentioned above). Random entries from the difference file:
1 phpcollab : 9 --> 4 2 cpufreqd : 2 --> 1 3 gpu : 29 --> 28 4 jarapac : 2 --> 1 5 dacs : 3 --> 2 6 pythius : 3 --> 2 7 dgp : 2 --> 1 8 libaviation : 11 --> 10 9 xito : 3 --> 2 10 clexusmud : 5 --> 4 11 plat : 5 --> 4 12 lleu : 4 --> 1
Interestingly, 15 projects went completely inactive (or should we say have been
aban-doned by the captain) dropping to zero developers:
1 b4market : 1 --> 0 2 transit : 2 --> 0 3 loginsvlt : 1 --> 0 4 schizophrenic : 1 --> 0
5 ipkillunix : 1 --> 0 6 bsdsfv : 1 --> 0 7 singularity-sys : 2 --> 0 8 jfacedbc : 1 --> 0 9 axv : 1 --> 0 10 ojdbm : 1 --> 0 11 idris : 1 --> 0 12 zbos : 1 --> 0 13 exmmpkg : 1 --> 0 14 median : 1 --> 0 15 ipfwgen : 1 --> 0
•
Even more interesting, however, was the fact that several projects were
not present at
all
in our results. Since our database of projects contained all entries in the filesystem,
it either implies that those projects have been physically removed in the meantime
(against SourceForge’s policy?), or a network file system was disconnected at the time
we crawled project names (not likely because missing project names range throughout
the alphabet). A total of 93 projects have been removed in the period of 2 months
(fragment):
1 anarcs 2 asali 3 ascension 4 ask 5 bhcms 6 bloodlust 7 bombaman 8 budik 9 capandhold 10 ...3.2
OssMole file:
sfSummaryIntAudData21-Oct-2004.txt
3.2.1
Intended audience for projects
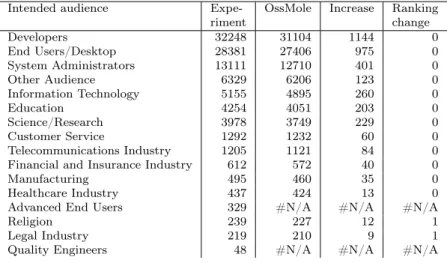
Comparison of intended audience charts yields an interesting thing: apparently new
cate-gories have been added to Trove (see Tab. 1). Apart from that, a steady increase of project
counts among all categories can be observed.
Intended audience Expe- OssMole Increase Ranking
riment change Developers 32248 31104 1144 0 End Users/Desktop 28381 27406 975 0 System Administrators 13111 12710 401 0 Other Audience 6329 6206 123 0 Information Technology 5155 4895 260 0 Education 4254 4051 203 0 Science/Research 3978 3749 229 0 Customer Service 1292 1232 60 0 Telecommunications Industry 1205 1121 84 0
Financial and Insurance Industry 612 572 40 0
Manufacturing 495 460 35 0
Healthcare Industry 437 424 13 0
Advanced End Users 329 #N/A #N/A #N/A
Religion 239 227 12 1
Legal Industry 219 210 9 1
Quality Engineers 48 #N/A #N/A #N/A
Table 1: Intended audience for projects in OssMole and our experiment. Note the missing categories in OssMole
3.3
OssMole file:
sfSummaryLicenseData21-Oct-2004.txt
3.3.1
Usage of licenses
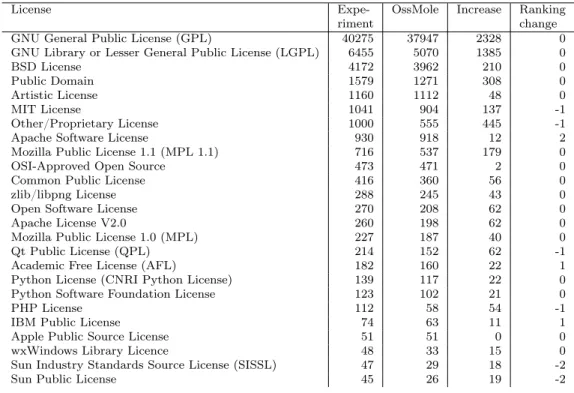
As it is shown in Tab. 2, the use of open source licenses is quite stable, especially among
the topmost licenses. Why GNU-family licensing is so popular is an interesting question
and certainly needs more investigation. Is it GNUs idealistic concept of forever-free software
people are attracted to? Or maybe it is a
consequence
of these idealistic concepts—a set of
‘contagious’ legal terms and obligations people have little choice but to obey?
License Expe- OssMole Increase Ranking
riment change
GNU General Public License (GPL) 40275 37947 2328 0
GNU Library or Lesser General Public License (LGPL) 6455 5070 1385 0
BSD License 4172 3962 210 0
Public Domain 1579 1271 308 0
Artistic License 1160 1112 48 0
MIT License 1041 904 137 -1
Other/Proprietary License 1000 555 445 -1
Apache Software License 930 918 12 2
Mozilla Public License 1.1 (MPL 1.1) 716 537 179 0
OSI-Approved Open Source 473 471 2 0
Common Public License 416 360 56 0
zlib/libpng License 288 245 43 0
Open Software License 270 208 62 0
Apache License V2.0 260 198 62 0
Mozilla Public License 1.0 (MPL) 227 187 40 0
Qt Public License (QPL) 214 152 62 -1
Academic Free License (AFL) 182 160 22 1
Python License (CNRI Python License) 139 117 22 0
Python Software Foundation License 123 102 21 0
PHP License 112 58 54 -1
IBM Public License 74 63 11 1
Apple Public Source License 51 51 0 0
wxWindows Library Licence 48 33 15 0
Sun Industry Standards Source License (SISSL) 47 29 18 -2
Sun Public License 45 26 19 -2
Table 2: Summary of used licenses in OssMole and our experiment. Note the stability in the ranking among the topmost licenses.
3.4
OssMole file:
sfSummaryOpSysData21-Oct-2004.txt
3.4.1
Target operating systems
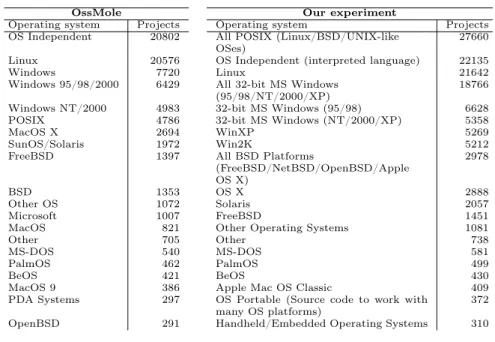
Target operating systems summaries differ very much between OssMole and our experiment.
It is mostly due to major changes in names of categories. This is somewhat of a mistery
to us—we suppose either SourceForge changed Trove classification system at some point, or
OssMole’s data has been modified from Trove’s classification to reduce the set of classes.
Compare listings of topmost classes in Tab. 3. Another factor that obscures a clear view
of classes is that Trove categories are hierarchical and sometimes projects are assigned to
internal hierarchy nodes and leaves at the same time.
3.5
OssMole file:
sfSummaryProgLangData21-Oct-2004.txt
3.5.1
Language of implementation
Ranking of implementation languages remained virtually unchanged from OssMole’s version
(see Tab. 4). A few new languages apparently have been added to Trove and there is a steady
increase in the project counts, but the ranking has not changed much. Note strong position
of Java in comparison with C#. Assembly language, even though strong in the ranking,
gained only 7 projects in two months.
3.6
OssMole file:
sfSummaryStatusData21-Oct-2004.txt
3.6.1
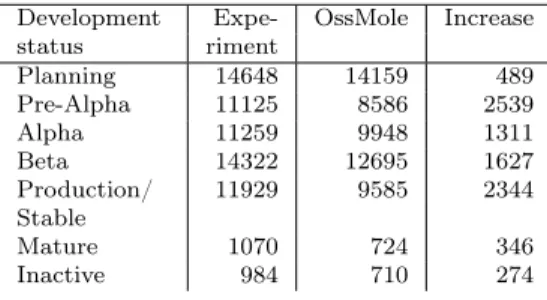
Declared development status
Comparison of development statuses between OssMole and our experiment shows major
increases in products marked as
Pre-Alpha
and
Production/Stable
(by over 2000 projects).
Pre-alpha growth could be explained by projects that were added to SourceForge in between
the two experiments. There seems to be no clear source for such increase in stable projects
OssMole Our experiment
Operating system Projects Operating system Projects OS Independent 20802 All POSIX (Linux/BSD/UNIX-like
OSes)
27660 Linux 20576 OS Independent (interpreted language) 22135
Windows 7720 Linux 21642
Windows 95/98/2000 6429 All 32-bit MS Windows (95/98/NT/2000/XP)
18766 Windows NT/2000 4983 32-bit MS Windows (95/98) 6628 POSIX 4786 32-bit MS Windows (NT/2000/XP) 5358
MacOS X 2694 WinXP 5269
SunOS/Solaris 1972 Win2K 5212 FreeBSD 1397 All BSD Platforms
(FreeBSD/NetBSD/OpenBSD/Apple OS X) 2978 BSD 1353 OS X 2888 Other OS 1072 Solaris 2057 Microsoft 1007 FreeBSD 1451
MacOS 821 Other Operating Systems 1081
Other 705 Other 738
MS-DOS 540 MS-DOS 581
PalmOS 462 PalmOS 499
BeOS 421 BeOS 430
MacOS 9 386 Apple Mac OS Classic 409 PDA Systems 297 OS Portable (Source code to work with
many OS platforms)
372 OpenBSD 291 Handheld/Embedded Operating Systems 310
Table 3:Topmost classes for target operating systems in OssMole and our experiment. Note major differences in names of classes.
number (all statuses noted an increase in counts and the number of recently added projects
does not entirely balance this increase).
! "##
Figure 3: Declared development statuses in OssMole and our experiment.
3.7
OssMole file:
sfSummaryRegistrationData21-Oct-2004.txt
3.7.1
Registration history
As mentioned before in Section 3.1.3, we could expect certain discrepancy in the number of
registrations over time between OssMole’s and our data. Theoretically, the past numbers
should be identical, but as we showed, several projects have been physically removed from
SourceForge. Large increase in 2004 is of course caused by the two months of difference
between crawl times of the two experiments (however, the difference accounts only for 4221
new registrations and as we showed in Section 3.1.3, the actual difference between data sets
is 4744 projects).
3.8
OssMole file:
sfSummaryTopicData21-Oct-2004.txt
3.8.1
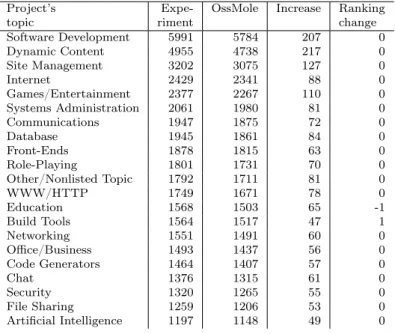
Declared topic
As for projects’ declared topic, no major changes could be observed between OssMole and
our experiment (see Tab. 7). A few new categories appeared, but it seems like the work
Implementation Our OssMole Increase Ranking language experiment change C++ 14326 13793 533 0 C 13962 13547 415 0 Java 13552 12872 680 0 PHP 9976 9480 496 0 Perl 5554 5407 147 0 Python 3608 3432 176 0 JavaScript 2054 1946 108 0 C# 2052 1847 205 -1 Visual Basic 1989 1939 50 1 Delphi/Kylix 1643 1568 75 0 Unix Shell 1575 1515 60 0 Assembly 1467 1460 7 0 PL/SQL 1056 1031 25 0 Tcl 841 818 23 0 Objective C 614 588 26 0 ASP 514 499 15 0 Ruby 320 312 8 0 Lisp 305 303 2 0 Pascal 302 293 9 0 Object Pascal 239 225 14 0 Scheme 187 182 5 0
Standard ML 137 #N/A #N/A #N/A
Fortran 133 126 7 0
Cold Fusion 125 122 3 0
Zope 121 119 2 0
Table 4:Implementation languages in OssMole and our experiment.
Development Expe- OssMole Increase
status riment Planning 14648 14159 489 Pre-Alpha 11125 8586 2539 Alpha 11259 9948 1311 Beta 14322 12695 1627 Production/ Stable 11929 9585 2344 Mature 1070 724 346 Inactive 984 710 274
Table 5: Declared development statuses in OssMole and our experiment.
on categorization of software on SourceForge is still in progress, or is badly designed. A
highlight example: in the
DocBook
category of Trove
5there was only one project at the time
of our crawl
6and it was
not
the main DocBook stylesheets project, which is also hosted on
SourceForge. . . In fact, DocBook stylesheets project is not even categorized in Trove.
3.9
Summary of the comparison
Comparison of our data with OssMole’s yields some interesting observations, especially about
changes undergoing the SourceForge software classification system Trove. Analysis of Open
Source projects data over time additionally shows certain aspects of open source dynamics,
which is obscure with static snapshots. It may be a good idea for the future to focus on this
temporal activity going on at SourceForge.
5http://sourceforge.net/softwaremap/trove_list.php?form_cat=555 6http://sourceforge.net/projects/xml2texml/
Development Expe- OssMole Increase status riment 1999 433 433 0 2000 5660 5662 -2 2001 16354 16412 -58 2002 21618 21676 -58 2003 22377 22436 -59 2004 20864 16643 4221
Table 6: Number of registrations per year in OssMole and our experiment.
Project’s Expe- OssMole Increase Ranking
topic riment change
Software Development 5991 5784 207 0 Dynamic Content 4955 4738 217 0 Site Management 3202 3075 127 0 Internet 2429 2341 88 0 Games/Entertainment 2377 2267 110 0 Systems Administration 2061 1980 81 0 Communications 1947 1875 72 0 Database 1945 1861 84 0 Front-Ends 1878 1815 63 0 Role-Playing 1801 1731 70 0 Other/Nonlisted Topic 1792 1711 81 0 WWW/HTTP 1749 1671 78 0 Education 1568 1503 65 -1 Build Tools 1564 1517 47 1 Networking 1551 1491 60 0 Office/Business 1493 1437 56 0 Code Generators 1464 1407 57 0 Chat 1376 1315 61 0 Security 1320 1265 55 0 File Sharing 1259 1206 53 0 Artificial Intelligence 1197 1148 49 0
4
Complete results of analyses performed on the crawled
data
This section presents additional analyses we performed on the projects database. SQL queries
along with charts or tabular data are provided.
The following subsections are organized arbitrarily into what we perceive as logically
related items:
Project activity.
Widely understood ‘activity’ of projects and SourceForge as a hosting
facility in general. We include potentially objective indicators of activity, such as the
number of bugs, patches and feature requests. There are also some analyses we consider
highly subjective, but useful: SourceForge’s activity indicator or self-assigned project
status.
Developers.
A group related to analyses concerning developers.
History of project registrations.
History of project registrations on SourceForge.
Self-declared project properties.
This groups presents statistics created for projects that
are included in Trove. Be aware that not all projects have this kind of information.
4.1
Project activity
4.1.1
Number of projects with SourceForge activity factor
>
0
SQL query select count(*) as "Number of projects with activity > 0"
from projects where invalid = 0
and activity is not NULL and activity > 0;
SQL result +---+
| Number of projects with activity > 0 | +---+
| 17139 |
4.1.2
Distribution of SourceForge activity factors
SQL queryselect activity from projects
where activity is not null and activity > 0 order by activity desc
From the result of the above SQL query we created a chart, presented in Fig. 4. The
values of activity drop very linearly, which is quite surprising.
0 20 40 60 80 100 Activit y (SourceF orge’s) 0 2500 5000 7500 10000 12500 15000 17500
Position of a project in a list ordered by activity (activity>0)
4.1.3
Topmost projects according to SourceForge activity factor
SQL queryselect proj_full_name as "Project", activity from projects
order by activity desc limit 30;
SQL result +---+---+
| Project | activity |
+---+---+ | Azureus - BitTorrent Client | 100 |
| Gaim | 99.99 |
| FCKeditor | 99.99 |
| eGroupWare: Enterprise Collaboration | 99.98 | | POPFile - Automatic Email Classification | 99.98 |
| AMSN | 99.97 |
| openCRX - Limitless Relationship Mgmt | 99.97 | | Compiere ERP + CRM Business Solution | 99.96 |
| ScummVM | 99.96 | | WebCalendar | 99.95 | | phpMyAdmin | 99.95 | | vtiger CRM | 99.93 | | Dev-C++ | 99.93 | | SugarCRM | 99.92 | | PDFCreator | 99.92 | | FileZilla | 99.92 | | OpenWFE | 99.91 | | PhpWiki | 99.91 | | JasperReports | 99.91 | | 7-Zip | 99.91 |
| MinGW - Minimalist GNU for Windows | 99.9 | | RSSOwl | RSS / RDF / Atom Newsreader | 99.9 |
| AWStats | 99.89 |
| ABC [Yet Another Bittorrent Client] | 99.88 | | SW Test Automation Framework | 99.87 |
| MegaMek | 99.87 |
| jTDS - SQL Server and Sybase JDBC driver | 99.87 |
| guliverkli | 99.86 |
| PMD | 99.86 |
| DrPython | 99.86 |
4.1.4
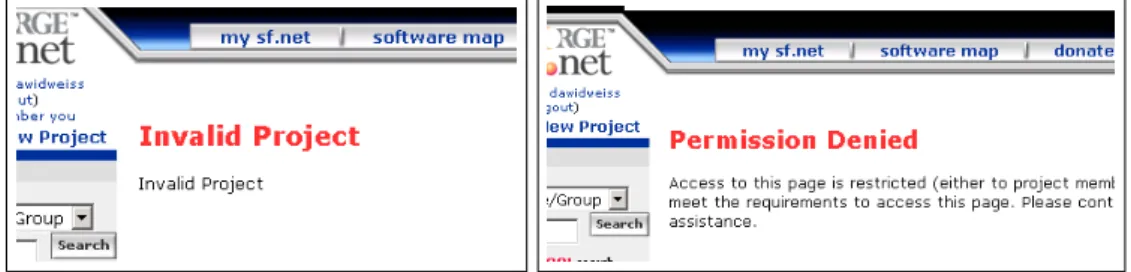
Number of invalid and inaccessible projects
While crawling SourceForge we encountered many projects for which their home pages were
either inaccessible, or invalid (see Fig. 5). Inaccessible pages are blocked by project
admin-istrators. We could not come up with any sensible explanation for invalid pages.
Figure 5: SourceForge returned invalid (left) or inaccessible (right) pages for a number of projects.
Number of projects with ‘Permission Denied’ status
SQL queryselect count(*) as "Projects with permission denied status" from projects
where permission_denied = 1;
SQL result +---+
| Projects with permission denied status | +---+
| 74 |
+---+
Number of projects with ‘Invalid Project’ status
SQL query ## Number of invalid projects (Home page says ’Project invalid’) #
select count(*) as "Invalid projects" from projects where invalid = 1; SQL result +---+ | Invalid projects | +---+ | 2251 | +---+
4.1.5
Development status declared by projects
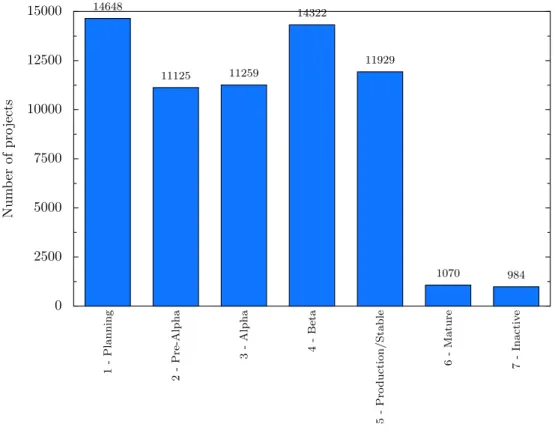
A chart of number of projects with a given development status is shown in Fig. 6. Note
the disproportion between software declared as stable and software in alpha, or planning
phase—great majority of SourceForge projects are merely start-ups according to this data.
0
2500
5000
7500
10000
12500
15000
Num
b
er
of
pro
jects
1 -Planning 2 -Pre-Alpha 3 -Alpha 4 -Beta 5 -Pro duction/Stable 6 -Mature 7 -Inactiv e 14648 11125 11259 14322 11929 1070 984Figure 6: Count of projects with a given development status
SQL query #
# Development status and its count of projects. #
select name as "Development Status", count(*) as "Count of Projects" from projects, trove, trove_categories
where trove_categories.type = "development_status" and projects.proj_id = trove.fk_proj_id and trove_categories.trove_id = trove.fk_trove_id group by name
order by 1 asc;
SQL result +---+---+ | Development Status | Count of Projects | +---+---+ | 1 - Planning | 14648 | | 2 - Pre-Alpha | 11125 | | 3 - Alpha | 11259 | | 4 - Beta | 14322 | | 5 - Production/Stable | 11929 | | 6 - Mature | 1070 | | 7 - Inactive | 984 | +---+---+
4.1.6
Number of projects with at least one bug
Note how low the result below is—it indicates that majority of projects hosted at SourceForge
have no bugs at all
. Knowing this situation is not likely to be true, the implication is that
these projects never really attracted a serious user community (or, in commercial terms, are
failures).
SQL query select count(*) as "Number of projects with at least 1 bug"
from projects
where invalid = 0 and bugs_total > 0; SQL result select count(*) as "Number of projects with at least 1 bug"
from projects
4.1.7
Distribution of the number of bugs in projects
Let us first take a look at averages:
SQL query
select avg(bugs_open) as "Avg open bugs", avg(bugs_total) as "Avg total bugs", count(*) as "Number of projects considered"
from projects where invalid = 0
and bugs_total is not null and bugs_open is not null;
SQL result
+---+---+---+ | Avg open bugs | Avg total bugs | Number of projects considered | +---+---+---+
| 0.9130 | 3.8183 | 85245 |
+---+---+---+
At an average, each project has approximately one open bug out of four ever submitted.
unfortunately, the averages are not good representatives of the distribution of bugs, which is
exponential (see Fig. 7 for a chart). This again would suggest that minority of OpenSource
projects are truly active.
SQL query SET @interval = 5;
select concat(floor(bugs_total/@interval)*@interval,
" - ", floor(bugs_total/@interval)*@interval+@interval-1) as "Total number of bugs (>0)",
count(*) as "Number of projects" from projects
where invalid = 0
and bugs_total is not null
and bugs_total > 0 and bugs_total < 100 group by floor(bugs_total/@interval)
order by floor(bugs_total/@interval) asc limit 30;
SQL result +---+---+ | Total number of bugs (>0) | Number of projects | +---+---+ | 0 - 4 | 8541 | | 5 - 9 | 2150 | | 10 - 14 | 905 | | 15 - 19 | 576 | | 20 - 24 | 346 | | 25 - 29 | 286 | | 30 - 34 | 204 | | 35 - 39 | 157 | | 40 - 44 | 119 | | 45 - 49 | 112 | | 50 - 54 | 91 | | 55 - 59 | 65 | | 60 - 64 | 51 | | 65 - 69 | 66 | | 70 - 74 | 51 | | 75 - 79 | 42 | | 80 - 84 | 40 | | 85 - 89 | 36 | | 90 - 94 | 24 | | 95 - 99 | 22 | +---+---+
0
2000
4000
6000
8000
10000
Num
b
er
of
pro
jects
0 -4 5 -9 10 -14 15 -19 20 -24 25 -29 30 -34 35 -39 40 -44 45 -49 50 -54 55 -59 60 -64 65 -69 70 -74 75 -79 80 -84 85 -89 90 -94 95 -99Total number of bugs (in intervals)
8541
2150
905
576
346 286 204 157 119 112 91 65 51 66 51 42 40 36 24 22
Figure 7:Histogram of distribution of the total number of bugs for projects with less than a 100 bugs.
4.1.8
Projects with highest numbers of submitted bugs
Analyses for open and total number of bugs are presented in Fig. 8 and Fig. 9.
SQL query select proj_full_name as "Project name",
bugs_open, bugs_total from projects
where invalid = 0
and bugs_open is not null order by 2 desc
limit 20;
SQL query select proj_full_name as "Project name",
bugs_open, bugs_total from projects
where invalid = 0
and bugs_total is not null and bugs_total > 140 order by 3 desc
200
400
600
800
1000
Num
b
er
of
op
en
bugs
Python Gaim AMSN wxWidgets (formerly wxWindo ws) Maxima – GPL CAS based on DOE-MA CSYMA FileZilla W ebmin Tk T o olkit eGroupW are: En terprise Collab oration Do oM Legacy Bo c hs x86 PC em ulator Anjuta C/C++ IDE Azureus -BitT orren t Clien t Tcl JBoss.org net-snmp Tiki CMS/Group w are 7-Zip Mailman Firebird 801 693 656 565 484 402 354 312 301 295 289 284 281 277 267 248 248 229 227 213Figure 8: Projects with most open bugs.
4.1.9
Distribution of the number of feature requests in projects
SQL querySET @interval = 5;
select concat(floor(feature_requests_total/@interval)*@interval,
" - ", floor(feature_requests_total/@interval)*@interval+@interval-1) as "Total number of feature requests",
count(*) as "Number of projects" from projects
where invalid = 0
and feature_requests_total is not null and feature_requests_total > 0 and feature_requests_total < 100 group by floor(feature_requests_total/@interval) order by floor(feature_requests_total/@interval) asc limit 30;
SQL result +---+---+ | Total number of feature requests | Number of projects | +---+---+ | 0 - 4 | 6027 | | 5 - 9 | 1548 | | 10 - 14 | 675 | | 15 - 19 | 393 | | 20 - 24 | 246 | | 25 - 29 | 199 | | 30 - 34 | 121 | | 35 - 39 | 93 |
0
2000
4000
6000
8000
10000
T
otal
n
um
b
er
of
bugs
Gaim Python Slash Tcl PCGen :: An RPG Character Generator jEdit JBoss.org wxWidgets (formerly wxWindo ws) StepMania more.group w are W ebmin Tk T o olkit Tiki CMS/Group w are SquirrelMail ScummVM Op en Merc han t Empires phpMyAdmin eGroupW are: En terprise Collab oration Compiere ERP + CRM Business Solution phpW ebSite Con ten t Managemen t System 8647 5524 3264 3101 2366 2333 2261 2098 2086 1968 1927 1833 1803 1721 1681 1664 1556 1478 1463 1435Figure 9: Projects with most total submitted bugs.
| 40 - 44 | 62 | | 45 - 49 | 59 | | 50 - 54 | 47 | | 55 - 59 | 34 | | 60 - 64 | 32 | | 65 - 69 | 24 | | 70 - 74 | 31 | | 75 - 79 | 23 | | 80 - 84 | 25 | | 85 - 89 | 13 | | 90 - 94 | 18 | | 95 - 99 | 8 | +---+---+
0
2000
4000
6000
8000
Num
b
er
of
pro
jects
0 -4 5 -9 10 -14 15 -19 20 -24 25 -29 30 -34 35 -39 40 -44 45 -49 50 -54 55 -59 60 -64 65 -69 70 -74 75 -79 80 -84 85 -89 90 -94 95 -99Total number of feature requests (intervals)
6027
1548
675
393
246 199 121 93 62 59 47 34 32 24 31 23 25 13 18 8
Figure 10: Histogram of distribution of the total number of feature requests (for projects with less than a 100 feature requests).
4.1.10
Projects with highest numbers of submitted feature requests
SQL queryselect proj_full_name as "Project name",
feature_requests_open as "f_req open", feature_requests_total as "f_req total" from projects
where invalid = 0
and feature_requests_total is not null and feature_requests_total > 0 order by 3 desc
limit 30;
0
500
1000
1500
2000
2500
3000
T
otal
n
um
b
er
of
feature
requests
SourceF orge.net Gaim DC++ Gallery PCGen :: An RPG Character Generator Ro c kb o x -Op en Source Juk eb o x Firm w are Azureus -BitT orren t Clien t POPFile -Automatic Email Classification Tiki CMS/Group w are Fire phpMyAdmin FileZilla MediaWiki more.group w are phpBB W ebGUI A WStats WinMerge phpW ebSite Con ten t Managemen t System Sylpheed-Cla ws MegaMek Inkscap e Gimp-Prin t -T op Qualit y Prin ter Driv ers Xb o x Media Pla y er (XBMP) T ortoiseCVS SquirrelMail CoffeeMud eGroupW are: En terprise Collab oration Compiere ERP + CRM Business Solution Slash 2548 2401 2359 1346 1314 1126 1009 963 816 667 664 650 637 565 550 549 526 512 504 499 497 493 483 465 464 446 443 442 436 432Figure 11:Projects with most submitted feature requests.
4.1.11
Distribution of the number of code patches in projects
SQL querySET @interval = 5;
select concat(floor(patches_total/@interval)*@interval, " - ", floor(patches_total/@interval)*@interval+@interval-1)
as "Total number of patches (<100)", count(*) as "Number of projects"
from projects where invalid = 0
and patches_total is not null and patches_total > 0
and patches_total < 100 group by floor(patches_total/@interval) order by floor(patches_total/@interval) asc limit 30;
SQL result +---+---+ | Total number of patches (<100) | Number of projects | +---+---+ | 0 - 4 | 2823 | | 5 - 9 | 502 | | 10 - 14 | 208 | | 15 - 19 | 100 | | 20 - 24 | 51 | | 25 - 29 | 47 | | 30 - 34 | 23 | | 35 - 39 | 29 | | 40 - 44 | 20 | | 45 - 49 | 15 | | 50 - 54 | 12 | | 55 - 59 | 8 | | 60 - 64 | 10 |
| 65 - 69 | 9 | | 70 - 74 | 5 | | 75 - 79 | 2 | | 80 - 84 | 7 | | 85 - 89 | 4 | | 90 - 94 | 7 | | 95 - 99 | 2 | +---+---+
The above results are also shown in Fig. 12.
0
500
1000
1500
2000
2500
3000
Num
b
er
of
pro
jects
0 -4 5 -9 10 -14 15 -19 20 -24 25 -29 30 -34 35 -39 40 -44 45 -49 50 -54 55 -59 60 -64 65 -69 70 -74 75 -79 80 -84 85 -89 90 -94 95 -99Total number of patches (intervals)
2823
502
208
100 51 47 23 29 20 15 12 8 10 9 5 2 7 4 7 2
Figure 12:Histogram of distribution of the total number of code patches (for projects with less than a 100 code patches).
4.1.12
Projects with highest numbers of submitted code patches
SQL queryselect proj_full_name as "Project name", patches_open, patches_total from projects
where invalid = 0
and patches_total is not null and patches_total > 0
order by 3 desc limit 20;
Results are illustrated in Fig. 13. Note the winner—SourceForge itself.
0
500
1000
1500
2000
2500
3000
T
otal
n
um
b
er
of
patc
hes
Python wxWidgets (formerly wxWindo ws) GaimWinMerge JBoss.org net-snmp ScummVM
Ro c kb o x -Op en Source Juk eb o x Firm w are Op enTTD Tcl Xb o x Media Pla y er (XBMP) SquirrelMail Mailman POPFile -Automatic Email Classification Lin ux Kernel SCTP Xb o x Media Cen ter eGroupW are: En terprise Collab oration SCons -a Soft w are Construction to ol BZFlag -Multipla y er 3D T ank Game W ebCalendar 2974 2063 1851 1043 547 526 488 451 441 411 373 367 341 330 322 310 309 297 291 265
4.2
Developers
4.2.1
Average number of developers per project
SQL query select avg(developers) as "Average developers per project",std(developers) as "StdDev" from projects
where invalid = 0;
SQL result +---+---+
| Average developers per project | StdDev | +---+---+
| 2.0067 | 3.2725 |
+---+---+
Note that we are not concerned with the actual input individual developers put into the
project—for that we would need access to the code repository, or some other metric of effort
for every developer. This kind of analysis has been performed on a large scale before in [1]
for example.
4.2.2
Distribution of the number of developers in projects
SQL queryselect developers as "Number of developers", count(*) as "Number of projects" from projects where invalid = 0 group by developers;
0
10000
20000
30000
40000
50000
60000
Num
b
er
of
pro
jects
with
this
n
um
b
er
of
dev
elop
ers
0 1 2 3 4 5 6 7 8 910 11 12 13 14 15 16 17 18 19 20 21 22 23 24 25 26 27 28 29 30 31 32 33 34 35 36 37 38 39 40 41Number of developers in a project
138 58047 13724 5679 3144 1892 1238 821 530 402 295 227 192 147 118 91 69 67 58 49 35 36 29 30 20 22 23 13 15 17 15 7 11 3 5 8 5 6 6 6 3 2
Figure 14:Distribution of the number of developers in projects.
The results of this analysis (see Fig. 14) show that there is a significant fraction of projects
with truly outstanding number of developers (although some of them seem to be ridiculous—
more than a hundred developers in a project cannot be good). A list of projects with most
developers is given below.
SQL query select proj_unix_name, proj_full_name, developers
from projects where developers > 40 order by developers desc;
SQL result
+---+---+---+ | proj_unix_name | proj_full_name | developers | +---+---+---+
| tikiwiki | Tiki CMS/Groupware | 274 |
| collective | Collective | 207 |
| venividiwiki | VeniVidiWiki | 156 |
| tinyos | TinyOS | 138 |
| pkgsrc-wip | work-in-progress pkgsrc packages | 137 |
| stepmania | StepMania | 132 |
| jboss | JBoss.org | 118 |
| jedit | jEdit | 110 |
| care2002 | CARE2X php Integ Hospital Info System | 103 |
| moodle | Moodle | 94 |
| plone | Plone | 88 |
| leaf | LEAF - Linux Embedded Appliance Firewall | 85 |
| boost | Boost C++ Libraries | 84 |
| firebird | Firebird | 83 |
| vxl | The VXL Project | 83 |
| xoops | XOOPS Dynamic Web CMS | 76 |
| fink | Fink | 75 |
| plone-i18n | Plone Internationalization Effort | 75 | | ai-standards | AI Interface Standards Committee | 75 |
| crystal | Crystal Space 3D SDK | 69 |
| dsdevguild | Dungeon Siege - Developers Guild | 67 |
| python | Python | 67 |
| pn-modules | Nuke Modules CVS | 65 |
| archetypes | Archetypes | 64 |
| freenet | The Freenet Project | 63 |
| docutils | Docutils: Documentation Utilities | 62 |
| boost-sandbox | Boost Sandbox | 61 |
| pcgen | PCGen :: An RPG Character Generator | 60 |
| mod-pubsub | mod_pubsub | 57 |
| harbour-project | Harbour | 57 |
| lse | Linux Scalability Effort | 56 |
| compiere | Compiere ERP + CRM Business Solution | 55 | | bzflag | BZFlag - Multiplayer 3D Tank Game | 55 |
| wikipedia | MediaWiki | 54 |
| stepmod | STEP Module Repository | 52 |
| aaf | Advanced Authoring Format | 51 |
| xbmc | Xbox Media Center | 50 |
| aolserver | AOLserver | 50 |
| xharbour | xHarbour Extended Harbour Compiler | 49 |
| koha | Koha | 49 |
| vegastrike | Vega Strike | 49 |
| gamescrafters | GamesCrafters | 48 |
| gphoto | gPhoto | 48 |
| geotools | GeoTools, the java GIS toolkit | 48 |
| cwruser | CWRUser | 47 | | slicker | Slicker | 47 | | tcl | Tcl | 46 | | dotnetopensrc | NMatrix | 46 | | tcllib | tcllib | 46 | | open-beos | openbeos | 46 |
| lug-bg | LUG-BG Projects | 45 |
| mged | mged | 44 |
| emc | Enhanced Machine Controller | 44 |
| enlightenment | Enlightenment | 44 |
| sundog | SunDog Resurrection | 44 |
| squid | Squid HTTP Proxy Developments | 43 |
| lsb | Linux Standard Base | 43 |
| pgmfi | PGMFI Project | 43 |
| mingw | MinGW - Minimalist GNU for Windows | 42 | | esmf | Earth System Modeling Framework | 42 |
| coros | COROS | 41 |
| tktoolkit | Tk Toolkit | 41 |
4.3
History of project registrations
History of registrations (per month) is shown in Fig. 15.
SQL query
select DATE_FORMAT(registration_date, "%Y/%m") as "Registration month", count(*) as "Count of Projects"
from projects
where registration_date IS NOT NULL group by 1 order by 1 asc;
0
500
1000
1500
2000
2500
Num
b
er
of
pro
jects
registered
mon
thly
1999/11 1999/12 2000/01 2000/02 2000/03 2000/04 2000/05 2000/06 2000/07 2000/08 2000/09 2000/10 2000/11 2000/12 2001/01 2001/02 2001/03 2001/04 2001/05 2001/06 2001/07 2001/08 2001/09 2001/10 2001/11 2001/12 2002/01 2002/02 2002/03 2002/04 2002/05 2002/06 2002/07 2002/08 2002/09 2002/10 2002/11 2002/12 2003/01 2003/02 2003/03 2003/04 2003/05 2003/06 2003/07 2003/08 2003/09 2003/10 2003/11 2003/12 2004/01 2004/02 2004/03 2004/04 2004/05 2004/06 2004/07 2004/08 2004/09 2004/10 2004/11 2004/12 198 235 480 422 455 405 440 418 486 532 457 571 530 464 623 1330 1747 1470 1436 1379 1531 1543 1295 1435 1274 1291 1808 1772 1799 2013 1759 1672 1887 1724 1800 1978 1744 1662 2020 1741 1822 1818 1802 1707 1985 1745 1944 2094 1965 1734 1918 1499 1938 1849 1757 1798 1917 1810 1747 1907 1838 8864.4
Self-declared project properties
4.4.1
Number of language translations per project
Number of language translations per project is illustrated in Fig. 16. Majority of projects is
unilingual. High number of bilingual projects may be a result of foreign projects being later
(or even at the time of development) translated to English.
SQL query
select cnt1 as "Number of translations", count(*) as "Number of projects" from ( select count(*) as cnt1
from projects, trove, trove_categories where trove_categories.type = "translations"
and projects.proj_id = trove.fk_proj_id and trove_categories.trove_id = trove.fk_trove_id group by proj_id ) as SUBQUERY group by cnt1 order by 1;
0
10000
20000
30000
40000
50000
Num
b
er
of
pro
jects
1 2 3 4 5 6 7 8 9 10 11 12 13 14 15 19 20 21 26 27 29 31 37 39Number of translations in a project
40649
9486
912
176 86 169 10 10 4 5 3 6 1 1 3 1 1 4 1 1 1 1 1 1
4.4.2
Most translated projects
SQL query select proj_full_name, count(*) as "Number of translations"
from projects, trove, trove_categories where trove_categories.type = "translations"
and projects.proj_id = trove.fk_proj_id and trove_categories.trove_id = trove.fk_trove_id group by proj_id
having count(*) > 9 order by 2 desc;
SQL result
+---+---+ | proj_full_name | Number of translations | +---+---+ | Nullsoft Scriptable Install System | 39 |
| Tux Paint | 37 |
| Azureus - BitTorrent Client | 31 |
| eMule | 29 |
| FCKeditor | 27 |
| RSSOwl | RSS / RDF / Atom Newsreader | 26 | | CARE2X php Integ Hospital Info System | 21 |
| GCompris : I got IT | 21 |
| gPhoto | 21 |
| WinMerge | 21 |
| yet another php photo album-next gener. | 20 |
| SiteBar | 19 | | BonkEnc | 15 | | Hunky Fonts | 15 | | WinSCP | 15 | | phpWebFTP | 14 | | Silky | 13 | | Booby | 12 | | Dellary | 12 | | Dokeos | 12 | | BASE | 12 | | TortoiseCVS | 12 | | xCHM | 12 |
| BZFlag - Multiplayer 3D Tank Game | 11 |
| El Carpincho Project | 11 |
| The PHP Photo Archive | 11 |
| AutoIndex PHP Script (Directory Indexer) | 10 |
| blueMSX | 10 |
| Bobb’s PHP File List System | 10 |
| phpMyBackupPro | 10 |
| phpScheduleIt | 10 |
4.4.3
Most popular languages
As expected, English strongly dominates as the primary language for most of the projects.
Note strong European influence in the chart.
SQL query #
# Translations. #
select name as "Translations", count(*) as "Count of Projects" from projects, trove, trove_categories
where trove_categories.type = "translations" and projects.proj_id = trove.fk_proj_id and trove_categories.trove_id = trove.fk_trove_id group by name
order by 2 desc, 1 asc;
0
10000
20000
30000
40000
50000
Num
b
er
of
pro
jects
with
language
translations
English German F renc hSpanish Russian Italian
Brazilian P ortuguese Dutc h Japanese P olish Chinese (Simplified) Sw edish Chinese (T raditional) Portuguese Czec h Hungarian
Danish Turkish Catalan Romanian Norw
egian
Finnish Hebrew Korean Ukranian Bulgarian
Greek Arabic Slo
v ak Indonesian Vietnamese Hindi Esp eran to Thai Serbian T amil Croatian Afrik aans P ersian Slo v ene Latvian Lith uanian Mala y Latin Urdu Bosnian T elugu P anjabi
Icelandic Bengali Marathi
48482
4809
3036
2064
1075 878 601 543 423 369 350 238 204 169 165 141 121 115 110 105 102 89 85 82 74 72 72 65 63 55 44 41 37 37 31 31 26 24 24 23 19 17 17 15 12 11 10 8 7 6 6
4.4.4
Most popular programming languages
Distribution of programming languages among projects is presented in Fig. 18. As stated
previously in Section 3.5.1, note strong position of Java versus C#.
SQL query #
# Programming languages ordered by the count of projects #
select name as "Programming Language", count(*) as "Count of Projects" from projects, trove, trove_categories
where trove_categories.type = "programming_language" and projects.proj_id = trove.fk_proj_id and trove_categories.trove_id = trove.fk_trove_id group by name order by 2 desc;
0
2500
5000
7500
10000
12500
15000
Num
b
er
of
pro
jects
using
the
language
C++ C Ja v a PHP Perl Python Ja v aScript C# Visual Basic Delphi/Kylix Unix Shell Assem bly PL/SQL Tcl Ob jectiv e C ASP Rub y Lisp P ascal Ob ject P ascal Sc heme Standard ML F ortran Cold F usion Zop e Prolog Ada Eiffel Forth Smalltalk Visual Basic .NET Rexx XBasic Erlang XSL (XSL T/XP ath/XSL-F O) PR OGRESS Hask ell Lua Pik e Euphoria Logo REBOL APL OCaml (Ob jectiv e Caml) D BASIC Y acc REALbasic Mo dula 14326 13962 13552 9976 5554 3608 2054 2052 1989 1643 1575 1467 1056 841 614 514 320 305 302 239 187 137 133 125 121 94 88 66 54 51 46 38 32 29 27 24 23 17 16 15 14 14 13 12 11 7 7 6 64.4.5
Most popular open source licenses
Distribution of various licenses declared by projects is shown in Fig. 19.
0
10000
20000
30000
40000
50000
Num
b
er
of
pro
jects
GNU General Public License (GPL) GNU Library or Lesser General Public License (LGPL) BSD License Public Domain Artistic License MIT License Other/Proprietary License Apac he Soft w are License Mozilla Public License 1.1 (MPL 1.1) OSI-Appro v ed Op en Source Common Public License zlib/libpng License Op en Soft w are License Apac he License V2.0 Mozilla Public License 1.0 (MPL) Qt Public License (QPL) Academic F ree License (AFL) Python License (CNRI Python License) Python Soft w are F oundation License PHP License IBM Public License Apple Public Source License wxWindo ws Library Licence Sun Industry Standards Source License (SISSL) Sun Public License Jabb er Op en Source License Univ ersit y of Illinois/NCSA Op en Source License Zop e Public License Nethac k General Public License W3C License Eclipse Public License In tel Op en Source License Sleep ycat License A ttribution Assurance License Eiffel F orum License V2.0 Recipro cal Public License Op en Group T est Suite License Historical P ermission Notice and Disclaimer Nokia Op en Source License Eiffel F orum License Ricoh Source Co de Public License F air License V o vida Soft w are License 1.0 X.Net License CUA Office Public License V ersion 1.0 En tessa Public License 40275 6455 4172 1579 1160 1041 1000 930 716 473 416 288 270 260 227 214 182 139 123 112 74 51 48 47 45 40 37 31 27 26 24 22 21 18 16 16 15 11 8 7 7 6 6 6 2 2Figure 19:Number of open source licenses declared by projects (10 least important omitted).
SQL query #
# Licenses. #
select name as "License", count(*) as "Count of Projects" from projects, trove, trove_categories
where trove_categories.type = "license"
and projects.proj_id = trove.fk_proj_id and trove_categories.trove_id = trove.fk_trove_id group by name
order by 2 desc, 1 asc;
SQL result
+---+---+
| License | Count of Projects |
+---+---+ | GNU General Public License (GPL) | 40275 | | GNU Library or Lesser General Public License (LGPL) | 6455 |
| BSD License | 4172 |
| Public Domain | 1579 |
| Artistic License | 1160 |
| MIT License | 1041 |
| Other/Proprietary License | 1000 |
| Apache Software License | 930 |
| Mozilla Public License 1.1 (MPL 1.1) | 716 |
| Common Public License | 416 |
| zlib/libpng License | 288 |
| Open Software License | 270 |
| Apache License V2.0 | 260 |
| Mozilla Public License 1.0 (MPL) | 227 |
| Qt Public License (QPL) | 214 |
| Academic Free License (AFL) | 182 |
| Python License (CNRI Python License) | 139 | | Python Software Foundation License | 123 |
| PHP License | 112 |
| IBM Public License | 74 |
| Apple Public Source License | 51 |
| wxWindows Library Licence | 48 |
| Sun Industry Standards Source License (SISSL) | 47 |
| Sun Public License | 45 |
| Jabber Open Source License | 40 |
| University of Illinois/NCSA Open Source License | 37 |
| Zope Public License | 31 |
| Nethack General Public License | 27 |
| W3C License | 26 |
| Eclipse Public License | 24 |
| Intel Open Source License | 22 |
| Sleepycat License | 21 |
| Attribution Assurance License | 18 |
| Eiffel Forum License V2.0 | 16 |
| Reciprocal Public License | 16 |
| Open Group Test Suite License | 15 |
| Historical Permission Notice and Disclaimer | 11 |
| Nokia Open Source License | 8 |
| Eiffel Forum License | 7 |
| Ricoh Source Code Public License | 7 |
| Fair License | 6 |
| Vovida Software License 1.0 | 6 |
| X.Net License | 6 |
| CUA Office Public License Version 1.0 | 2 |
| Entessa Public License | 2 |
| MITRE Collaborative Virtual Workspace License (CVW) | 2 |
| NASA Open Source Agreement | 2 |
| EU DataGrid Software License | 1 |
| Frameworx Open License | 1 |
| Lucent Public License (Plan9) | 1 |
| Lucent Public License Version 1.02 | 1 |
| Motosoto License | 1 |
| OCLC Research Public License 2.0 | 1 |
| RealNetworks Public Source License V1.0 | 1 |
| Sybase Open Watcom Public License | 1 |
4.4.6
Target operating systems
Target operating systems declared by projects are presented in Fig. 20.
SQL query #
# Programming languages ordered by the count of projects #
select name as "Operating System", count(*) as "Count of Projects" from projects, trove, trove_categories
where trove_categories.type = "operating_system" and projects.proj_id = trove.fk_proj_id and trove_categories.trove_id = trove.fk_trove_id group by name
order by 2 desc;
SQL result
+---+---+
| Operating System | Count of Projects |
+---+---+
| All POSIX (Linux/BSD/UNIX-like OSes) | 27660 |
| OS Independent (Written in an interpreted language) | 22135 |
| Linux | 21642 |
| All 32-bit MS Windows (95/98/NT/2000/XP) | 18766 |
| 32-bit MS Windows (95/98) | 6628 |
| 32-bit MS Windows (NT/2000/XP) | 5358 |
| WinXP | 5269 |
| Win2K | 5212 |
| All BSD Platforms (FreeBSD/NetBSD/OpenBSD/Apple Mac OS X) | 2978 |
| OS X | 2888 |
| Solaris | 2057 |
| FreeBSD | 1451 |
| Other Operating Systems | 1081 |
| Other | 738 |
| MS-DOS | 581 |
| PalmOS | 499 |
| BeOS | 430 |
| Apple Mac OS Classic | 409 |
| OS Portable (Source code to work with many OS platforms) | 372 |
| Handheld/Embedded Operating Systems | 310 |
| OpenBSD | 308 | | HP-UX | 273 | | WinCE | 234 | | SGI IRIX | 231 | | IBM AIX | 216 | | NetBSD | 199 | | IBM OS/2 | 153 | | BSD/OS | 86 | | GNU Hurd | 81 | | SCO | 60 | | Cygwin (MS Windows) | 50 | | Microsoft Windows 3.x | 47 | | AmigaOS | 37 |
| Microsoft Windows Server 2003 | 36 |
| WinME | 21 | | MinGW/MSYS (MS Windows) | 19 | | MorphOS | 18 | | WinNT | 18 | | Win98 OSR2 | 16 | | Win98 | 14 |
| Project is an Operating System Distribution | 13 |
| Project is an Operating System Kernel | 12 |
| Project is OS Distribution-Specific | 10 |
| WINE | 10 |
| SymbianOS | 9 |
| Win95 | 8 |
| Classic 8-bit Operating Systems (Apple, Atari, Commodore, etc.) | 6 |
| QNX | 5 |
| Fink (Mac OS X) | 4 |
| DOSEMU | 3 |
| OpenVMS | 3 |
| VxWorks | 1 |
| Modern (Vendor-Supported) Desktop Operating Systems | 1 |