Personality and Work Stress:
The Role of Five-Factor Model Traits and
Cynicism in Perceptions of Work Characteristics
Maria Törnroos
Unit of Personality, Work, and Health Psychology Institute of Behavioural Sciences
University of Helsinki, Finland
Academic Dissertation to be publicly discussed, by due permission of the Faculty of Behavioural Sciences at the University of Helsinki, Auditorium XII, Unioninkatu 34,
on the 24th April 2015, at 12 o’clock
University of Helsinki Institute of Behavioural Sciences Studies in Psychology, 109, 2015
2 Supervisors:
Professor Mirka Hintsanen
Faculty of Education, University of Oulu, Oulu, Finland
Institute of Behavioural Sciences, University of Helsinki, Helsinki, Finland
Docent Taina Hintsa
Institute of Behavioural Sciences, University of Helsinki, Helsinki, Finland
Reviewers:
Professor Marianna Virtanen
Unit of Expertise in Work and Organizations, Finnish Institute of Occupational Health, Helsinki, Finland
Professor Saija Mauno
School of Social Sciences and Humanities, University of Tampere, Tampere, Finland
Opponent:
Professor Hugo Westerlund
Stress Research Institute, Stockholm University, Stockholm, Sweden
ISSN-L 1798-842X ISSN 1798-842X
ISBN 978-951-51-0903-3 (pbk.) ISBN 978-951-51-0904-0 (PDF)
http://ethesis.helsinki.fi
Helsinki University Print Helsinki 2015
3
CONTENTS
Abstract ... 5
Tiivistelmä ... 6
Acknowledgements ... 7
List of original publications ... 8
Abbreviations ... 9
1 Introduction ... 10
1.1 Stress – a physiological and psychological concept ... 10
1.2 Work stress – theories and methodological issues ... 11
1.2.1 The demand-control model ... 12
1.2.2 The effort-reward imbalance model ... 13
1.3 Personality ... 15
1.3.1 The Five-Factor Model of personality ... 16
1.3.2 Cynicism ... 16
1.4 Individual differences in perceptions of work stress ... 17
1.4.1 Five-Factor Model traits and stressful work characteristics ... 18
1.4.2 Cynicism and job strain ... 19
1.5 Gaps in previous research ... 20
2 Aims of the study ... 22
3 Methods ... 24
3.1 Participants ... 24
3.1.1 Design of the Young Finns study ... 24
3.1.2 Sample selection of the present study ... 24
3.2 Measures ... 26
3.2.1 Five-Factor Model personality traits and cynicism (Studies I, II and III) ... 27
3.2.2 Effort-reward imbalance (Studies I, III and IV) ... 27
3.2.3 Job strain (Studies II and III) ... 28
3.2.4 Covariates... 29
3.3 Statistical analyses ... 30
4 Results ... 33
4.1 Five-Factor Model personality traits and effort-reward imbalance (Study I) ... 33
4.2 Five-Factor Model personality traits and job strain (Study II) ... 36
4
4.4 Longitudinal measurement invariance of the effort-reward imbalance scales
(Study IV) ... 40
5 Discussion ... 43
5.1 Main findings ... 43
5.1.1 Five-Factor Model personality traits and work characteristics... 43
5.1.2 Bi-directional associations of cynicism and job strain ... 46
5.1.3 Longitudinal measurement invariance of the effort-reward imbalance scales ... 47
5.2 Methodological considerations ... 48
5.3 Theoretical implications ... 52
5.4 Conclusions and practical implications ... 54
6 References ... 57
5
Abstract
The role of individual differences in perceptions of stress has long been recognized. Despite this, the models that are used to measure stress at the workplace—the job strain model and the effort-reward imbalance model—were developed to assess strenuous work characteristics and their health effects, regardless of the individual. Because work characteristics are usually measured using self-reports the measures cannot be completely objective. The present study examined the susceptibility of the job strain model and the effort-reward imbalance model to Five-Factor personality traits and cynicism. In addition, this study tested the longitudinal measurement invariance of the effort-reward imbalance scales. This study was part of the ongoing prospective, population-based Young Finns study. The measurements for the present study were carried out in 2001, 2007, and 2012. Five-Factor personality traits were assessed with a questionnaire on the Five-Factor model, and cynicism was assessed with a scale derived from the Minnesota Multiphasic Personality Inventory. Work characteristics were measured with questionnaires on the job strain model and the effort-reward imbalance model.
The results showed that high neuroticism was associated with higher job strain and higher effort-reward imbalance and that high agreeableness was associated with lower job strain and lower effort-reward imbalance. High extraversion, high openness, and high conscientiousness were associated with lower job strain. Furthermore, high conscientiousness was related to lower effort-reward imbalance only in men. High job strain prospectively predicted higher cynicism six years later. The effort-reward imbalance scales achieved strict longitudinal measurement invariance and showed adequate criterion validity.
Although developed to measure the structural work environment, the job strain model and the effort-reward imbalance model seem to be susceptible to Five-Factor personality traits—especially to neuroticism and agreeableness. In addition, high job strain seems to have far reaching consequences on cynical attitudes. Furthermore, the results show that scores on effort-reward imbalance from different time points can reliably be compared with each other. This study shows that organizations and occupational health services should apply a more person-oriented approach to increasing wellbeing at work.
6
Tiivistelmä
Yksilöllisten taipumusten merkitys stressin kokemisessa on jo pitkään tunnistettu ja esimerkiksi persoonallisuuden on todettu voivan vaikuttaa jokaiseen stressiprosessin vaiheeseen, altistumisesta palautumiseen. Kuitenkin työn stressaavia tekijöitä mittaavia malleja (työn vaatimukset–hallinta -malli sekä ponnistelu–palkitsevuus -malli) kehitettiin kuormittavien työolojen arviointiin sekä työolojen terveysvaikutusten selvittämiseksi, riippumatta yksilöstä. Tässä tutkimuksessa tarkasteltiin persoonallisuuden ja kyynisyyden yhteyttä kokemukseen työn stressaavista tekijöistä. Tämän lisäksi tutkittiin ponnistelu–palkitsevuus -mittarin pysyvyyttä yli ajan. Tutkimus on osa Lasten ja nuorten sepelvaltimotautiriski (LASERI) tutkimusta, joka alkoi vuonna 1980 ja jonka seurantaa on toteutettu säännöllisin väliajoin. Tämän tutkimuksen mittaukset olivat vuosilta 2001, 2007 sekä 2012. Persoonallisuutta, kyynisyyttä sekä työn stressaavia tekijöitä mitattiin kyselylomakkeilla.
Tulokset osoittivat, että neuroottisuus oli yhteydessä kokemukseen korkeasta työstressistä kun taas sovinnollisuus oli yhteydessä kokemukseen matalasta työstressistä. Korkea ulospäinsuuntautuneisuus, korkea avoimuus sekä korkea tunnollisuus olivat yhteydessä matalaan koettuun työstressiin (vain työn vaatimukset– hallinta -malliin). Korkea tunnollisuus oli yhteydessä myös matalaan ponnistelu– palkitsevuus -mallin mukaiseen työstressiin mutta vain miehillä. Tämän lisäksi työn vaativuus–hallinta -mallin mukainen työstressi ennusti korkeampaa kyynisyyttä. Tulokset osoittivat myös, että ponnistelu–palkitsevuus -mittari oli pysyvä yli ajan.
Työn stressaavia tekijöitä mittaavat mallit kehitettiin kuvaamaan kuormittavia työoloja mutta tutkimuksemme tulokset näyttävät, että persoonallisuus vaikuttaa siihen, kuinka stressaaviksi yksilö kokee työolot. Etenkin neuroottisuus sekä sovinnollisuus ovat piirteitä, jotka vaikuttavat olevan tärkeitä työympäristön kokemiselle, riippumatta siitä kumpaa mallia käytetään arvioimaan työoloja. Tämän lisäksi työoloilla vaikuttaa olevan kauaskantoisia vaikutuksia kyynisiin asenteisiin. Tulokset tuovat myös tärkeätä tietoa siitä, että ponnistelu–palkitsevuus -mittaria voidaan luotettavasti käyttää tutkimuksiin työolojen muutoksesta. Tästä tutkimuksesta saatavaa tietoa voidaan hyödyntää tutkimuksissa, joissa työn vaatimukset–hallinta -mallia sekä ponnistelu– palkitsevuus -mallia käytetään arvioimaan työoloja. Lisäksi tätä tietoa voidaan hyödyntää työpaikan stressi-interventioiden suunnittelussa ja kehittämisessä.
7
Acknowledgements
First and foremost, I would like to thank my supervisors, Professor Mirka Hintsanen and Docent Taina Hintsa, for providing excellent supervision and guidance. I am also deeply appreciative for having had the opportunity to work in the research group of Professor Emerita Liisa Keltikangas-Järvinen, for all the wisdom and advice she has given me throughout this process, and for the possibility to utilize the Young Finns data.
I want to express my gratitude to Professor Saija Mauno and Professor Marianna Virtanen for reviewing my thesis. Their invaluable comments and expertise substantially helped me to improve my thesis. I would also like to thank the whole Young Finns team, especially Professor Olli T. Raitakari and Professor Jorma Viikari, for administering the data. All my co-authors also deserve a thanks for improving my manuscripts and sharing their knowledge. I also want to thank the National Doctoral Programme of Psychology for funding my thesis.
I am truly thankful for my friends and co-workers in the Personality and Well-being research group. For me social support is as important as other work characteristics—if not more important. A very special thanks goes to my dearest friends at work, Associate Professor Markus Jokela, Doctor Christian Hakulinen and Jaakko Airaksinen. Words cannot begin to describe what you mean to me and how grateful I am for your friendship. Other special thanks, and an apology for being so neurotic, go to my room-mates Doctor Kim Josefsson and Doctor Tom Rosenström—thank you for putting up with me. I also want to thank Professor Marko Elovainio, Docent Laura Pulkki-Råback, Doctor Sari Mullola and Doctor Päivi Merjonen for listening to my—sometimes trivial, sometimes real—problems and supporting me on this journey. Additional thanks go to Doctor Ilmari Määttänen, Ulla Pulkkinen, Satu Kumpulainen and Doctor Paula Virtala for inspiring conversations and for your fun company.
Last, but definitely not least, I want to thank my friends and family. Mira, the best of best, through rough and tough, and my parents Rose-Marie Ölander and Aimo Saarinen, who provided me with everything I needed, and always kept the door open for me to pursue whatever I want. Ironically, the thing I wanted wasn’t that far from home after all, though the field of study is different than that of my mother’s. However, I couldn’t have succeeded in anything without the love and support from my husband Jerker and our two beautiful children. You are my biggest fans and the light of my life.
8
List of original publications
This thesis is based on the following publications:
I Törnroos, M., Hintsanen, M., Hintsa, T., Jokela, M., Pulkki-Råback, L., Kivimäki, M., Hutri-Kähönen, N., & Keltikangas-Järvinen, L. (2012) Personality traits of the five-factor model are associated with effort-reward imbalance at work: a population-based study. Journal of Occupational and Environmental Medicine, 54(7), 875‒880.
DOI:10.1097/JOM.0b013e31824fe0e4
II Törnroos, M., Hintsanen, M., Hintsa, T., Jokela, M., Pulkki-Råback, L., Hutri-Kähönen, N., & Keltikangas-Järvinen, L. (2013) Associations between five-factor model traits and perceived job strain: a population-based study. Journal of
Occupational Health Psychology, 18(4), 492–500. DOI:10.1037/a0033987
III Törnroos, M., Elovainio, M., Keltikangas-Järvinen, L., Hintsa, T., Pulkki-Råback, L., Hakulinen, C., Merjonen, P., Theorell, T., Kivimäki, M., Raitakari, O. T., & Hintsanen, M. (In Press) Is there a two-way relationship between cynicism and job strain? Evidence from a prospective population-based study. Journal of Occupational and Environmental Medicine.
IV Törnroos, M., Keltikangas-Järvinen, L., Hintsa, T., Hakulinen, C., Pulkki-Råback, L., Jokela, M., Hutri-Kähönen, N., & Hintsanen, M. (2014) Longitudinal measurement invariance of the effort-reward imbalance scales in the Young Finns study.
Occupational and Environmental Medicine, 71(4), 289–294. DOI:10.1136/oemed-2013-101947
9
Abbreviations
NEO-FFI Neuroticism, Extraversion, Openness, Five-Factor Inventory NEO-PI Neuroticism, Extraversion, Openness, Personality Inventory CFI Comparative Fit Index
RMSEA Root Mean Square Error of Approximation BIC Bayesian Information Criterion
ERI Effort-reward imbalance CI Confidence Interval
10
1 Introduction
1.1 Stress – a physiological and psychological concept
In everyday life, the word stress can mean a multitude of things (Väänänen, Anttila, Turtiainen, & Varje, 2012), for example the stressors that elicit the stress response, the physiological reaction to a stressor or the stress process. The original definition of stress is that its function is to mobilize the body for fight or flight (Cannon, 1915).In modern Western societies, this reaction is abundant, as most of the stressors we encounter do not pose a physical threat. Instead, the very reaction that should protect us from physical harm exposes us to physiological reactions in our body that, if prolonged, affects our health in a negative way (Chandola, Heraclides, & Kumari, 2010).
In the literature, stress has been defined both as a physiological and as a psychological process. Physiological stress refers to the result of any demand on the body and the stress response is considered a necessary adaptive means for survival (Selye, 1956). In contrast, psychological stress has been defined as a mismatch between the demands of the environment and the individual’s resources, so that some individuals are more vulnerable to stress than others (Lazarus & Folkman, 1984). Lazarus (1966) has suggested that stress should not be treated as a variable, but as a rubric for many variables and processes that consist of but are not restricted to stressors, stress reactions, and outcomes.
If prolonged, both physiological and psychological stress may have adverse health consequences—e.g. cardiovascular disease, mortality, and depression—and it has been suggested that psychological stress affects health via physiological pathways (for example by activating the autonomic nervous system), via health behaviour or via different aspects of psychological well-being (e.g. anxiety, depression, and distress) (Bonde, 2008; Chandola et al., 2010; Elovainio et al., 2013; Hjemdahl, Rosengren, & Steptoe, 2011; Kivimäki et al., 2013; Steptoe & Kivimäki, 2012).
11
1.2 Work stress – theories and methodological issues
It was not until the late 20th century that work stress became an important occupational health issue in the Western societies and was understood as a threat to employees’ health and productivity (Väänänen et al., 2012). The term work stress has been used in the literature to depict strenuous working conditions and their consequences on health and wellbeing. The European Union defines work-related stress as an employee’s experience of not being able to cope with (or control) the demands from the work environment (EU-OSHA, 2009). Work stress, therefore, does not constitute the stress process—from exposure to recovery—but the stressors and reactions to them. Across Europe, the most common causes of work-related stress are job insecurity and workload (EU-OSHA, 2013). In 2005, 22% of the work-force in the 15 EU countries reported experiencing work-related stress (EU-OSHA, 2009). In Finland, 28% of the work-force reported having a mentally strenuous job in 2012 and 8% reported having stress symptoms (Kauppinen et al., 2013). Consequently, a majority of employees consider their work non-strenuous and for some, work promotes well-being (van der Noordt, IJzelenberg, Droomers, & Proper, 2014). However, those who do experience their working environment as being highly strenuous have an increased risk for detrimental health outcomes such as coronary heart disease or depression (Bonde, 2008; Kivimäki et al., 2012; Stansfeld, Shipley, Head, & Fuhrer, 2012; Steptoe & Kivimäki, 2012).
In order to conceptualize work stress and identify psychosocial risk factors at work, several models have been developed. As the measurement of stress at work is not confined to the biological markers of physiological stress (e.g. cortisol levels) but relies mostly on assessing psychological processes linked to the social environment, use of the term stress is often discouraged. Instead, researchers use the terms psychosocial risks at work or stressful work characteristics. The current study focuses on the two most prominent theoretical models on stressful work characteristics, the demand-control model (Karasek, 1979) and the effort-reward imbalance model (Siegrist, 1996). Both models are valid, reliable and they have been used extensively in occupational research to investigate the association between work characteristics and health outcomes (de Lange, Taris, Kompier, Houtman, & Bongers, 2003; Kivimäki et al., 2012; Stansfeld & Candy, 2006; van Vegchel, de Jonge, Bosma, & Schaufeli, 2005).
12 1.2.1 The demand-control model
Karasek’s (1979) demand-control model, or the job strain model, is one of the most frequently used theories on stressful work characteristics. The model defines work stress as two-dimensional: a high level of psychological demands combined with a low level of decision latitude constitutes the highest risk for job strain and stress-related diseases (Belkic, Landsbergis, Schnall, & Baker, 2004; Haeusser, Mojzisch, Niesel, & Schulz-Hardt, 2010; Kivimäki et al., 2012). The demand component refers to workload, while control (decision latitude) refers to the control over pace, use of skills, and decision authority an employee has (Karasek & Theorell, 1990). According to the model, the demands act as a stressor and control can act as a buffer to alleviate the strain caused by the demands (Karasek, 1979). Because stress is not measured directly (but through demand and control) the use of the word job strain instead of work stress, is encouraged when using the job strain model to depict stressful work characteristics (Karasek, 1979).
In order to explore the different effects of the interaction between demands and control on health, their interaction coefficient—job strain—has in the work stress literature been calculated using several different formulations, such as linear (job demands - job control), quotient (job demands / job control), and multiplicative terms (job demands x job control) (Landsbergis, Schnall, Warren, Pickering, & Schwartz, 1994; Schnall & Landsbergis, 1994). If the linear and quotient term show significant associations, the effect of demand and control on job strain are additive (i.e. job strain decreases by increasing control or decreasing demands) but if the multiplicative interaction term is significant, its effect is stronger than the two components’ alone. In addition, the multiplicative interaction implies that control acts as a buffer against high demands (van der Doef & Maes, 1998). The use of continuous variables, such as linear and quotient term, has been recommended (MacCallum, Zhang, Preacher, & Rucker, 2002) and when using a linear term of job strain the contributions of job demands and job control are equally weighed (Landsbergis et al., 1994). It has also been stated that if the main effects for demand and control are found, the implications for job redesign are essentially the same for the different job strain formulations (Karasek, 1989). The job strain model has further been extended with a component of social support, which interacts with demand and control so that the highest job strain, or iso-strain, is caused
13
by conditions where demands are high but control and social support are low (Johnson & Hall, 1988). The iso-strain model has gained support in the literature, albeit to a lesser extent than the job strain model, indicating that the measurement of social support is not as straightforward as the measurement of demand and control (Haeusser et al., 2010).
1.2.2 The effort-reward imbalance model
A more recent model on stressful work characteristics is the effort-reward imbalance model, in which an individual experiences stress at work if the reciprocity between efforts spent and rewards received is not fulfilled (Siegrist, 1996). Effort is interpreted as the demands and obligations the employee is faced with and reward as the money, esteem, and career opportunities (or job security) the employee subsequently expects, not only from the employer but also from society at large (Siegrist, 1996). According to the extrinsic effort-reward imbalance hypothesis, the combination of high effort and low reward—effort-reward imbalance—increases the risk of poor health independently of the risks associated with the each of the components alone (Siegrist, 1996). The extrinsic effort-reward imbalance hypothesis has been studied extensively and most studies support the notion that the lack of reciprocity between effort and reward is associated with employee health and well-being (Backe, Seidler, Latza, Rossnagel, & Schumann, 2012; Godin, Kittel, Coppieters, & Siegrist, 2005; Niedhammer, Tek, Starke, & Siegrist, 2004; van Vegchel et al., 2005). Effort-reward imbalance has also been linked to health risk behaviours such as alcohol intake or being overweight (Siegrist & Roedel, 2006).
In addition to extrinsic effort and reward, the effort-reward imbalance model also includes intrinsic overcommittment, characterized by high need for approval and excessive work-related commitment (Siegrist, 1996; Siegrist et al., 2004). Two additional hypotheses were developed based on overcommittment: the intrinsic overcommittment hypothesis, where high overcommittment is a psychosocial risk factor even in the absence of effort-reward imbalance, and the interaction hypothesis, where the highest risk on health occurs when all three components (effort, reward, and overcommittment) interact (Siegrist et al., 2004). The intrinsic overcommittment hypothesis has gained some support whereas the interaction hypothesis has been
14
scarcely studied and the results have been mixed (van Vegchel et al., 2005). According to the effort-reward imbalance model, most detrimental to health is when efforts are high and subsequent rewards are low over a long period of time (Siegrist et al., 2004). This state of prolonged imbalance is likely to occur because of 1) lack of alternatives in the labour market or limited mobility, 2) strategic reasons, such as hope of promotion, or 3) high overcommittment (Siegrist et al., 2004).
Although overlapping to some extent (for example demand and effort correspond quite closely to each other), the job strain model and the effort-reward imbalance model reflect slightly different aspects of the psychosocial working environment (Siegrist et al., 2004; Tsutsumi & Kawakami, 2004). Where the job strain model emphasizes task-level control, the effort-reward imbalance model emphasizes the rewards the employee receives (Siegrist et al., 2004). Control and reward also differ in how they reflect justice at work. Control is thought to be related to procedural justice (Theorell, 2003), whereas reward is thought to reflect distributive justice (Siegrist, 2001). Another characteristic that separates the two models is the personal component overcommittment in the otherwise situational effort-reward imbalance model (Siegrist et al., 2004). In addition, the two models differ in their power of explaining stress in different occupational settings (Calnan, Wadsworth, May, Smith, & Wainwright, 2004). Effort seems to explain more of perceived stress in managers and professionals than in other occupations, while perceived stress in sales and machine operatives is best explained by lack of control (Calnan et al., 2004). Furthermore, the effort-reward imbalance model is thought to be sensitive to changes in the labour market and to reflect the predominant macro-economic labour-market situation whereas the job strain model focuses on work place characteristics (Siegrist et al., 2004). Due to their similarities and differences, both models seem to be suitable tools for measuring stressful work characteristics in the current global economy characterized by increased insecurity in the labour market.
The surveillance of changes in work-related stress is important because these changes might reflect reactions to organizational restructuring or outcomes of stress interventions (Bourbonnais, Brisson, & Vezina, 2011; Limm et al., 2011). The analysis of change in work characteristics relies on the invariance of the scales used and the invariance of the scales allows researchers to make comparisons between constructs over time, knowing that the operationalization of the construct has not changed (Schmitt
15
& Kuljanin, 2008; Vandenberg & Lance, 2000). Due to the changing world of work and the sensitivity of the effort-reward imbalance model to these changes in the labour market (Siegrist et al., 2004), assessing its longitudinal measurement invariance is integral. Some previous studies on longitudinal measurement invariance of the effort-reward imbalance scales exist. In a Dutch panel study on 383 (first wave) and 267 (second wave) healthcare workers (80–90% women) with a 1 to 2 years follow-up, the factor loadings of the effort-reward imbalance scales were found not to be invariant over time (de Jonge, van der Linden, Schaufeli, Peter, & Siegrist, 2008). In contrast, a Finnish study on 758 white-collar professionals (14–17% women) showed that the effort-reward imbalance scales were invariant across time (Rantanen, Feldt, Hyvönen, Kinnunen, & Mäkikangas, 2013). The mixed findings may be a result of differences in the samples and further research is needed in order to establish that the scales measure work characteristics in the same way (i.e., the same latent variables) across repeated measurement times.
1.3 Personality
Personality is a relatively stable, individual way of thinking, feeling and behaving (Funder, 2012) and personality psychology has been proposed as the branch of psychology concerned with identifying individual differences (Goldberg, 1981; Norman, 1963). However, for a long time the field of personality research lacked tools to identify personality—there was a need for a taxonomy that could be used to explore, examine, and explain individual differences. The first taxonomy consisted of 16 primary factors and 8 second-order factors, based on peer-ratings of college students (Cattell, 1948) and although this taxonomy was complex, it laid the ground for later trait psychologists (Digman, 1990). Several researchers tried to replicate the factor structure but they all came to the same conclusion: personality can be adequately described by five superordinate dimensions (Fiske, 1949; Norman 1963; Tupes & Kristal, 1961). Each of these dimensions—or traits—contains a large number of more specific personality characteristics and captures the basic concepts of human personality.
16 1.3.1 The Five-Factor Model of personality
Continuing on the work of early trait psychologists Costa and McCrae (1985) developed a questionnaire to assess the five dimensions that would explain individual differences. The Five-Factor Model of personality has since become one of the most influential taxonomies of personality traits in personality research. It specifies five personality dimensions or traits: neuroticism, extraversion, openness, conscientiousness, and agreeableness (McCrae & Costa, 1987). Neuroticism can be defined as a tendency to worry, feelings of insecurity, and self-consciousness. Individuals high on the
neuroticism scale tend to be impulsive, experience more distress than others, and more often resort to self-blame when confronted with negative feelings. Extraversion can be defined as a tendency to be sociable, fun-loving, affectionate, friendly, and warm, and extraverted individuals prefer the company of others to being alone. Openness is characterized by originality, independence, and intellectual curiosity. Persons high on the openness scale are full of ideas and values and may be seen by others as intelligent. Conscientiousness can be described as a tendency to be well-organized, reliable, and persevering, and persons high on the conscientiousness scale are more capable of self-discipline than others and have an innate will to achieve. Lastly, agreeableness can be characterized as a tendency to be sympathetic, and forgiving, and an agreeable person usually trusts others and might therefore be taken advantage of more easily than persons with low agreeableness (McCrae & Costa, 1987). The five dimensions have been shown to be relatively enduring and stable over time, with normative personality change
occurring from young to old age (McCrae & Costa, 2003; Rantanen, Metsäpelto, Feldt, Pulkkinen, & Kokko, 2007). However, there is some debate on what drives normative personality change in adulthood—genes or social demands and experiences (McCrae & Costa, 2003; Roberts & Mroczek, 2008; Specht, Egloff, & Schmukle, 2011).
1.3.2 Cynicism
Hostility is a personality construct that is closely related to many concepts of trait psychology, such as neuroticism and agreeableness (Costa, Busch, Zonderman, & Mccrae, 1986; Watson & Clark, 1992). While the Five-Factor Model traits are thought of as major broad traits, hostility is described as a narrower facet or aspect of broader
17
traits. Cynicism represents the cognitive aspect of hostility and is defined as cynical and mistrustful attitudes and the tendency to interpret other’s actions as offensive (Greenglass & Julkunen, 1989; Smith, 1994). The development of cynical hostility may be determined by both genes and environmental factors (Hakulinen et al., 2012; Merjonen et al., 2011; Rebollo & Boomsma, 2006), including early childhood experiences, low family socioeconomic status, parental Type A behaviour, and Type A behaviour in childhood (Keltikangas-Järvinen & Heinonen, 2003). Cynicism is related to many social problems, such as isolation (Vandervoort, 1999), depression (Nabi et al., 2010), as well as somatic health problems, such as cardiovascular risk (Chida & Steptoe, 2009). Therefore cynicism constitutes a public health risk and studying the underlying factors and consequences is important.
1.4 Individual differences in perceptions of work stress
It has long been recognized that there are individual differences in stress reactivity and stress responses (Lazarus & Folkman, 1984; Lazarus, 1999; Lovallo, 1997). According to the classic theory by Lazarus and Folkman (1984), stress is caused by the interplay between individual characteristics and stress factors, so that some people are more vulnerable to stress than others. One of the most comprehensive individual characteristics behind the stress experience is personality—an individual’s personality may contribute to every stage of the stress process, i.e. exposure to the stressor, appraisal of the stressor, coping, vulnerability to illness and disease, as well as response to stress (Bolger & Zuckerman, 1995; Code & Langan-Fox, 2001).
In order to shed light on the relationship between personality and work characteristics, several models have been proposed; the differential exposure model, the differential reactivity model, the differential exposure-reactivity model, and the outcome model (Bolger & Zuckerman, 1995; Kivimäki, 1996). According to the differential exposure model, personality influences exposure to stressors (Bolger & Zuckerman, 1995). Having a certain personality selects individuals to situations where they are exposed to certain stressors, e.g. work characteristics. The differential reactivity model, however, proposes that personality impacts on stress reactivity; a change in stressors influences wellbeing differently for different personalities (Bolger &
18
Zuckerman, 1995). The differential exposure-reactivity model combines the two previous models; personality impacts exposure and response to stressors (Bolger & Zuckerman, 1995). In contrast to the other models, the outcome model suggests that stressors influence personality, either directly or through wellbeing (Kivimäki, 1996).
Stress at work has often been examined through the conceptual framework of environmental load, where occupational conditions at work are seen to cause stress. The measures for assessing stressful working conditions—the job strain model and the effort-reward imbalance model—were originally developed to depict structural aspects of work (i.e. objective work characteristics). However, studies examining the effects of the psychosocial working environment on employee health and wellbeing are often based on self-reports. Self-reports, in turn, are vulnerable to individual dispositions, such as personality, that may confound the associations of self-reported environmental stress factors and experienced stress with related health outcomes. Thus, some people may perceive, due to individual characteristics, that their environment is highly stressful, as suggested by the differential exposure model. Population-based prospective studies in Denmark (Ebstrup, Eplov, Pisinger, & Jorgensen, 2011) as well as in Finland (Hintsa et al., 2010a; Hintsanen et al., 2011) have shown that personality and temperament traits predict perceptions of job strain and effort-reward imbalance. In addition, it has been shown that the direction of the association runs from personality to stress, not the other way round (Sutin & Costa, 2010). However, personality has also been found to moderate the association between work characteristics and health (Grant & Langan-Fox, 2007; Moyle, 1995; Vahtera, Kivimäki, Uutela, & Pentti, 2000), which might support the differential reactivity model. The role of personality in perceptions of work characteristics defined by the job strain model and the effort-reward imbalance model is, thus, still not clear.
1.4.1 Five-Factor Model traits and stressful work characteristics
Previous research has found associations between the Five-Factor personality traits and different aspects of work. High neuroticism has been found to be associated with lower work satisfaction, higher risk of burnout, and physical ill health, while the opposite has been found for extraversion, conscientiousness, and agreeableness (Alarcon, Eschleman, & Bowling, 2009; Grant & Langan-Fox, 2007; Judge, Heller, & Mount, 2002; Roberts,
19
Caspi, & Moffitt, 2003). In a recent study of middle-aged full-time employees conducted in the United States, it was found that low neuroticism, high extraversion, high conscientiousness, and high openness were related to greater decision latitude at work (Sutin & Costa, 2010). However, the study did not find an association between personality and psychological demands, and it did not assess job strain. A study by Grant and Langan-Fox (2007) examined whether the Five-Factor personality traits affect subjective strain at work and found that neuroticism, extraversion, and conscientiousness were related to psychological strain. They did not, however, use the job strain model as a measure of strain.
Despite previous evidence, however, little is known about the associations between the Five-Factor Model traits and stressful work characteristics defined by the job strain model and the effort-reward imbalance model. Some previous studies on conceptually similar temperament traits imply that individual differences in perceptions of stressful work characteristics do exist. For instance, studies on the association of temperament with effort-reward imbalance and job strain have shown that negative emotionality, a temperament trait conceptually close to neuroticism, predicts higher job strain and effort-reward imbalance, whereas sociability, a temperament trait similar to extraversion, predicts lower job strain and effort-reward imbalance (Hintsanen et al., 2011). Studies on the trait negative affectivity, conceptually similar to neuroticism, have also found direct associations with higher work stress (Moyle, 1995; Oliver, Mansell, & Jose, 2010).
1.4.2 Cynicism and job strain
Studies suggest that cynicism is associated with work-related factors, such as unemployment, unstable labour market prospects, and poor career achievement (Caspi, Wright, Moffitt, & Silva, 1998; Hakulinen et al., 2013; Siegler et al., 2003). Although studies on the association of cynicism with job strain are lacking, previous studies on temperament and personality traits conceptually close to cynicism have been shown to predict job strain (Hintsa et al., 2010a; Hintsa, Hintsanen, Jokela, Pulkki-Råback, & Keltikangas-Järvinen, 2010b; Hintsanen et al., 2011). Based on these previous studies it can therefore be assumed that cynicism would be associated with work characteristics conceptualized by the job strain model.
20
According to the selection model, cynicism increases probability for higher exposure to stress (Kivimäki et al., 2003; Smith, 1994). Because of the tendency of cynical individuals to behave in an antagonistic and aggressive way, cynicism may produce interpersonal conflict and lead to reduced social support, which, in turn, may increase health risks (Smith, 1994). The vulnerability model suggests that cynical individuals are more vulnerable to psychosocial risks than non-cynical (Kivimäki et al., 2003; Smith, 1994). Indeed studies have shown that cynical men experience less justice and social support than non-cynical men (Elovainio, Kivimäki, Kortteinen, & Tuomikoski, 2001; Elovainio, Kivimäki, Vahtera, Virtanen, & Keltikangas-Järvinen, 2003). In addition, cynical individuals perceive their social environment more negatively than others (Smith, 1994) and thus it is reasonable to assume that they make more negative and extreme interpretations about their work environment.
The reverse direction of causality is also possible. Although cynicism is considered to be a relatively stable trait in adulthood, mean level change over time is possible (Hakulinen et al., 2014). According to the social context model adverse conditions, such as psychosocial stress are antecedents of cynicism (Taylor, Repetti, & Seeman, 1997). Previous studies have found that, in women, high workload predicts anger and cynicism, defined as an employee’s hostile attitudes towards work situations (Greenglass, Burke, & Moore, 2003; Greenglass, Burke, & Fiksenbaum, 2001). In addition, psychosocial factors at work can cause burnout, which is often characterized as cynicism, emotional exhaustion, and reduced professional efficacy (Lindblom, Linton, Fedeli, & Bryngelsson, 2006; Schaufeli, Leiter, Maslach, & Jackson, 1996).
1.5 Gaps in previous research
The role of Five-Factor model traits and cynicism in perceptions of stressful work characteristics is unclear. Although the structural work environment is important in perceptions of work characteristics, individual dispositions, such as personality, also play a part in what an individual is exposed to and how he or she perceives the working environment. In order to target stress interventions and prevention appropriately, identifying the role of individual traits, such as Five-Factor personality traits and cynicism in perceptions of work characteristics is of great importance. In addition, the
21
research literature on the association between work characteristics and cynicism suggests that the relationship might be bidirectional, but there are no prior studies that would have investigated this.
Surveillance of change in work characteristics as a result of intervention or organizational restructuring relies on the longitudinal measurement invariance of the measures used. Previous research on the invariance of the effort-reward imbalance scales is mixed, probably due to differences in the samples and an uneven distribution of gender and occupational groups. Therefore, more research is needed using population-based samples, a wider range of occupational groups, and an even gender distribution. It is also important to examine whether effort-reward imbalance scales have measurement invariance over longer time lags than four years. Examining the susceptibility of the job strain model and the effort-reward imbalance model to personality and establishing measurement invariance of the effort-reward imbalance scales brings information that can be important for a large amount of organizational and intervention studies.
22
2 Aims of the study
The first aim of the present study was to examine the associations of Five-Factor personality traits with effort-reward imbalance and job strain. The Five-Factor Model of personality defines five personality dimensions: neuroticism, extraversion, openness, conscientiousness, and agreeableness. The second aim of this study was to prospectively examine whether cynicism predicts job strain, or whether the association runs the other way. The third aim of this study was to examine whether the effort-reward imbalance scales are invariant over two measurement points five years apart. In addition, criterion validity of the effort-reward imbalance scales was examined using a single-item questionnaire on general stress. The specific research questions and hypotheses were as follows:
1) Are the Five-Factor personality traits associated with job strain and effort-reward imbalance?
Hypothesis 1a: high neuroticism is associated with higher effort-reward imbalance, whereas high extraversion, high openness, high conscientiousness, and high agreeableness are associated with lower effort-reward imbalance (Study I).
Hypothesis 1b: high neuroticism is associated with higher job strain, whereas high extraversion, high openness, high conscientiousness, and high agreeableness are associated with lower job strain (Study II).
2) Does cynicism predict job strain, and is the association bi-directional?
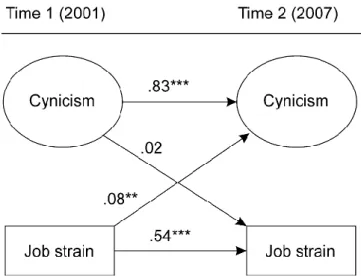
Hypothesis 2: high cynicism predicts higher job strain and high job strain predicts higher cynicism (Study III).
3) Are the effort-reward imbalance scales measurement invariant over two time-points and do the effort-reward imbalance scales have criterion validity?
Hypothesis 3a: the effort-reward imbalance scales are invariant over time (Study IV).
Hypothesis 3b: the effort-reward imbalance scales prospectively predict general stress (Study IV).
23
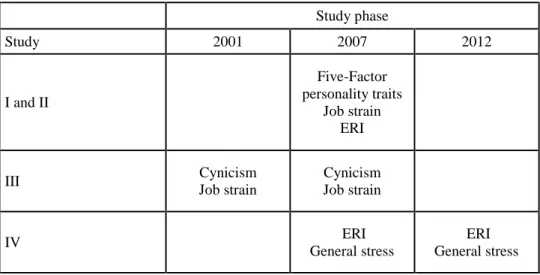
The study variables at the different study phases are depicted in Table 1.
Table 1. Study variables at different phases of the study
Study phase Study 2001 2007 2012 I and II Five-Factor personality traits Job strain ERI III Cynicism Job strain Cynicism Job strain IV ERI General stress ERI General stress ERI = Effort-reward imbalance
24
3 Methods
3.1 Participants
3.1.1 Design of the Young Finns study
The sample for the present study was from the Cardiovascular Risk in Young Finns study, or shortly the Young Finns study. The Young Finns study is an ongoing, prospective population-based study, designed to study the risk factors of cardiovascular diseases and their determinants in children and adolescents in Finland (Raitakari et al., 2008; Åkerblom et al., 1991). The study was launched in 1978 and 1979 with two pilot studies, and the first cross-sectional study was conducted in 1980. A total of 4320 participants from six age cohorts (3-, 6-, 9-, 12-, 15-, and 18-year olds) in the population register of the Social Insurance Institution covering the entire geographic area of Finland and nationally representative of various socioeconomic groups were initially invited to the study in 1980. Of the invited, 3596 participants (83.2% response rate) responded in the first study. The follow-ups have been conducted in 1983, 1986, 1989, 1992, 1997, 2001, 2007, and the latest follow-up in 2012.
3.1.2 Sample selection of the present study
The criteria for inclusion in studies I-IV were full-time work, no missing data in the covariates and a maximum of 50% missing data in the study variables. The measurements for study I and II were carried out in 2007, when 2058 participants (57.2% response rate), aged 30 to 45 years, responded to the survey on the psychological variables. In Study I, we included 1370 participants (Mage = 38 years) with adequate information on Five-Factor personality traits and the components of the effort-reward imbalance model. Attrition analyses showed that compared to the excluded, the included participants in Study I were proportionally more often men than women (72.5% vs. 62.5%, p < .001), and that the included participants were slightly older than the excluded participants (37.99 vs. 36.78, p < .001). In comparison with the excluded participants, the included participants had lower scores on neuroticism (2.33 vs. 2.53, p < .001) and higher scores on extraversion (3.46 vs. 3.38, p < .01) in addition
25
to experiencing higher effort (3.25 vs. 3.09, p < .001) and higher reward (3.76 vs. 3.65,
p < .01). Furthermore, the included participants had higher educational level (2.34 vs. 2.25, p = .001) and higher occupational status (2.18 vs. 1.93, p < .001) than the excluded participants.
In Study II, we included 1372 participants (Mage = 38 years) with adequate information on Five-Factor personality traits and the components of the job strain model. The attrition analyses showed that as compared to the excluded participants the included participants in Study II were proportionally more often men (44.8% vs. 33.3%,
p < .001) and the included participants were slightly older than the excluded participants (37.99 vs. 36.80, p < .001). In comparison with the excluded participants, the included participants had lower scores on neuroticism (2.33 vs. 2.54, p < .001) and higher scores on extraversion (3.42 vs. 3.33, p = .001). Furthermore, the included participants had higher educational level (2.33 vs. 2.25, p < .01) and higher occupational status (2.17 vs. 1.95, p < .001) than the excluded participants.
In Study III, measurements were carried out in 2001 (N = 2105, 58.5% response rate) and 2007 when the participants responded to a survey on cynicism and components of the job strain model. Based on inclusion criteria, we included 757 participants (399 women, 53%) in the structural equation models on the relationship between cynicism and job strain (Mage in 2001 = 31.5 years). The attrition analyses showed that there were proportionally more men in the included sample than in the excluded sample (47.3% vs. 41.7%, p = .009) and that the included participants were somewhat older (32.65 vs. 31.02, p < .001) than the excluded. Compared to the excluded, the included participants had higher educational level (2.24 vs. 2.16, p = .001) and occupational status (1.99 vs. 1.87, p < .001) in 2001. In addition, the included participants reported having fewer children in 2007 than the excluded (1.47 vs. 1.65, p = .005) and proportionally fewer of the included had moved during the follow-up compared with the excluded participants (58.6% vs. 65.4%, p = .001).
In Study IV, the data were collected in 2007 and 2012 (N = 1752, 48.7% response rate). The number of participants varied according to the analyses; there were 1228 and 1177 participants in the analyses of invariance for effort and reward, respectively (Mage = 38 years). In the regression analyses on the association of effort-reward imbalance
26
and its components with general stress, there were 1237 (unadjusted model) and 1083 (adjusted for occupational status and educational level) participants.
All participants gave written informed consent, and the study was approved by local ethic committees.
3.2 Measures
The Cronbach’s alphas of the scales used in this study are shown in Table 2.
Table 2. Cronbach’s alphas for the scales in the study
2001 2007 2012 Studies I and II Neuroticism 0.88 Extraversion 0.81 Openness 0.84 Conscientiousness 0.72 Agreeableness 0.80 Study III Cynicism 0.79 0.83
Studies II and III
Demand 0.61 0.63
Control 0.86 0.87
Studies I and IV
Effort 0.76 0.76
27
3.2.1 Five-Factor Model personality traits and cynicism (Studies I, II and III)
In Studies I and II, personality was measured in 2007 using the Finnish version of the NEO-FFI (Neuroticism, Extraversion, Openness, Five-Factor Inventory), which was developed by Rantanen et al. (2007). The Finnish version used in this study contains 60 questions that are based on the questions from the original NEO-FFI (Costa & Mccrae, 1989) as well as on questions from the Finnish version of the NEO-PI (Personality Inventory). The original NEO-PI version was developed by Costa and McCrae (1985) and translated and standardized by Pulver, Allik, Pulkkinen, and Hämäläinen (1995). Some of the questions in the Finnish PI version are modified in order to better correspond to non-Indo-European languages.
Neuroticism was measured with 12 questions (e.g. “I sometimes feel completely worthless”), extraversion with 12 questions (e.g. “I want to be surrounded by other people”), conscientiousness with 12 questions (e.g. “I work hard in order to accomplish my goals”), openness with 12 questions (e.g. “I am intellectually very curious”), and
agreeableness with 12 questions (e.g. “I would rather cooperate than compete with others”). The participants answered the questions on a scale from 1 (does not apply) to 5 (applies well). For those who had less than 50% missing values, a mean score was calculated for each personality trait.
In Study III, cynicism was assessed in 2001 and 2007 with a 7-item cynicism scale derived from the Minnesota Multiphasic Personality Inventory (e.g. “It is safer to trust nobody”) (Comrey, 1957; Comrey, 1958). Cynicism represents the cognitive aspect of hostility (Smith, 1994) and has been identified as the central dimension of hostility (Greenglass & Julkunen, 1989). The answers were given on a scale from 1 (totally disagree) to 5 (totally agree). The longitudinal measurement invariance of the cynicism scale has been shown in the data previously (Hakulinen et al., 2014).
3.2.2 Effort-reward imbalance (Studies I, III and IV)
In Studies I and IV, effort was assessed with the five-item original questionnaire (e.g. “I have constant time pressure due to a heavy work load”) and reward with 11 items from the original scale (Siegrist & Peter, 1996). The reward questionnaire consisted of five items measuring esteem (e.g. “I receive the respect I deserve from my superiors”), four
28
items measuring job promotion (e.g. “My job promotion prospects are poor”), and two items measuring job security (e.g. “My job security is poor”). The responses for both effort and reward were given on a scale from 1 (does not apply) to 5 (does apply).
Mean scores for effort and reward were calculated for those participants who had a maximum of 50% missing values. Effort-reward imbalance was calculated by dividing the mean scores of the effort component by the mean scores of the reward component (Siegrist et al., 2004). A higher value of the continuous effort-reward imbalance variable indicated a higher imbalance (Siegrist et al., 2004). In Study I, a logarithmic transformation was made to the effort-reward imbalance variable to correct for skewness and kurtosis.
In Study IV, general stress in 2012 was used as an outcome criterion for effort-reward imbalance and its components. General stress was measured in 2007 and 2012 by a one-item questionnaire on stress symptoms from the Occupational Stress Questionnaire (“Stress means a situation in which a person feels tense, restless, nervous or anxious or is unable to sleep at night because his/her mind is troubled all the time. Do you feel this kind of stress these days?”) (Elo, Leppänen, Lindström, & Ropponen, 1992). Response was given on a scale from 1 (not at all) to 5 (very much). The validity of the single-item measure has been shown previously (Elo, Leppänen, & Jahkola, 2003).
3.2.3 Job strain (Studies II and III)
In Studies II and III, job demands was measured in 2001 and 2007 using a three-item scale from the Occupational Stress Questionnaire (e.g. “Does your work require you to work fast?”), developed by the Finnish Institute of Occupational Health (Elo et al., 1992). These three items correspond to the items in Karasek’s Job Content Questionnaire (1985). The responses were given on a scale from 1 (never) to 5 (all the time). Job control was in Studies II and III, measured in 2001 and 2007 using 9 items from the Job Content Questionnaire (e.g. “In my work, I am allowed to make a lot of decisions”) (Karasek, 1985). The response scale was from 1 (disagree) to 5 (agree). Mean scores for demand and control were calculated only for those participants with a maximum of 50% missing values.
29
Job strain in 2007 was in Study II calculated using three different formulations, linear term (job demands - job control), quotient term (job demands / job control), and multiplicative interaction term (job demands x job control). The multiplicative interaction term was formed using centralized values for demands and control. When analyzing the multiplicative term’s association, the main effects of job demands and job control are also controlled for. In Study III, job strain in 2001 and 2007 were calculated using the linear term.
3.2.4 Covariates
In addition to age and gender, the covariates in our study were educational level and occupational status, since they are potential confounders (Brunner et al., 2004). Age was entered as a covariate because recent studies have shown that age is associated with both personality and work characteristics (Anusic, Lucas, & Donnellan, 2012; De Lange et al., 2010; Shultz, Wang, Crimmins, & Fisher, 2010; Soto & John, 2012; Specht et al., 2011). Educational level was classified as (1) low (comprehensive school), (2) intermediate (secondary education), or (3) high (academic; graduated from a polytechnic or a university). Occupational status was based on the Central Statistical Office of Finland: (1) manual, (2) lower non manual, and (3) upper non manual. The occupational status of entrepreneurs was determined based on their educational level (low, intermediate, and high education corresponding to manual, lower non-manual, and upper non-manual respectively) and was coded accordingly into occupational status categories. Educational level and occupational status were treated as categorical variables when calculating correlations but dummy-coded in the regression analyses.
To take into account major life events during the follow-up we also included the following covariates in study III: marital status, which was coded (0) single, divorced or widowed and (1) married or co-habiting; number of children (range 0-10); moving to a new address during the follow-up, which was coded (0) no change in address and (1) change in address during the follow-up. The participants’ address information was derived from the Population Registry. In addition, both job strain and cynicism have in several previous studies been shown to predict depressive symptoms later in life (Bonde, 2008; Heponiemi et al., 2006; Nabi et al., 2010; Virtanen et al., 2015). To
30
examine this effect in Study III, we performed additional mediation analyses, with depression in 2007 as an outcome. Depressive symptoms were measured using Beck’s Depression Inventory II (BDI-II) (α = 0.92) (Beck, Steer, & Brown, 1996). The participants answered the 21 statements on a scale from 1 (totally disagree) to 5 (totally agree).
3.3 Statistical analyses
The associations between work characteristics and personality traits in Studies I and II were examined by linear regression analyses. The analyses were performed separately for each Five-Factor trait using two models. In Study I, the first model was adjusted for age and the second model was additionally adjusted for education and occupational status. In Study II, the first model was adjusted for age, gender, education, and occupational status. In the second model all Five-Factor personality traits were entered simultaneously into the analysis. The latter model enabled us to examine the association of a trait with the outcome measures so that the other traits were held constant. The analyses in Study I were performed separately for women and men as there were significant gender interactions for neuroticism in relation to effort (p = .006) and reward (p = .027), for extraversion in relation to reward (p = .001), and for conscientiousness in association with reward (p < .001) and effort-reward imbalance (p = .017). In Study II, gender interactions for neuroticism in relation to job control (p = .002) and job demands (p = .008) were found, but as the results for women and men were very similar on these variables (job control: β = -.240, p < .001 for women and β = -.385, p < .001 for men when adjusted for age; job demands: β = .259, p < .001 for women and β = .119, p < .001 for men when adjusted for age), the genders were combined.
In Study III a cross-lagged structural equation models on the relationship between the latent construct cynicism and the observed variable job strain from both study phases (2001 and 2007) was fitted to the data (Figure 1). The model was adjusted for age, gender, educational level, change in occupational status, change in marital status, having children during the follow up, and moving to another address during the follow-up. The structural equation model allowed for correlation between measurement errors over time. In addition, three items in the cynicism scale had high correlations (r > .50)
31
in addition to being conceptually similar to each other, and their errors were therefore allowed to correlate within time-points. Additional mediation analysis in Study III, for the association between job strain and depression with cynicism as a mediator (N = 750), was conducted using the sgmediation package in Stata, which utilizes Sobel-Goodman’s test of mediation. To account for the effect of the covariates, we first regressed all the covariates of the study on the job strain variable and the depression variable. The mediation analysis was then performed using the residuals of job strain and depression.
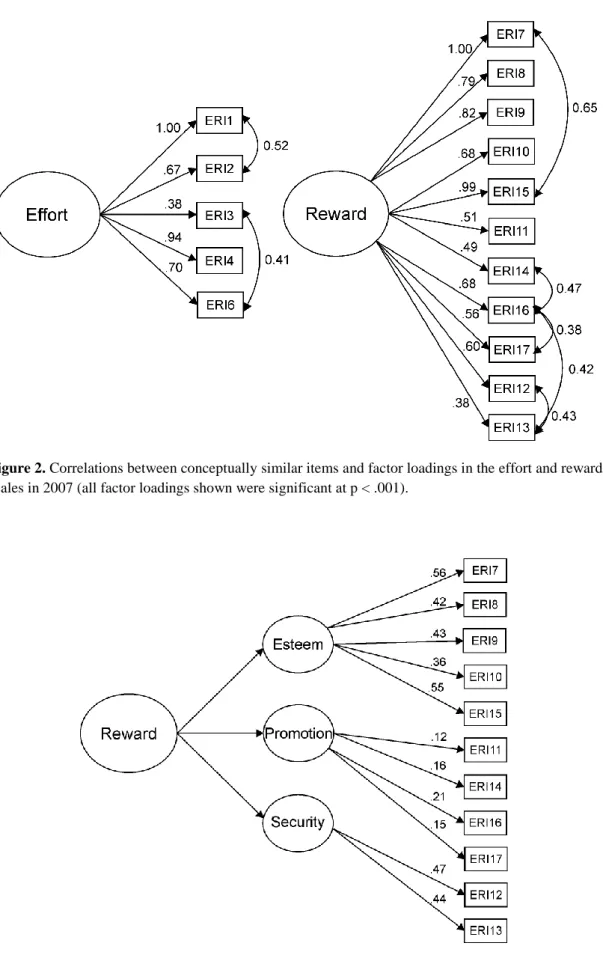
In Study IV, longitudinal measurement invariance was assessed with a series of confirmatory factor analyses differentiating four types of measurement invariance: configural invariance, weak (metric) invariance, strong (scalar) invariance, and strict (residual) variance (see, e.g., Schmitt & Kuljanin, 2008). In order to test the invariance of effort and reward, we tested the two dimensions separately following the theoretical model which states that effort-reward imbalance is a division of effort and reward (Siegrist et al., 2004). Reward was examined in two ways, as a first-order factor (i.e., sum score of all the components) and as a second-order factor consisting of the first-order factors esteem, promotion, and security. Because the same individual items were measured at both time points, their residual variances were allowed to correlate in all models. In the effort scale, two sets of two items had a correlation over 0.4 in addition to being theoretically very similar. Thus, we allowed them to correlate in all models. In the first-order reward scale, 7 items were allowed to correlate as shown in Figure 2. The structural model for reward as a second-order factor is shown in Figure 3. Factor loadings of the effort and reward items in 2007 are shown in Figure 2 (effort and first-order reward) and Figure 3 (second-first-order reward). The items are labelled according to the original labelling (Siegrist et al., 2004). In addition, the associations of effort-reward imbalance and its components in 2007 with general stress in 2012 were examined by linear regression analysis adjusting for age, gender, occupational status, educational level, and general stress at baseline.
In Studies III and IV, model fit was evaluated based on Comparative Fit Index (CFI) and Root Mean Square Error of Approximation (RMSEA) index. RMSEA is not affected by model complexity and CFI is independent of sample size (Cheung & Rensvold, 2002). CFI values above .95 and RMSEA values below .08 indicate good fit.
32
Bayesian Information Criterion (BIC) was in Study IV used to compare models: the lower the BIC, the better the model fit.
33
4 Results
Sample characteristics of the study are shown in Table 3.
4.1 Five-Factor Model personality traits and effort-reward
imbalance (Study I)
In Study I, women were slightly older (p = .049), had higher occupational status (p < .001), and higher educational level (p = .05) than men. Women had higher scores on all personality traits (p < .001) in addition to experiencing fewer possibilities of promotion (p = .046) than men. The results for the linear regression analyses on the association between personality traits and effort-reward imbalance are shown in Table 4. In both genders, high neuroticism was associated with high effort-reward imbalance (β = .416, p
< .001) and high agreeableness with low effort-reward imbalance (β = -.197, p < .001) when age, educational level, and occupational status were controlled for. Among women, conscientiousness was not related to effort-reward imbalance, whereas high conscientiousness was associated with low effort-reward imbalance in men (β = -.155, p
< .001). There were no associations between extraversion or openness and effort-reward imbalance in either gender.
High neuroticism and high extraversion were associated with high effort while high agreeableness was associated with low effort. In addition, high openness and high conscientiousness were associated with high effort in women. As for the reward component, high neuroticism was related to low reward and high extraversion, conscientiousness, and agreeableness were related to high reward. No associations between openness and reward were found in either gender.
34
Table 3. Descriptive statistics of the study variables
Study I Study II Study III Study IV
Women Men Variable Mean / Count SD / % Mean / Count SD / % Mean / Count SD / % Mean / Count SD / % Mean / Count SD / % Demographics Age -07 38.22 4.99 37.68 5.00 37.99 4.99 32.65 4.86 37.64 5.02 Educational level -07 low 25 3.3 28 4.6 53 3.9 29 3.8 88 4.6 intermediate 436 57.6 373 60.8 811 59.1 467 61.7 1127 59.1 high 296 39.1 212 34.6 508 37.0 261 34.5 691 36.3 Occupational status -07 manual 197 26.0 245 40.0 445 32.4 254 33.6 556 33.4 lower non manual 169 22.3 84 13.7 252 18.4 137 18.1 313 18.8 upper non manual 391 51.7 284 46.3 675 49.2 366 48.3 795 47.8 Five-Factor Model traits
Neuroticism 2.45 0.66 2.19 0.62 2.33 0.65 Extraversion 3.52 0.52 3.38 0.53 3.42 0.54 Openness 3.25 0.52 3.08 0.51 3.17 0.52 Conscientiousness 3.78 0.54 3.61 0.55 3.71 0.55 Agreeableness 3.75 0.48 3.56 0.48 3.69 0.49 Cynicism -01 2.69 0.68 Cynicism -07 2.50 0.72
Job strain and its components Job demands -01
Job demands -07 2.93 0.65
Job control -01
Job control -07 3.77 0.69
Job strain (linear term) -01 -0.94 0.90
Job strain (linear term) -07 -0.84 0.85 -0.83 0.85 ERI and its components
Effort -07 3.28 0.83 3.21 0.78 3.21 0.81 Effort -12 3.26 0.81 Reward: esteem -07 3.79 0.73 3.75 0.75 Reward: promotion -07 3.49 0.73 3.57 0.76 Reward: security -07 3.97 0.96 3.98 0.86 Reward -07 3.75 0.61 3.77 0.62 3.70 0.61 Reward -12 3.71 0.64
ERI -07 -0.07a 0.14a -0.08a 0.13a 0.89 0.28
ERI -12 0.91 0.30
General stress -07 2.34 0.95
General stress -12 2.39 0.94
ERI = Effort-reward imbalance
35
Table 4. Standardized linear regression coefficients for the association between Five-factor model traits and effort-reward imbalance and its components
Women (n=757)
Effort Reward Effort-reward
imbalance β ΔR² β ΔR² β ΔR² Neuroticism Model 1 .19*** .04 -.44*** .19 .40*** .16 Model 2 .22*** .05 -.44*** .19 .42*** .17 Extraversion Model 1 .11** .01 .28*** .08 -.05 .00 Model 2 .08* .01 .27*** .07 -.07 .00 Openness Model 1 .13*** .02 .06 .00 .09* .01 Model 2 .09* .01 .05 .00 .06 .00 Conscientiousness Model 1 .10** .01 .20*** .04 -.02 .00 Model 2 .08* .01 .20*** .04 -.03 .00 Agreeableness Model 1 -.03 .00 .28*** .08 -.17*** .03 Model 2 -.07 .00 .28*** .07 -.20*** .04 Men (n=613)
Effort Reward Effort-reward
imbalance β ΔR² β ΔR² β ΔR² Neuroticism Model 1 .05 .00 -.51*** .26 .33*** .11 Model 2 .10* .01 -.49*** .23 .36*** .12 Extraversion Model 1 .22*** .05 .43*** .19 -.06 .00 Model 2 .17*** .03 .40*** .15 -.08 .01 Openness Model 1 .11** .01 .12** .02 .03 .00 Model 2 .05 .00 .05 .00 .02 .00 Conscientiousness Model 1 .08* .01 .41*** .17 -.15*** .02 Model 2 .07 .01 .40*** .17 -.16*** .02 Agreeableness Model 1 -.09* .01 .32*** .10 -.26*** .07 Model 2 -.14*** .02 .29*** .08 -.28*** .07
* Significant at the 0.05 level (two-tailed) Model 1 - adjusted for age ** Significant at the 0.01 level (two-tailed) Model 2 - adjusted for age, educational level, and
occupational status *** Significant at the 0.001 level (two-tailed)