Strathprints Institutional Repository
Dalgic, Yalcin and Dinwoodie, Iain Allan and Lazakis, Iraklis and
McMillan, David and Revie, Matthew (2014) Optimum CTV fleet selection for offshore wind farm O&M activities. In: ESREL 2014, 2014-09-14 - 2014-09-18, Poland. ,
This version is available at http://strathprints.strath.ac.uk/49631/
Strathprints is designed to allow users to access the research output of the University of Strathclyde. Unless otherwise explicitly stated on the manuscript, Copyright © and Moral Rights for the papers on this site are retained by the individual authors and/or other copyright owners. Please check the manuscript for details of any other licences that may have been applied. You may not engage in further distribution of the material for any profitmaking activities or any commercial gain. You may freely distribute both the url (http://strathprints.strath.ac.uk/) and the content of this paper for research or private study, educational, or not-for-profit purposes without prior permission or charge.
Any correspondence concerning this service should be sent to Strathprints administrator: strathprints@strath.ac.uk
ABSTRACT
Operation and Maintenance (O&M) contributes a sig-nificant share of the expenses during the lifetime of offshore wind farms. When compared to onshore wind, O&M costs are increased, due to the use of spe-cialised vessels, shorter weather windows and chal-lenging environmental conditions. Furthermore, in-creased frequency of failures, longer downtime and limited accessibility create uncertainties in the plan-ning stage of the O&M tasks. In order to decrease the cost of power generation and increase the competi-tiveness of offshore wind industry against other alter-native energy sectors, it is essential to keep the costs of the vessel fleet used for O&M tasks at minimum level while providing sufficient support to sustain power generation. In order to address these issues, the focus of this paper is to provide decision support for the selection of a Crew Transfer Vessel (CTV) fleet for the offshore wind farm maintenance operations. This is achieved through analyses of environmental conditions, investigation of failures, and assessment of vessel operations. The developed methodology and analysis enable operators to decide the specification of CTVs which will bring the optimum financial ben-efit, considering both the enhancement of the offshore wind farm power generation as well as the minimisa-tion of the total O&M cost.
Optimum CTV Fleet Selection for Offshore Wind Farm O&M Activities
Yalcin Dalgic
Department of Naval Architecture, Ocean and Marine Engineering, University of Strathclyde, Glasgow, UK
Iain Dinwoodie
Wind Energy CDT, University of Strathclyde, Glasgow, UK
Iraklis Lazakis
Department of Naval Architecture, Ocean and Marine Engineering, University of Strathclyde, Glasgow, UK
David McMillan
Institute for Energy & Environment, University of Strathclyde, Glasgow, UK
Matthew Revie
1. INTRODCUTION
Offshore wind is becoming increasingly attractive to developers due to a number of advantages over the onshore environment. These include the availability of offshore areas in which major projects can be de-veloped, the lack of limitations associated with the visual impact and noise of the wind turbines, higher wind speeds, and the lower turbulence levels in the offshore environment. Contrary to these advantages there are a number of increased challenges when moving offshore; wind turbines are situated in the highly corrosive sea environment, and subject to loads that are not often experienced onshore; there-fore offshore wind farm operators suffer from greater maintenance issues. Harsher wind and wave condi-tions limit the operability of these vessels and even-tually the accessibility of offshore wind farms. Cur-rently, onshore wind energy costs £74/MWh, alterna-tively offshore wind energy costs £150/MWh, which the industry has to commit to bringing the cost of off-shore wind down to £100/MWh in order to sustain the competiveness and the development in the offshore industry (WindPower Offshore, 2012).
According to a report prepared by WindPower Offshore (2013), the proportion of the CTVs to the number of vessels in the entire offshore wind market is 40.6%, while cabling vessels, jack-up vessels, heavy lift vessels and other vessel account for 21.3%, 16%, 12%, and 10%, respectively. Despite the domi-nance of the CTVs, there is no regulation specifically for offshore wind farm service vessels (WorldWind Technology, 2013). Technicians performing offshore maintenance are classed as passengers, and therefore if there are more than 12 technicians on-board, this
specific vessel is classified as passenger vessel, which introduces extensive safety legislation and decrease operational flexibility. Furthermore, weather condi-tions restrict access of the CTVs; larger vessel may have better operational capabilities but charter rates escalate quickly. In this respect, it is essential to use the optimal vessels for the jobs involved, but also charter them at the right time at the minimal price.
It has been identified that the minimisation of the vessel costs has significant potential to reduce the overall Operation and Maintenance (O&M) expendi-ture. Although, CTVs are highly utilised within an offshore project lifecycle, the influence of CTVs on the entire O&M lifecycle cost has not been consid-ered thoroughly. Considering current offshore wind O&M models, it has been identified that the CTV re-lated operations are generally neglected or modelled in a crude way. As such, the focus of this research is the investigation of optimum CTV fleet size and the examination of different CTV types which bring eco-nomic and operational benefits. Considering different climate parameters, failure characteristics of the tur-bine components, and the operational characteristic of the CTVs, an exhaustive model is presented which provides support for the long term offshore wind O&M planning.
The paper is structured as follows; in Section 2, the common procedures, aspects and issues associated with maintenance of offshore wind farms are pre-sented. Through the observations in that section, a modelling methodology is specified in Section 3. A case study is presented in Section 4 in order to vali-date the proposed model. In Section 5, the results of the case study are evaluated. Final recommendations are provided in Section 6.
ABSTRACT: The focus of this paper is to provide decision support for the selection of a Crew Transfer Vessel (CTV) fleet for the offshore wind farm maintenance operations. This is achieved through analyses of environ-mental conditions, investigation of failures, and assessment of vessel operations. The developed methodology and analysis enable operators to decide the specification of CTVs which will bring the optimum financial ben-efit, considering both the enhancement of the offshore wind farm power generation as well as the minimisation of the total O&M cost.
Optimum CTV Fleet Selection for Offshore Wind Farm O&M Activities
Yalcin Dalgic
Department of Naval Architecture, Ocean and Marine Engineering, University of Strathclyde, Glasgow, UK
Iain Dinwoodie
Wind Energy CDT, University of Strathclyde, Glasgow, UK
Iraklis Lazakis
Department of Naval Architecture, Ocean and Marine Engineering, University of Strathclyde, Glasgow, UK
David McMillan
Institute for Energy & Environment, University of Strathclyde, Glasgow, UK
Matthew Revie
2. LITERATURE REVIEW
2.1. Economic assessment
O&M activities represent a significant share of the expenses during the lifecycle of the projects (Kaldel-lis and Kapsali, 2013). O&M costs can be considered to comprise of labour costs, material costs, access vessels & lifting vessels costs and potential revenue losses. In this respect, it is important to identify the critical elements that can significantly reduce overall costs.
Previous studies have identified that the develop-ment of new O&M vessels is particularly important; since the costs for vessels make up 73% of the total O&M costs (Fingersh et al., 2006, Junginger et al., 2004, Krohn et al., 2009, Lazakis et al., 2013). Van Bussel and Zaaijer (2001) showed that irrespective of wind turbine design, the cost of lifting operations by using a vessel accounted for more than 50% of the overall O&M costs. Dinwoodie et al. (2013) evi-denced that the proportion of vessel associated costs to the total O&M costs is the largest; therefore opti-misation of vessel costs is the key to minimise the overall project costs; considering the fact that eco-nomic benefit from producing more energy by in-creasing the availability does not always leads to higher profits since it may not compensate the in-crease in the total O&M costs (Santos et al., 2014).
2.2.O&M activities and available vessels
Minor failures occur frequently but lead to shorter downtimes and the cost of repairs are cheaper; how-ever, numerous minor failures have the potential to contribute significant downtime. In this respect, Faulstich et al. (2011) studied the failure rates of wind turbine components identifying that the minor fail-ures account for 75% of all turbine failfail-ures. In the
case of minor failures such as; electrical system, elec-tronic control, sensor and hydraulic system failures, vessels for minor maintenance are utilised in the pair operations. CTVs are used for wind turbine re-pairs, which do not require heavy equipment transport or heavy crane operations. CTVs can be equipped with dynamic positioning and motion-compensating gangways in order to improve the operability and ac-cessibility but these technologies currently have a high associated cost.
Monohull boats, small catamaran vessels and Small Waterplane Area Twin Hull (SWATH) vessels are generally utilised in minor maintenance opera-tions, which allow operators to keep the cost of minor maintenance operations at acceptable levels. Catama-ran configurations are often the preferred choice but operations are restricted to relatively low wave heights (Tavner, 2012). The most distinctive charac-teristics of these vessels are high speed, small deck spaces, small crane capacities and safe access to wind turbine structures that will allow operators to take quick actions in case of urgent repairs.
3. METHODOLOGY
The developed methodology is illustrated in Figure 1. The overall model consist of four blocks. The inputs of the model are introduced in the Inputs block. The inputs are processed in the Data Process block and then considered for the Simulations block. In the Sim-ulations block, processed climate series, forecasted failure behaviours and vessel accessibility and opera-bility values are synthesised and OPEX calculations are performed. The cost elements which influence offshore O&M activities are then employed along with these results to support the decision making. Fi-nal decision choices are determined not only from a power production point of view, but also in terms of cost, revenue and profit.
3.1.Inputs block
Wind speed, wave height and wave period observa-tions constitute the climate parameters. Whilst all the climate parameters influence vessel operations, wind speed has also impact on power generation. Failure rates and repair times denote the sequence of minor failures and the time required to repair these failures. The repair time values are the periods associated with actual repairs, excluding the reaction time. Wind farm related attributes represent the number of turbines in the farm, individual turbine capacity and average dis-tance from O&M port. Vessel specifications and fleet size denote the number of vessels in the fleet; also structural and mechanical properties of these vessels. Cost elements symbolise daily charter cost of vessels, fuel cost, electricity price, and technician annual sal-aries.
3.2.Data process block
Data process block where the datasets from inputs block will be organised and evaluated. In this respect, climate dataset generation, failure analyses, and ac-cessibility & operability calculations are performed prior to the simulations and OPEX calculations. In the following sections, these analyses will be explained in details.
3.2.1. Climate dataset generation
The climate dataset for simulation comprises of a syn-thetic wind speed, significant wave height and wave period time series. These are generated using a Mul-tivariate Auto-Regressive (MAR) model, shown in Equation 1, normalised by the mean of the data where is the simulated wind speed at time-step , n is the number of variables, is a variable state vector, is a matrix of the MAR model coefficients and is a noise vector with mean zero and covari-ance matrix of the data, order p (Box and Jenkins, 1970).
(1) In order to apply Equation 1 to a wind and wave data set a transformation must be applied in order that the data set mean and variance are stationary and ap-proximate a Gaussian distribution. It is necessary to apply the Box-Cox transformation described in Equa-tions 2 and 3, where is the transformed series, is significant wave height and is the transform co-efficient. A Fourier series fit of the seasonality ob-served in the transformed data can then be removed (Soares et al., 1996). The transfer coefficient value that minimises skewness is identified and used to give the closest approximation of a normal data set.
(2)
(3)
Having transformed the data, Equation 1 can be applied to both wind and wave data. The determina-tion of MAR coefficients and model generadetermina-tion is im-plemented using the arfit algorithm in MATLAB (Schneider and Neumaier, 2001). Order is chosen by optimising Schwarz's Bayesian Criterion and coeffi-cients are estimated using a stepwise least squares es-timation process. In order to preserve the variability in performance driven by climate, a unique synthetic time series is generated for each simulation. Using the described methodology the key characteristics of mean and variance as well as annual distribution, ac-cess window duration periods and inter-time step cor-relation are preserved. In addition, corcor-relation be-tween different climate parameters are preserved.
3.2.2. Failure analyses
The wind turbine system failure process is imple-mented using the methodology developed in (Billin-ton, 1970). The wind turbine is characterised as a se-ries of subsystems that can each exist in a discrete state during each simulation time-step. The probabil-ity of moving from an operating state to a failed or reduced operating state is governed by the hazard rate h t , which is defined as the probability of observing a failure in a specified time interval. The hazard rate through the life cycle can be represented using the Weibull function shown in Equation 4, where the shape parameter determines the gradient of the haz-ard rate and scale parameter corresponds to the fre-quency of observed failures. This methodology al-lows for changing hazard function throughout the simulated life time. As a greater understanding of off-shore wind turbine failure behaviour is developed through operator experience it will become possible to represent design life changes or impacts of climate and maintenance.
(4)
At each time-step a uniformly distributed random number, , in the interval 0 to 1 is generated and used to determine if a failure has occurred using the criteria in Equation 5. Failure transition if:
(5)
Repair is then simulated based on the climate time series. If a turbine is in a failed state it will return to a working state when sufficient access time has been observed or when a series of repair actions have been performed corresponding to a completed mainte-nance action.
3.2.3. Accessibility and operability
CTVs operate in waves; through analysing wind speed and significant wave height values, it is possi-ble to identify the time-steps/days in which the CTVs can operate or stay in the specified port. In the pro-posed methodology, the transit time delays due to speed reduction under different climate conditions are considered by also analysing the wave period values. In this context, accessibility and operability analyses are constituted from 5 sequential steps;
Calculation of total calm water resistance
Calculation of additional wave resistance
Calculation of total resistance
Calculation of speed loss in wavy sea
Calculation of transit time
The total calm water resistance RT-Calm of the CTVs can be calculated from the Equation 6 and 7;
PE= PB / (6)
RT-Calm = PE / V (7)
where PB = break power; PE = effective power; = total efficiency of the vessel; and V = vessel speed. In the Equations above, effective power is the necessary power to move the vessel through water, and break power is the power output of the engine without power loss caused by gears, transmissions or friction force.
In heavy seas, waves cause additional resistance on the vessel hull. The most accurate method to cal-culate additional resistance due to waves is model testing; alternatively, Jinkine and Ferdinande (1973) developed an empirical formulation for predicting the added resistance for fast cargo ships in head seas. The dimensional added resistance is related to the non-di-mensional added resistance coefficient by Equation 8,
(8)
where is non-dimensional added resistant coef-ficient, is non-dimensional added resistant coef-ficient, and is wave amplitude; is density of wa-ter, is acceleration due to gravity, breadth of CTV, and is length of CTV. The total resistance of the vessel, is the summation of calm water re-sistance and added rere-sistance due to waves in the ocean (Equation 9).
(9) Due to the fact that time-step approach is utilised in the simulations, wave height and wave period val-ues in each time-step will be different which creates variation in added resistance and eventually total re-sistance of the CTVs. Therefore, the equations above have to be applied to every time-step of the simula-tions.
Whilst a CTV is traveling in a wavy sea, skipper can keep the power constant and decrease the speed or keep the speed constant and increase the power. In this study the power and thrust of the CTVs will be kept constant and speed will change with the influ-ence of added resistance. In order to calculate the speed loss in each time-step under the condition of constant power and thrust, Equations 10 and 11 de-rived by Berlekom et al. (1974) and Berlekom (1981) can be utilised.
(10)
(11) where = Added resistance at time-step ; = Total resistance at time-step , = Operational speed of CTV; = Speed loss at time-step i; = Achiev-able speed at time-step .
Transit time is calculated through adding the indi-vidual distances that are logged in each time-step, which are the multiplication of achievable speed at time-step and interval (Equation 12). When the sum-mation of these distances become equal to the total distance between port and offshore wind farm, it is accepted that the vessel has approached to the wind farm site (Equation 13).
(12)
(13)
3.3.Simulations block
The simulations are performed through synthesising all the processed climate, failure and operational in-formation received from data process block. At the first stage, the failure types and time-steps are identi-fied and assigned to the speciidenti-fied turbines. In the re-pair strategy, climate parameters and accessibility calculations are considered together. Following the failure identification and allocation, accessible & op-erable days are identified. Due to the fact that current operational practices are on shift bases, the same ap-proach is adapted in this study; therefore working hours are limited by a specified shift duration. How-ever, climate parameters may not allow CTVs to leave the port or transport technicians to wind farm within specified shift or allow only a limited period in the shift. In this respect, the maximum weather window is calculated in the shift in order to identify the maximum period that the technicians can work.
Additionally, there may be cases that the time spent on the journey might be substantially longer. Therefore, a ‘minimum working limit’ has to be de-fined for making a working shift acceptable and cost-effective. The ‘minimum working limit’ will create
an extra constraint for the O&M activities. If the max-imum weather window is shorter than the minmax-imum working hour, this specific day is considered as inac-cessible day.
The repair simulations are performed on daily ba-ses. After identifying the day that the repair can be performed, a CTV is allocated to the failed turbine. The repairs are cumulative, which means if the repair cannot be completed within a single shift, the remain-ing part can be completed in the followremain-ing accessible day. When a repair day is completed, the following day is simulated. If there is failure in that day, the same approach is implemented. Otherwise, the fol-lowing day is simulated. The simulations are com-pleted when the days simulated reaches the length of the simulations.
3.4.Outputs block
Outputs of this study are the average MTTR for all turbine components, average availability, the ratio of completed scheduled maintenance, power produced, power loss, revenue loss, and profit values due to the change of fleet size and CTV capabilities. These out-puts provide sufficient information in order to assess the influences of changes and bring a solution for the fleet optimisation problem. Through considering all the parameters, the optimal fleet size and CTV type are decided. Potential alternatives, such as increase in crew size, improvement in failure characteristics, can be investigated following the decision of fleet size and CTV type.
4. CASE STUDY
In order to validate the proposed model, a case study which captures the influence of fleet size variation on MTTR, power production, availability, and profit val-ues, was performed. In the simulations, two different CTVs were examined, which provide not only the flexibility of comparison between the size of fleets, but also the selection of CTVs which brings the most economic advantage. Table 1Table 1 shows the spec-ifications of CTVs; CTV-1 has better capability than CTV-2, on the other hand daily charter rate and fuel consumption values of CTV-2 are less than the values associated with CTV-1.
Table 2 and Table 3 represent the failure rates, cost of repairs, required time and the technicians that will be allocated to the turbines. These values are adapted from the reports prepared by Poore and Walford (2008) a Wilkinson and Hendriks (2007). At this stage, it is important to highlight that the knowledge related to failure rates of offshore wind turbines are very limited, therefore, it will be possible to utilise more accurate offshore wind failure rates in the future using the developed modelling framework.
Table 1. CTV specifications
CTV-1 CTV-2
Vessel Type Catamaran Catamaran
Length (m) 26 19.1 Demi-hull Breadth (m) 3 2 Draught (m) 2.05 1.3 Displacement (tons) 145.7 50 Speed (knots) 24 24 Installed Power (kW) 1790 1418 Op. Wave Height (m) 1.5 1.25 Op. Wind Speed (m/s) 25 25 Fuel Cons. (l/h) 446 316 Charter rate (£/day) 3250 2000 Technician capacity 12 12
Table 2. Failure rates and repair costs of components
No Failure Types Failure Rate Repair Cost
times/year £
1 Manual Restart 8.79 -
2 Blade 1.48 20300
3 Pitch System 0.08 7150
4 Hub 0.185 4300
5 Main Shaft & Bearings 0.185 14000
6 Gearbox 0.08 3250 7 High-speed Shaft 0.19 3250 8 Mechanical Brake 0.04 2500 9 Generator 0.08 12000 10 Control System 0.24 4150 11 Yaw System 0.12 10800 12 Hydraulic Services 0.12 1300 13 Power Electrics 0.24 4150 14 Transformer 0.02 15400 15 Tower 0.19 5000
Table 3. Required time and technicians for repairs
No Failure Category Repair Time Required Tech.
hours
1 Manual Restart 1 2
2 Blade 8 2
3 Pitch System 5 2
4 Hub 4 2
5 Main Shaft & Bearings 4 2
6 Gearbox 4 2 7 High-speed Shaft 3 2 8 Mechanical Brake 2 2 9 Generator 4 2 10 Control System 4 2 11 Yaw System 3 2 12 Hydraulic Services 3 2 13 Power Electrics 3 2 14 Transformer 5 2 15 Tower 8 2
Table 4 represents the additional attributes re-quired to run the simulations. Due to the fact, the gen-erated climate datasets show variations, 100 different climate datasets are generated prior to the simula-tions, and these generated climate dataset are utilised for each fleet size. Therefore, the climate influence is captured by running 100 simulations for each fleet size, on the other hand consistency is secured by uti-lising the same climate datasets for each fleet size.
Table 4. Additional attributes
No Failure Category
1 Number of simulations 100 2 Number of years 20
4 Number of turbines 100 x 5MW
6 Scheduled maintenance 100 man-hour/year/turbine 7 Electricity price 0.137 £/kWh
8 Staff cost 60000 £/year 9 Fuel cost 0.83 £/litre 10 Distance to shore 20 nmiles 11 Minimum working 2 hours 12 Daily shift 8am-8pm
5. RESULTS
This section presents the simulated results for the specified case studies. Figure 2 demonstrates the an-nual availability simulated across different CTV con-figurations. There is an inherent inter-annual variabil-ity driven principally by the climate and failure rates which both have significant variability between years. It can be seen that increasing the number and capabil-ity of the CTV fleet reduces the degree to which inter annual variation occurs as well as improving average availability. This result is explained due to the in-creased operational threshold reducing the observed inaccessibility and consequently reducing uncertainty in performance from climate. Increasing the access threshold of CTV fleet further will reduce the varia-bility from climate further but there are practical tech-nology limits and associated costs with improved ves-sel design.
Figure 2. Annual availability distributions
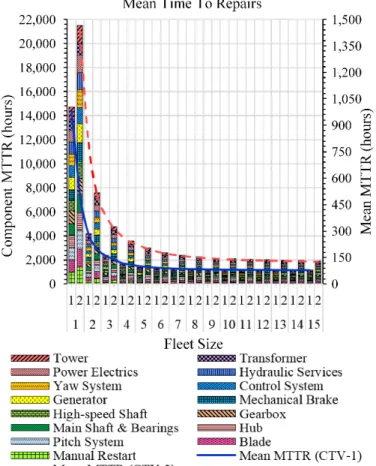
Figure 3 shows the downtimes of offshore wind tur-bine components due to minor failures under the in-fluence of fleet size increase. Whilst the left vertical axis represents the component MTTR values, the right vertical axis represent the mean MTTR values for the entire offshore wind turbine system. The val-ues on the horizontal axis is the size of fleet and the values ‘1’ and ‘2’ denote the category of CTV in the fleet. Due to the fact that increase in the fleet size pro-vides more flexibility in the O&M activities, the re-action times to failures and eventually the downtimes of the minor failures decrease substantially. As
ex-plained in the previous section, the operational capa-bilities of CTV-2 are lower than CTV-1; therefore, MTTR values are higher for the fleets which consist of CTV-2. Additionally, the improvement on MTTR values decreases with the increase in the size of fleet for both CTV categories.
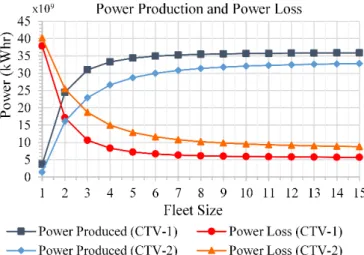
In contrast to the MTTR values, the power produc-tion values escalate with the increase of fleet size re-gardless of CTV category (Figure 4). Due to the fact that maximum theoretical power that can be gener-ated is unrelgener-ated to the fleet size or CTV capabilities, the power loss values decrease proportional to the in-crease in power production. The reason that all the graphs in Figure 4 become approximately straight af-ter a critical fleet size is the maximum accessibility has been achieved by the specified vessels.
Wind farm availability and completed scheduled maintenance values are shown in Figure 5. Availabil-ity values show similar trends to the power produc-tion values and increase when the fleet size becomes larger. For all fleet compositions, the availability val-ues are lower for the fleets with CTV-2. The reason is the number of accessible days within a year for CTV-2 is lower than the number of accessible days for CTV-1. Therefore, it will not be possible to reach equivalent productivity by chartering a larger number of CTV-2s. With regard to completed scheduled maintenance values, it can be seen that scheduled maintenance tasks can be completed within simula-tion period in both cases; however the size of the CTV-2 fleet has to be larger to achieve comparable performance with the CTV-1 fleet.
Figure 3. MTTR values for different fleet compositions
Figure 4. Power produced and power loss
Figure 5. Availability and completed scheduled maintenance
When the distribution of costs that contribute to to-tal O&M cost is analysed, the transport cost which is the summation of fuel cost and daily charter rate cost, dominates the total O&M cost as shown in Figure 6. The vertical axis represents the costs associated with each cost attribute; the values on the horizontal axis is the size of fleet and the values ‘1’ and ‘2’ denote the category of CTV in the fleet. At this stage, it is important to highlight that the O&M tasks in this study are the repairs due to minor failures of the tur-bine components; therefore the values in Figure 6 rep-resent the costs associated with minor O&M activi-ties. The staff cost is directly proportional to the fleet size; therefore the staff cost increases £720,000/per-year when a new CTV is added to the existing fleet. The red and blue lines show the total O&M cost which is always higher for the CTV-1 fleets than CTV-2 fleets due to higher daily charter rate and fuel consumption of CTV-1.
Considering these results, the escalation of fleet size brings a reduction in MTTR and lost revenue, in-creased power production, availability, and comple-tion of scheduled maintenance values; however, there is a corresponding increase in all aspects of the costs. In this context, the optimum size of the fleet has to be defined through assessing the revenue loss and profit values; because the revenue and profit values reflect
the level of economic benefits achieved through in-creasing the fleet size. In this respect, Figure 7 shows how these features are formed. For the CTV-1 fleets, financial loss decreases and profit increases until fleet size reaches a fleet of 7 vessels. If the CTV-1 fleet size becomes larger than 7, the profit starts to de-crease and therefore revenue loss inde-creases. This is because, extra costs cannot be covered anymore by the production increase. From the CTV-2 point of view, optimum fleet size is 10 vessels. As for the CTV-1 fleet, revenue loss decreases and profit in-creases until fleet size reaches 10. Therefore, the op-timum fleet sizes for CTV-1 is 7, for CTV-2 is 10.
When the simulation results are compared between CTV categories, CTV-1 clearly shows both opera-tional and economic benefits. Although, CTV-2 has lower fuel consumption and daily charter rate, the number of days accessible by CTV-2 is significantly low; thus the utilisation of CTV-2 is low. This situa-tion causes a substantial decrease in the availability and profit values.
Figure 6. O&M cost distribution
6. FINAL DISCUSSION AND CONCLUSION This article relates to the current issues of the offshore wind O&M cost optimisation; considering the influ-ence of varying fleet sizes and CTV characteristics. A model was introduced with the objective of identify-ing the most cost effective CTV and the optimum fleet which brings economic and operational benefits. In order to assess the accuracy of the proposed model and to generate realistic results, the model was ap-plied to a case study wind farm.
The results indicate that a CTV with better capa-bility brings great economic and operational ad-vantages, even though that CTV has higher daily OPEX cost. It is also identified that the profit in-creases and the financial loss dein-creases until the fleet size is reached an optimum level. On the other hand, the fleets that are larger than optimum result in an in-crease in the total O&M cost which cannot be com-pensated by the economic benefit from producing more energy.
7. REFERENCES
BERLEKOM, W. B. V. (1981) Wind Forces on Modern Ship Forms – Effects on Performance. Transactions of the North East Institute of Engineers and Shipbuilders, 97.
BERLEKOM, W. B. V., TRAGARDH, P. & DELLHAG, A. (1974) Large tankers - Wind coefficients and speed loss due to wind and sea, Royal Institution of Naval Architects.
BILLINTON, R. (1970) Power system reliability evaluation, New York, Gordon and Breach.
BOX, G. E. P. & JENKINS, G. M. (1970) Time series analysis : forecasting and control, San Francisco ; London, Holden-Day ; [Maidenhead] : Distributed by McGraw-Hill.
DINWOODIE, I., MCMILLAN, D., REVIE, M., LAZAKIS, I. & DALGIC, Y. (2013) Development of a Combined Operational and Strategic Decision Support Model for Offshore Wind. Energy Procedia, 35, 157-166.
FAULSTICH, S., HAHN, B. & TAVNER, P. J. (2011) Wind turbine downtime and its importance for offshore deployment. Wind Energy, 14, 327-337.
FINGERSH, L., HAND, M. & LAXSON, A. (2006) Wind Turbine Design Cost and Scaling Model. National Renewable Energy Laboratory.
JINKINE, V. & FERDINANDE, V. (1973) A method for predicting the added resistance of fast cargo ships in head waves. International Ship Building Progress, 21.
JUNGINGER, M., FAAIJ, A. & TURKENBURG, W. C. (2004) Cost reduction prospects for the offshore
wind energy sector. Wind Engineering, 28,
97-118.
KALDELLIS, J. K. & KAPSALI, M. (2013) Shifting towards offshore wind energy-Recent activity and future development. Energy Policy, 53, 136-148.
KROHN, S., MORTHORST, P.-E. & AWERBUCH, S. (2009) The Economics of Wind Energy. Brussels, EWEA.
LAZAKIS, I., TURAN, O. & ROSENDAHL, T. (2013) Modelling of vessel and equipment cost for the maintenance activities of an offshore tidal energy array. Proceedings of the PRADS2013, 20-25 October 2013. Changwon City, Korea.
POORE, R. & WALFORD, C. (2008) Development of an Operations and Maintenance Cost Model to Identify Cost of Energy Savings for Low Wind Speed Turbines. Washington, USA, National Renewable Energy Laboratory.
SANTOS, F. P., TEIXEIRA, A. P. & SOARES, C. G. (2014) Influence of logistic strategies on the availability and maintenance costs of an offshore wind turbine. Safety, Reliability and Risk Analysis: Beyond the Horizon, 29 September-2 October.
SCHNEIDER, T. & NEUMAIER, A. (2001) Algorithm 808: ARfit—a matlab package for the estimation of parameters and eigenmodes of multivariate autoregressive models. ACM Transactions on Mathematical Software 27, 58-65.
SOARES, C. G., FERREIRA, A. M. & CUNHA, C. (1996) Linear models of the time series of significant wave height on the Southwest Coast of Portugal. Coastal Engineering, 29, 149-167.
TAVNER, P. (2012) Offshore Wind Turbines: Reliability, availability and maintenance, London, UK, The Institution of Engineering and Technology. VAN BUSSEL, G. J. W. & ZAAIJER, M. B. (2001)
Reliability, availability and maintenance aspects of large-scale offshore wind farms, a concepts study. Proceedings of MAREC Marine Renewable Energies Conference, March 2001. Newcastle, UK.
WILKINSON, M. & HENDRIKS, B. (2007) Report on Wind Turbine Reliability Profiles. ReliaWind Project.
WINDPOWER OFFSHORE (2012) Global Offshore, Special Report. London, UK.
WINDPOWER OFFSHORE (2013) Vessels and Access, Special Report. London, UK.
WORLDWIND TECHNOLOGY (2013) Steering a course through offshore wind energy regulations. London, UK.