Visual P3 in Female Alcoholics
V. Radha Prabhu, Bernice Porjesz, David B. Chorlian, Kongming Wang, Arthur Stimus, and Henri Begleiter
Background:The P300 (P3) component of the event related potential has been established as a sensitive risk marker of vulnerability to alcoholism. Most alcoholism studies have focused on men; recent studies indicate that women are equally vulnerable to developing alcoholism.
Methods:Visual P3 recorded from 31 electrode positions was evaluated in 44 alcoholic and 60 control women, 24-50 years of age. P3 amplitudes and latencies of the two groups were statistically compared using Analysis of Variance; source localization of surface amplitude values from each group were plotted using a low-resolution brain electromagnetic tomography.
Results:The results indicated that alcoholic women had significantly smaller P3 amplitudes in the frontal and central regions compared with controls. Source localization showed lowered activation in alcoholic women in right dorso-lateral prefrontal cortex and the ventro-medial fronto-central regions.
Conclusions:The results suggest that P3 is an equally sensitive endophenotypic marker of vulnerability to alcoholism in women. The findings are discussed in terms of functional and physiologic significance of the P3 amplitude in alcoholic women and its relationship to drinking behaviors.
Key Words:ERP, P300, Alcoholics, Source Localization, LORETA.
T
HE P3 COMPONENT of the event related potential (ERP) has been established as a sensitive risk marker of vulnerability to alcoholism (Begleiter and Porjesz, 1999; Begleiter et al. 1984; Polich et al. 1994; Porjesz et al. 1998). The majority of P3 studies have evaluated male alcoholics and high-risk individuals, because the prevalence of alco-holism is higher in men than in women (Grant, 1996). However, over the last few years, the incidence of alcohol-ism in women has been increasing and it is estimated that approximately 4.6 million women in the United States abuse alcohol (Williams et al., 1989) and that they form one third of the total alcoholic population. Although the risk of developing alcoholism is estimated to be greater in men than women, women have more adverse consequences of alcohol use, higher blood-alcohol concentrations, and greater alcohol related organ damage (Urbano-Marquez et al. 1995; Zhang et al. 1999).Family, adoption and twin studies that highlight genetic contributions to alcoholism in men do not strongly support the same in women (McGue and Slutske, 1996). A possible reason for this discrepancy could be the inclusion of fewer female subjects and female probands in the sample. There is some evidence to suggest that the prevalence of alcohol-ism is higher in daughters of alcoholic mothers than
alco-holic fathers (Cotton, 1979). In family studies that include both male and female probands, both genders were found to equally transmit alcoholic tendencies to their offspring of both genders (McGue and Slutske, 1996). A recent twin-study by Prescott et al. (1999) evaluated a large sam-ple of 5091 male and 4168 female twins selected from the Virginia Twin Registry. Substantial genetic influences were present both in men (51 to 56%) and in women (55 to 66%), suggesting that both genders are equally vulnerable to the genetic aspects of alcoholism.
In alcoholic men, decrements in P3 amplitude, especially on visual tasks, have been reported in several studies (Co-hen et al. 1995; Emmerson et al. 1987; Patterson et al. 1987; Pfefferbaum et al. 1991; Porjesz et al. 1980,1987). However, few studies have evaluated P3 in alcoholic women. Parsons et al. (1990) compared 67 female alcoholics and 49 female controls using both auditory and visual paradigms. No sig-nificant differences in P3 amplitude or latency were present, even when family history of alcoholism was con-sidered. Hill and Steinhauer (1993a) evaluated 25 alcoholic women, 31 nonalcoholic sisters of these women and 30 control women on visual and auditory tasks. Significantly reduced P3 amplitude on both tasks was found in alcoholic women compared with controls and unaffected siblings. Findings from the ongoing national multi-centered study (Collaborative Studies on Genetics of Alcoholism -COGA) indicate that female alcoholic probands manifest decreased P3 amplitudes compared with controls, but not to the same extent as males (Porjesz et al. 1998). In a recent study, Hill et al. (1999) studied 121 adult alcoholics (from high density families) and 68 low risk controls on both auditory and visual tasks. The only significant difference was found between women alcoholics who had comorbid From the Department of Psychiatry, State University of New York, Health
Science Center at Brooklyn, Brooklyn, New York.
Received for publication September 27, 2000; accepted January 25, 2001. Supported by NIH Grants: AA05524 and AA02686 (HB, BP). Reprint requests: Dr. Bernice Porjesz, Department of Psychiatry, State University of New York, Health Science Center at Brooklyn, 450 Clarkson Avenue, Box 1203, Brooklyn, NY 11203; Fax: 718-270-4081; E-mail: bp@cns.hscbklyn.edu
Copyright © 2001 by the Research Society on Alcoholism.
depression when compared with control women. A similar analysis in male alcoholics with depression was not per-formed due to insufficient sample. The authors suggest that P3 differences between alcoholics and controls could be a reflection of comorbid affective conditions. In summary, few studies have explored P3 in alcoholic women and the results are equivocal; although two studies report P3 am-plitude decrements in this group, the other two do not.
If P3 is a phenotypic marker of alcoholism in women, decrements should be found both in alcoholic and high-risk women. Although P3 amplitude decrements have been con-sistently reported in sons of male alcoholics (Polich et al. 1994; Porjesz and Begleiter, 1998), studies on female high-risk subjects are few. Polich et al. (1988) compared 20 pairs of male and female undergraduate subjects from Family History Positive (FHP) and Family History Negative (FHN) families on an auditory discrimination P3 task. No significant differences were found between FHP and FHN men or women. Hill and her colleagues conducted a series of studies of high-risk boys and girls. The most common findings were P3 amplitude decrements only in boys, or, in some cases, in both boys and girls as a group, compared with controls. Hill et al. (1991) compared prepubertal and postpubertal high-risk boys and girls on a visual ERP task and found amplitude decrements only in boys. A similar finding was reported when Hill and Steinhauer (1993b) compared 8- to 18-year -old high-risk boys and girls with controls and reported P3 amplitude decrements on an au-ditory counting task only in high-risk boys. When Hill et al. (1990) compared 8- to 14-year-old sons and daughters of male alcoholics from high-density families with controls, high-density children, both boys and girls, had smaller P3 amplitude than controls. Similarly, Hill et al. (1995) evalu-ated 8- to 18-year-old high-risk children from families of female alcoholic probands (not necessarily the mother) and compared them with children from nonalcoholic families. High-risk children on the whole had lower P3 amplitudes compared with controls. A subsample of girls with maternal alcoholism and no paternal alcoholism revealed that they had a much lower P3 amplitude than controls, favoring the findings of epidemiologic studies that show higher rates of alcoholism in daughters of female alcoholics. Recent stud-ies on high-risk children do not show significant gender differences. Results from the COGA show that both sons and daughters of alcoholic fathers had significantly lower P3 amplitudes compared with age and sex matched controls (Porjesz et al. 1998). Holguin et al. (1998) compared 7- to 15-year-old sons and daughters of alcoholics from both high and low density families with controls and reported lower P3 amplitude in high-density girls. More recently, Van der Stelt (1999) compared 7- to 18-year-old high-risk children and found that gender had no significant effect on the P3 amplitude—both sons and daughters of alcoholics had lower P3 amplitudes. In summary, a majority of high-risk studies do not include daughters of alcoholics. Among the studies that do, except for the early studies of Hill et al.
(1991) and Hill and Steinhauer (1993b), both high risk boys and girls were found to have reduced P3 amplitude com-pared with normal controls, suggesting that both boys and girls equally manifest vulnerability to alcoholism.
There is a need to further explore this population—both women at risk and women alcoholics—to evaluate gender differences in vulnerability to alcoholism. The present study was designed to compare alcoholic women and con-trol subjects on a Visual P3 task.
METHODS Subjects
The subjects were 104 right-handed women aged 24 to 50 years of age. The alcoholic group (n⫽44; mean age 37.26 years; SD 5.91) was recruited from individuals undergoing treatment in the Short Term Alcohol Treat-ment Unit, Addictive Disease Hospital, Kings County Hospital Center, New York. The control sample (n⫽60; mean age 28.19 years; SD 4.03) were individuals who responded to newspaper advertisements or notices posted in the SUNY Health Science Center. All subjects were screened using a questionnaire regarding details of alcohol and drug use, medical, and psychiatric histories of herself and her relatives. Exclusion criteria for both groups included major medical conditions or current requirement of medication that could affect the central nervous system (CNS).
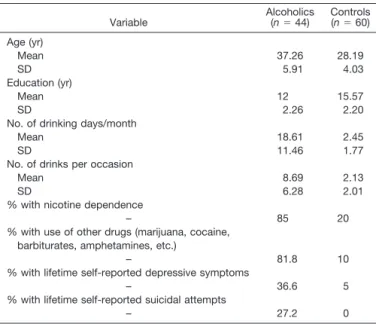
Control individuals were social drinkers with no personal or family history of medical or psychiatric problems, including alcoholism and drug dependence. Informed consent was obtained from each individual and they were paid for their services. All alcoholics had been detoxified and were not drinking at the time of the experiment. Breath-analyzer tests were done prior to recordings, and individuals with nonzero readings were excluded. The demographic and clinical characteristics of the sample are illustrated in Table 1.
Experiment Design
The subject was seated comfortably in a dimly lit, temperature regu-lated, sound-attenuated (Industrial Acoustics Corp., Bronx, NY) room. Each subject was fitted with an electrode cap (Electro-Cap Intl., Inc., Eaton, OH) containing 61 electrodes and was asked to focus her eyes on a fixation target centrally displayed on a computer monitor. The nose
Table 1.Sociodemographic and Clinical Characteristics of the Sample Variable Alcoholics(n⫽44) Controls(n⫽60) Age (yr) Mean 37.26 28.19 SD 5.91 4.03 Education (yr) Mean 12 15.57 SD 2.26 2.20
No. of drinking days/month
Mean 18.61 2.45
SD 11.46 1.77
No. of drinks per occasion
Mean 8.69 2.13
SD 6.28 2.01
% with nicotine dependence
– 85 20
% with use of other drugs (marijuana, cocaine, barbiturates, amphetamines, etc.)
– 81.8 10
% with lifetime self-reported depressive symptoms
– 36.6 5
% with lifetime self-reported suicidal attempts
served as the reference and the forehead as ground. Both vertical and horizontal eye movements were monitored. EEG activity was amplified 10 K (Sensorium, Charlotte, VT; bandpass: 0.02 - 50 Hz.). Baseline activity was sampled at a rate of 256 Hz, beginning 187 msec before stimulus onset and continuing for 1.432 sec (Concurrent 5550, Atlanta, GA). The ERPs to each stimulus presentation were monitored continuously. Subjects were requested to avoid blinking their eyes and to sit as still as possible. ERP data were recorded from 61 channels, as follows: AF1/2, AF7/8, AFz,F1/2, F3/4,F5/6,F7/8, Fz, FP1/2, FPz, FC1/2, FC3/4, FC5/6, FCz, C1/2, C3/4, C5/6, Cz, CP1/2, CP3/4, CPz, P1/2, P3/4, Pz, PO1/2, PO7/8, POz, O1/2, Oz, FT7/8, CP5/6, P5/6, P7/8, and TP7/8. Digital filtering (32 Hz low pass) of the raw data were done offline and artifact rejection (electromyogram, electro-oculogram and saturation artifact ⬎ 73.3 uv) was performed on-line.
The Visual P3 paradigm consisted of the presentation of three types of visual stimuli (n⫽280), 60 msec duration, subtending a visual angle of 2.5 degrees, with an interstimulus interval of 1.625 sec. The rare target stimulus (n⫽35) was the letter X, to which the subject had to press a button as quickly as possible; the responding hand was alternated across subjects to counterbalance any laterality effects due to responding. Speed was emphasized, but not at the cost of accuracy. The frequently occurring nontarget stimuli (n⫽210) were squares and the novel stimuli (n⫽35) consisted of colored geometric polygons that were different on each trial; the subject was not required to respond to the nontarget and novel stimuli. The stimuli were presented pseudorandomly with the constraints that neither targets nor novels could be repeated consecutively. Data acquisi-tion was terminated when a minimum of 25 artifact-free trials of both target and novel responses were recorded. ERPs were averaged for each stimulus category including only correct trials. The ERPs and the Re-sponse Time (RTs) from accepted trials were placed in the three catego-ries for subsequent averaging and statistical analysis.
Statistical Analysis
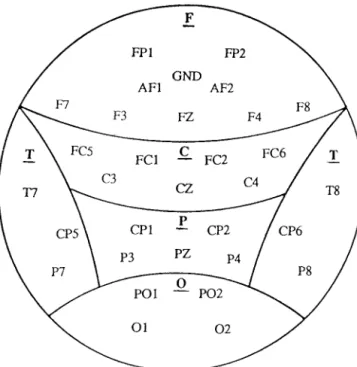
For each subject, the average ERPs derived from the target, frequent and novel stimuli were analyzed using a semiautomatic peak detection program. P3 amplitude was measured as the voltage difference from the baseline (125 msec of EEG prior to stimulus onset) to the largest positive peak in the latency window 300–600 msec after the stimulus. For each subject, a P3 peak amplitude (uv) and latency (msec) was measured at 31 electrodes (see Fig. 1).
The electrode sites organized into each brain region generally corre-sponded to the underlying brain cortex. The statistical analysis was per-formed on data from 31 channels. Independent groupttests were used to evaluate differences in age. The alcoholics were significantly older than the controls. Age was used as a covariate for all further analyses. Analyses of Covariance (ANCOVA) were computed for differences in reaction time (RT) and error rates (ER). A number of Repeated Measures AN-COVAs (RM-ANAN-COVAs; SAS v6.09, PROC GLM) were carried out separately for each component using the amplitude or latency at each of the 5 6 regional arrays as a dependent vector, clinical status as between-subject effect and electrode site as within-between-subject effect. Greenhouse-Geisser adjustments to the degrees of freedom were used where appropriate.
Source Localization
Source localization of surface amplitude values was plotted using the Low Resolution Electromagnetic Tomography (LORETA; Pascaul-Marqui, 1999). LORETA was developed to obtain brain electrical sources with a relatively low spatial resolution. This method does not assume a specific number of sources, but computes the “smoothest” of all possible activity distributions (assuming neighboring neurons are simultaneously and synchronously active). At each voxel, LORETA computes current density as the linear, weighted sum of the scalp electric potentials. LORETA computes current density for the whole brain volume, and the graphical display is in the form of slices. This method has been found to provide reliable and physiologically meaningful results localizing the
sources of brain activity during visual and auditory tasks (Pascaul-Marqui et al. 1994). The LORETA version used was registered to the Talairach Brain Atlas (Talairach and Tournoux, 1988) and used data from all 61 electrodes. The solution space consisted of 2394 voxels with a spatial resolution of 7 mm. LORETA images were constructed based on the group data of alcoholics and controls, respectively.
RESULTS Response Time (RT)
The mean RT of the two groups was compared using ANCOVA with age as a covariate (p⬍ 0.6122). Although the two groups did not differ significantly in their RT, the control group had a slightly earlier RT (mean 489.72 msec; SD 94.28 msec) than the alcoholic group (mean 495.61 msec; SD 121.87 msec).
Error Rate (ER)
The mean total error scores (both omission and commis-sion) of the two groups were compared using ANCOVA with age as a covariate (p⬍ 0.4101). The alcoholic group had a higher error rate (mean 2.39; SD 3.08) than the controls (mean 1.19; SD 1.57), but this was not statistically significant.
Clinical Characteristics
Target P3 amplitudes (in central electrodes) were com-pared between subgroups of alcoholics divided on the basis of clinical characteristics. No significant differences were found between alcoholics with and without self-reported
Fig. 1.The recording electrode (n⫽31) montage and the regional groupings (F, frontal; C, central; P, parietal; O, occipital; and T, temporal) used in the statistical analysis.
lifetime depression and alcoholics with and without lifetime history of suicidal attempts. Meaningful statistical compar-isons of alcoholics who used drugs other than alcohol to alcoholics who used no other drugs, alcoholics with and without a family history of alcohol or drug abuse could not be made because of small sample sizes in the subgroups. Therefore, for all further statistical analysis, alcoholics were treated as one composite group. Similarly, in the control group, the number of subjects who reported smoking, use of other drugs, and self-reported depressive symptoms were too few for statistical analysis.
P3 Amplitude and Latency
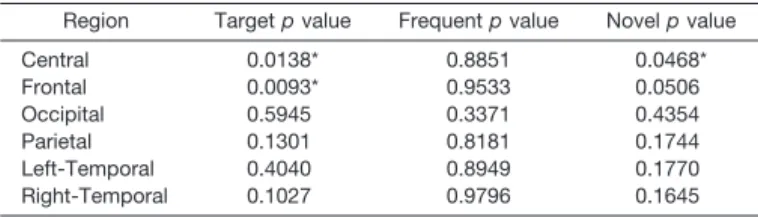
The level of significance of F values of the RM-ANCOVA analysis over different electrode regions is shown in Table 2. The results show statistically significant reduced P3 amplitudes in the responses to the target stim-ulus in frontal (F⫽7.02;p⬍0.0093) and central (F⫽6.29;
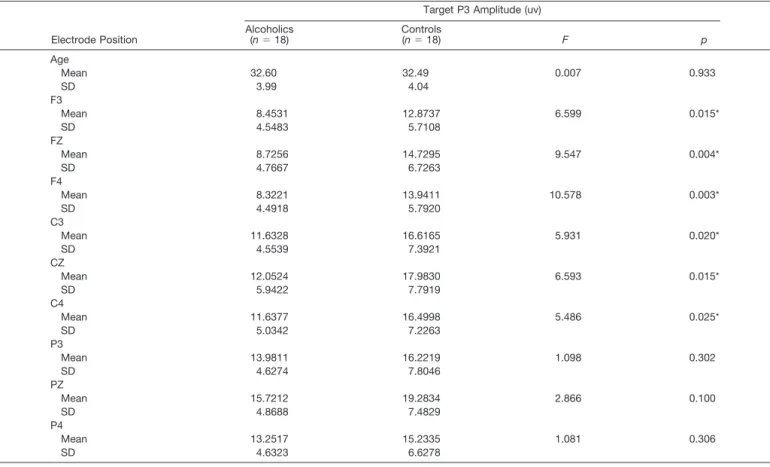
p⬍0.0138) electrode areas in the alcoholic group. Table 3 depicts the mean P3 amplitude of the target response for an age-matched representative subsample of alcoholics and controls at selected electrodes (F3, FZ, F4, C3, CZ, C4, P3, PZ, P4). Age-matched alcoholics had significantly lower P3 amplitudes compared with the controls in the central and frontal leads in keeping with the RM-ANCOVA results. In the parietal, temporal, and occipital regions, the alcoholic group had lower mean amplitudes than the controls at all the leads, but this did not reach statistical significance. Figure 2 illustrates the grand mean waveforms of the ERP to the target stimulus for the control and alcoholic groups over the frontal, central, and parietal electrodes. No differ-ences in amplitude were seen in the responses to the fre-quent stimulus. For the novel stimulus, a significantly low-ered P3 amplitude was seen over the central area (F⫽4.05;
p⬍ 0.0468) in the alcoholic group and the differences in the frontal area tended toward significance (F⫽3.91;p⬍
0.0506). No significant group differences in P3 latency in any region for any stimulus were seen.
Source Localization
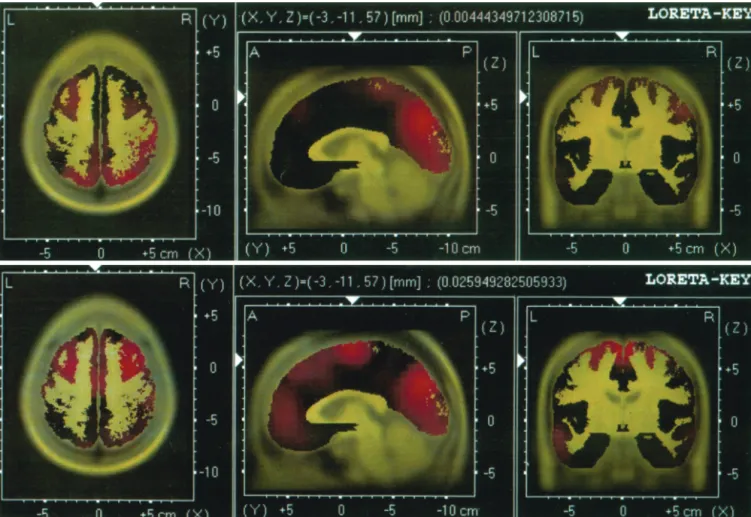
Figure 3 shows the mean activation levels over the brain regions of the two groups to the target stimulus as plotted by the LORETA. The LORETA slices correspond to the following Talairach co-ordinates: X⫽ ⫺3, Y⫽ ⫺11 and Z
⫽ 57. In alcoholics, the LORETA shows the strongest
activation in the left prefrontal and occipital regions. In the controls, the activation is seen in bilateral prefrontal and central regions. A visual comparison of the two maps shows lower activation in the right dorso-lateral prefrontal and ventro-medial regions in the alcoholics compared with the controls. In terms of lateralization, controls show equal activation in both hemispheres, while alcoholics show more left than right activation.
DISCUSSION
The present study demonstrates P3 amplitude decre-ments in alcoholic women in frontal and central regions compared with nonalcoholic female controls. These find-ings were supported by LORETA images indicating lower activation in the right dorso-lateral prefrontal and ventro-medial regions in alcoholics compared with controls.
Gender, Family History, and Psychopathology
Lowered P3 amplitude has been considered to be an endophenotypic marker of alcoholism: it is genetically transmitted, identifies individuals at risk, is prevalent in the patient population, and is present during symptom remis-sion (Begleiter and Porjesz, 1995; Porjesz et al. 1998). In alcoholic men, decreased P3 amplitude has been estab-lished as a robust risk marker of genetic vulnerability to alcoholism. The emphasis in alcoholism research has been on evaluating male alcoholics, because the prevalence of alcohol abuse and dependence is two to three times higher among men than in women (Grant, 1996). However, as recent epidemiologic studies indicate (Heath et al. 1997; Prescott et al., 1999), both men and women are equally at risk for developing alcoholism. Despite similar genetic in-fluences, fewer women are alcoholic, suggesting that these women could have higher levels of liability than alcoholic men and that the risk to their relatives would be greater (Prescott et al., 1999). Therefore, there is a strong need to evaluate female alcoholic probands and their children to gain further understanding of gender differences in alco-holism vulnerability.
The results of the present study suggest that lowered P3 amplitude could be an equally sensitive risk marker for alcoholism in women as in men. The results concur with reports by Hill et al. (1993a) and Porjesz et al. (1998). In the study by Hill et al. (1993a), P3 amplitude decrements were most significant in the parietal region as seen on Pz. Their sample was drawn from high-density families and the probands were family history positive for alcoholism. Sim-ilarly, the sample studied by Porjesz et al. (1998) was part of the COGA study and was selected from high-density fam-ilies. However, Parsons et al. (1990) did not find significant results even when family history was taken into account in their study. In the present study, the sample was drawn from both Family History Positive (FHP; 64%) and Family History Negative (FHN; 36%) alcoholic families. A com-parison of the subgroups with and without family history
Table 2.Comparisons of Regional P3 Amplitudes for Alcoholics and Controls Using MANCOVA
Region Targetpvalue Frequentpvalue Novelpvalue
Central 0.0138* 0.8851 0.0468* Frontal 0.0093* 0.9533 0.0506 Occipital 0.5945 0.3371 0.4354 Parietal 0.1301 0.8181 0.1744 Left-Temporal 0.4040 0.8949 0.1770 Right-Temporal 0.1027 0.9796 0.1645 * Significant at 0.05 level.
did not yield significant differences, suggesting that family history contributes to, but need not be the only factor responsible for lowered P3 in alcoholism. As decreased P3 amplitude is not specific to alcoholism, it is possible that the individuals drawn from FHN families in our sample were nevertheless from families at risk for other
external-izing disorders. From this data set, it is difficult to isolate the influence of family history on P3 amplitude. A more recent study by Hill and colleagues (1999) failed to repli-cate their earlier findings, despite selecting their sample from families with high density of alcoholism and low den-sity of other psychopathology. The only P3 difference re-ported was between alcoholic women with comorbid de-pression compared with controls. The authors suggest that the decrements reported in this group are more a feature of comorbid depression than alcoholism risk. In the present study, we compared our sample with (36.6%) and without comorbid depression (self-report-lifetime) and did not find any significant differences in their P3 amplitudes. It has been well established that a number of psychiatric condi-tions including Antisocial Personality Disorder, Bipolar Af-fective Disorder, Unipolar Depression, and Anxiety Disor-ders coexist with alcoholism (Reiger et al. 1990). As with family history, comorbid psychopathology might contribute to, but may not be the only factor responsible for reduced P3 amplitude in alcoholics.
P3 and Frontal Lobe Dysfunction in Alcoholics
In the present study, P3 amplitude was significantly de-creased in alcoholic women over frontal and central areas. Source localization studies suggest that the P3 is produced from multiple generators in the brain and this includes the prefrontal cortex, the parieto-temporal junction, and the
Table 3.Mean P3 Amplitude (uv) of the Target Response for a Representative Age-Matched Sub-Sample at Selected Electrodes
Electrode Position
Target P3 Amplitude (uv) Alcoholics (n⫽18) Controls (n⫽18) F p Age Mean 32.60 32.49 0.007 0.933 SD 3.99 4.04 F3 Mean 8.4531 12.8737 6.599 0.015* SD 4.5483 5.7108 FZ Mean 8.7256 14.7295 9.547 0.004* SD 4.7667 6.7263 F4 Mean 8.3221 13.9411 10.578 0.003* SD 4.4918 5.7920 C3 Mean 11.6328 16.6165 5.931 0.020* SD 4.5539 7.3921 CZ Mean 12.0524 17.9830 6.593 0.015* SD 5.9422 7.7919 C4 Mean 11.6377 16.4998 5.486 0.025* SD 5.0342 7.2263 P3 Mean 13.9811 16.2219 1.098 0.302 SD 4.6274 7.8046 PZ Mean 15.7212 19.2834 2.866 0.100 SD 4.8688 7.4829 P4 Mean 13.2517 15.2335 1.081 0.306 SD 4.6323 6.6278 * Significant at 0.05 level.
Fig. 2.Grand mean waveforms of P3 ERP to the target stimulus for the control and alcoholic groups over representative frontal, central, and parietal electrodes.
medial temporal lobe (Molnar, 1994). Functional MRI studies (Clark et al. 2000; Linden et al. 1999; Menon et al. 1997) highlight the role of the prefrontal cortex in the production of the P3. In male alcoholics, PET studies indicate a lowered glucose metabolism in the medial frontal cortex (Adams et al. 1993, 1998) when compared to con-trols. Typically, P3 amplitude to target stimuli has been found to have a maximal centro-parietal peak and dimin-ished P3 amplitude in male alcoholics has generally been reported in central and parietal regions (Porjesz and Begle-iter, 1998). The fronto-central P3 decrements found in our sample could either reflect differences in P3 morphology between alcoholic men and women, or overall gender dif-ferences in P3 generators between men and women. In a study on gender differences in P3, Golgeli et al. (1999) found that the N2-P3 component was larger anteriorly than posteriorly in women. In the present study, although P3 has a maximal peak at Pz, significant differences in amplitudes between the two groups were in the frontal and central regions. The findings from source localization (LORETA) support the statistical results. It is possible that in alcoholic women, this frontal deficit is manifested as lowered P3 in
fronto-central areas of the scalp due to gender differences in P3 generators.
Brain imaging studies of alcoholics consistently report deficits in these regions and in the anterior cingulate areas (Dao-Castellana et al. 1998; Pfefferbaum et al. 1997), all involved in attentional processing, specifically sustenance of attention and selective attention. In our sample, the areas of low activation in the alcoholic group included the right dorso-lateral prefrontal cortex and the ventro-medial regions. These regions have numerous connections to and from other subcortical structures including the basal gan-glia and limbic structures. The primary functions of these areas include arousal and sustaining attention, short-term and working memory and response inhibition (Oscar-Berman and Hutner, 1993). Deficits in these functions have been consistently reported in alcoholics: tasks measuring attention, motor control, spatial scanning and sequencing, working memory, and response inhibition (Parsons, 1993). Furthermore, alcoholics are often found to have personal-ity characteristics such as impulsivpersonal-ity and sensation-seeking similar to that of patients with frontal system brain damage unrelated to alcoholism (Hesselbrock, 1995), which
Fig. 3.Source localization of surface amplitude values for alcoholics (top) and controls (bottom) plotted using low-resolution brain electromagnetic tomography (LORETA) as seen from horizontal, sagittal, and coronal sections. In the figure, black to yellow colors encode anatomy, black to red encode hyperactivity, and black to blue encode hypoactivity. Talairach coordinates (X, Y, Z) are indicated.
strengthens the theory of prefrontal dysfunction in alcohol-ics. Brain Imaging studies of alcoholics also find cortical shrinkage in the frontal lobe (Pfefferbaum et al. 1997). In a study by Pfefferbaum et al. (1998), repeated imaging of a group of alcoholics who continued drinking over a 5-yr period showed progressive brain shrinkage that signifi-cantly exceeded normal age related shrinkage. There is also some evidence to suggest that women may be more suscep-tible than men to alcohol-related brain shrinkage (Hommer et al. 1996). The present study provides evidence for pre-frontal deficits in female alcoholics that are reflected as lowered P3 amplitude in frontal and central regions and lowered activation in the dorsolateral and ventro-medial frontal regions.
P3, CNS Disinhibition, and Alcoholism
The scalp P3 is generated from multiple brain areas such as the medial temporal lobe, temporal-parietal junction, and sources within the frontal lobe (Porjesz and Begleiter, 1998). A number of functional models have been proposed to account for P3 amplitude. These in-clude the theories of Desmedt and Debecker (1979) who proposed that the occurrence of the P3 corresponds to the termination of the decision-making process, which takes place during the categorization of the target stim-uli. They suggested that P3 indicates an inhibitory input of the prefrontal cortex to the activating reticular for-mation. Donchin (1981) suggested that P3 reflects con-text updating where subjects have a “model” of the experimental situation and a stimulus causes that model to change and be updated resulting in the P3. Verleger (1988) proposed that P3 denotes “context closure” and target trials are seen as deviant stimuli in a repetitive, highly structured experiment causing the appearance of the P3. Biochemically, the role of cholinergic (Hammond et al. 1987) and nonadrenergic (Pineda et al. 1989) sys-tems in the generation of the P3 have been established in animal studies. On a physiologic level, several research-ers (Smith et al.1990; Woodward et al. 1991) propose that the P3 component of the ERP is largely caused by a widely distributed inhibitory event and involves struc-tures such as the reticular nucleus and the thalamo-cortical pathways. Other physiologic models of P3 in-clude the resolution/relaxation hypothesis (Deecke et al. 1984) that suggests P3 positivity to be an inhibitory resolution of preceding excitatory negativity. Overall, P3 is viewed as an inhibitory process, a disfacilitated state of neuronal networks that is reflected as a lack of CNS inhibition (Begleiter and Porjesz 1999). Begleiter and Porjesz (1999) propose that the CNS hyperexcitability reflects an imbalance between excitation and inhibition and decreased P3 amplitude in alcoholics suggests a general state of CNS disinhibition and an excess of CNS excitation. This theory gains support in the finding that P3 amplitude is inversely related to severity of alcohol
dependence (Begleiter and Porjesz, 1999). Drinking can be viewed as an attempt to temporarily alleviate this state and physical dependence results as an adaptive process in the CNS. The excessive CNS excitability in individuals at high risk could lead to subsequent chronic exposure to alcohol and to dependence. In the present study, the decreased P3 amplitude in the female alcohol-ics could reflect CNS excitation, and drinking could serve as a behavior to normalize this excitation. This hypoth-esis is also supported by studies of acute effects of ethanol in which the EEG of alcoholics and sons of alcoholics has been shown to be more synchronized fol-lowing an acute dose of ethanol and reflected as an increase in alpha activity immediately after drinking (Co-hen et al. 1993; Newlin and Thomson, 1990; Pollock, 1992; also Jagadeesh, unpublished dissertation). Further research in this area is necessary to understand the inhibitory mechanisms of the brain and to understand gender differences in alcoholism, which will have several implications for preventive policies.
ACKNOWLEDGMENT
The authors thank Aquanette Sass, Marty Krakowsky, Ed Babington, Sandi Watson, Brain Beckrich, Vladimir Kotlyarevsky, Elizabeth Iskander, Marc Ostrega, and Sergio Valentini for their valuable technical support.
We are grateful to R.D. Pascual-Marqui for LORETA software used to generate the images shown in figure 6 (available at http://www.unizh.ch/keyinst/newLORETA/LORET01.htm).
REFERENCES
Adams KM, Gilman S, Johnson-Greene D, Koeppe RA, Junck L, Kluin KJ, Martorello S, Johnson MJ, Heumann M, Hill E (1998) The signif-icance of family history status in relation to neuropsychological test performance and cerebral glucose metabolism studied with positron emission tomography in alcoholic patients. Alcohol Clin Exp Res 22: 105–110.
Adams KM, Gilman S, Koeppe RA, Kluin KJ, Brunberg JA, Dede D, Berent S, Kroll PD (1993) Neuropsychologicla deficits are correlated with frontal hypometabolism in positron emission tomography studies of older alcoholic patients. Alcohol Clin Exp Res 17:205–210. Begleiter H, Porjesz B, Bihari B, Kissin B (1984) Event-related potentials
in boys at risk for alcoholism. Science 225:1493–1496.
Begleiter H, Porjesz B (1995) Neurophysiological phenotypic factors in the development of alcoholism, inAlcohol and Alcoholism vol. 1, The Genetics of Alcoholism(Begleiter H, Kissin B, eds), pp 269–293. Oxford University Press, New York.
Begleiter H, Porjesz B (1999) What is inherited in the predisposition toward alcoholism? A proposed model Alcohol Clin Exp Res 23:1125– 1135.
Clark VP, Fannon S, Lai S, Benson R, Bauer L (2000) Responses to rare visual target and distractor stimuli using event related fMRI. J Neuro-physiol 83:3133–3139.
Cohen HL, Porjesz B, Begleiter H (1993) The effects of ethanol on EEG activity in males at risk for alcoholism. Electroencephalogr Clin Neu-rophysiol 86:368–376.
Cohen HL, Wang W, Porjesz B, Begleiter H (1995) Auditory P300 in young alcoholics: Regional response characteristics. Alcohol Clin Exp Res 19:469–475.
Cotton NS (1979) The familial incidence of alcoholism: A review. J Stud Alcohol 40:89–116.
Dao-Castellana MH, Samson Y, Legault F, Martinot JL, Aubin HJ, Crouzel C, Feldman L, Barracand D, Rancurel G, Feline A, Syrota A (1998) Frontal dysfunction in neurologically normal chronic alcoholic subjects: Metabolic and neuropsychological findings. Psychol Med 28: 1039–1048.
Deecke L, Heise B, Kornhuber HH, Lang M, Lang W (1984) Brain potentials associated with voluntary manual tracking, inEvent-Related Potentials(Karrer R, Cohen J, Tueting P eds), pp 450–464. Annals of the New York Academy of Sciences, New York.
Desmedt JE, Debecker J (1979) Slow potential shifts and decision P350 interactions in tasks with random sequences of near-threshold clicks and finger stimuli delivered at regular intervals. Electroencephalogr Clin Neurophysiol 47:671–679.
Donchin E (1981) Surprise!...Surprise? Psychophysiology 18:493–513. Emmerson RY, Dustman RE, Shearer DE, Chamberlin HM (1987)
Vi-sually evoked and event related potentials in young abstinent alcoholics. Alcohol 4:241–248.
Golgeli A, Suer C, Ozesmi C, Dolu N, Ascioglu M, Sahin O (1999) The effect of sex differences on event-related potentials in young adults. Int J Neurosci 99:69–77.
Grant BF (1996) Prevalence and correlates of alcohol use and DSM-IV alcohol dependence in the United States: Results of the National Longitudinal Alcohol Epidemiologic Survey. J Stud Alcohol 58:464– 473.
Hammond EJ, Meador KJ, Aung-Din R, Wilder BJ (1987) Cholinergic modulation of human P3 event-related potentials. Neurology 37:346– 350.
Heath AC, Bucholz KK, Madden PA, Dinwiddle SH, Slutske WS, Bierut LJ, Statham DJ, Dunne MP, Whitfield JB, Martin NG (1997) Genetic and environmental contributions to alcohol dependence risk in a na-tional twin sample: Consistency of findings in women and men. Psychol Med 27:1381–1396.
Hesselbrock MN (1995) Genetic determinants of alcoholic subtypes, in Alcohol Alcohol: volume 1. The Genetics of Alcoholism(Begleiter H, Kissin B eds), pp 40–69. Oxford University Press, New York. Hill SY, Locke J, Steinhauer SY (1999) Absense of visual and auditory
P300 reduction in nondepressed male and female alcoholics. Biol Psy-chiatry 46:982–989.
Hill SY, Steinhauer SR (1993a) Event-related potentials in women at risk for alcoholism. Alcohol 10:349–354.
Hill SY, Steinhauer SR (1993b) Assessment of prepubertal and postpu-bertal boys and girls at risk for developing alcoholism with P300 from a visual discrimination task. J Stud Alcohol 54:350–358.
Hill SY, Steinhauer S, Locke J (1995) Event-related potentials in alcoholic men, their high-risk male relatives, and low-risk male controls. Alcohol Clin Exp Res 19:567–576.
Hill SY, Steinhauer SR, Park J, Zubin J (1990) Event related potential characteristics in children of alcoholics from high-density families. Al-cohol Clin Exp Res 14:6–16.
Hill SY, Steinhauer SR, Smith TR, Locke J (1991) Risk markers for alcoholism in high-density families. J Subst Abuse 3:351–369. Holguin SR, Corral M, Cadaveira F (1998) Visual and auditory
event-related potentials in young children of alcoholics from high- and low-density families. Alcohol Clin Exp Res 22:87–96.
Hommer D, Momenan R, Rawlings R, Ragan P, Williams W, Rio D, Eckardt M (1996) Decreased corups callosum size among alcoholic women. Arch Neurol 53:359–363.
Linden DE, Prvulovic D, Formisano E, Vollinger M, Zanella FE, Geobel R, Dierks T (1999) The functional neuroanatomy of target detection: An fMRI study of visual and auditory oddball tasks. Cereb Cortex 9:815–823.
McGue M, Slutske W (1996) The inheritance of alcoholism in women. NIAAA Res Monogr 32:65–91.
Menon V, Ford JM, Lim KO, Glover GH, Pfefferbaum A (1997) Com-bined event-related fMRI and EEG evidence for temporal-parietal cortex activation during target detection. Neuroreport 8:3029–3037.
Molnar M (1994) On the origin of the P3 event-related potential compo-nent. Int J Psychophysiol 17:129–144.
Newlin DB, Thomson JB (1990) Alcohol challenge with sons of alcoholics: A critical review and analysis. Psychol Bull 108:383–402.
Oscar-Berman M, Hutner N (1993) Frontal lobe changes after chronic alcohol ingestion. NIAAA Res Monogr 22:121–156.
Parsons OA (1993) Impaired neuropsychological cognitive functioning in sober alcoholics. NIAAA Res Monogr 22:173–194.
Parsons OA, Sinha R, Williams HL (1990) Relationships between neuro-psychological test performance and event-related potentials in alcoholic and nonalcoholic samples. Alcohol Clin Exp Res 14:746–755. Pascual-Marqui RD (1999) Review of the methods for solving the EEG
inverse problem. Inter J Bioelectron 1:75–86.
Pascual-Marqui RD, Michel CM, Lehmann D (1994) Low resolution electromagnetic tomography: A new method for localizing electrical activity in the brain. Int J Psychophysiol 18:49–65.
Patterson BW, Williams HL, McLean GA, Smith LT, Schaeffer KW (1987) Alcoholism and family history of alcoholism: Effects on visual and auditory event-related potentials. Alcohol 4:265–274.
Pfefferbaum A, Ford JM, White PM, Mathalon D (1991) Event-related potentials in alcoholic men: P3 amplitude reflects family history but not alcohol consumption. Alcohol Clin Exp Res 15:839–850.
Pfefferbaum A, Sullivan EV, Mathalon DH, Lim KO (1997) Frontal lobe volume loss observed with magnetic resonance imaging in older chronic alcoholics. Alcohol Clin Exp Res 21:521–529.
Pfefferbaum A, Sullivan EV, Rosenbloom MJ, Mathalon DH, Lim KO (1998) A controlled study of cortical gray matter and ventricular changes in alcohol men over a 5-year interval. Arch Gen Psychiatry 55:905–912.
Pineda JA, Foote SL, Neville HJ (1989) Effects of locus coeruleus lesions on auditory, long-latency, event related potentials in monkey. J Neuro-sci 9:81–93.
Polich J, Haier RJ, Buchsbaum M, Bloom FE (1988) Assessment of young men at risk for alcoholism with P300 from a visual discrimination task. J Stud Alcohol 49:186–190.
Polich J, Pollock VE, Bloom FE (1994) Meta-analysis of P300 amplitude from males at risk for alcoholism. Psychol Bull 115:55–73.
Pollock VE (1992) Meta-analysis of subjective sensitivity to alcohol in sons of alcoholics. Am J Psychiatry 149:1534–1538.
Porjesz B, Begleiter H (1998) Genetic basis of event-related potentials and their relationship to alcoholism and alcohol use. Clin Neurophysiol 15:44–57.
Porjesz B, Begleiter H, Bihari B, Kissin B (1987) Event-related brain potentials to high incentive stimuli in abstinent alcoholics. Alcohol 4:283–287.
Porjesz B, Begleiter H, Garozzo R (1980) Visual evoked potential corre-lates of information processing deficits in chronic alcoholics, in Biolog-ical Effects of Alcohol(Begleiter H ed), pp 603–623. Plenum, New York. Porjesz B, Begleiter H, Reich T, Van Eerdewegh P, Edenberg HJ, Foroud T, Goate A, Rice J, Litke A, Chorlian D, Blangero J, Stimus AT, Sorbell J, Bauer, LO, Kuperman S, O’Conner SJ, Rohrbaugh J (1998) Ampli-tude of visual P3 event-related potential as a phenotypic marker for a predisposition to alcoholism: Preliminary results from the COGA project. Alcohol Clin Exp Res 22:1317–1323.
Prescott CA, Aggen SH, Kendler KS (1999) Sex differences in the sources of genetic liability to alcohol abuse and dependence in a population-based sample of U.S. twins. Alcohol Clin Exp Res 23:1136–1144. Reiger DA, Farmer ME, Rae DS, Loche BZ, Keith SJ, Judd LL, Goodwin
FK (1990) Comorbidity of mental disorders with alcohol and other drug abuse: Results from the Epidemiologic Catchment Area (ECA) Study. JAMA 264:2511–2518.
Smith ME, Halgren E, Sokolik M, Baudena P, Musolino A, Leigeois-Chauvel C, Leigeois-Chauvel P (1990) The intracranial topography of the P3 event-related potential elicited during auditory oddball. Electroen-cephalogr Clin Neurophysiol 76:235–248.
Talairach J, Tournoux P (1988) Co-planar stereotaxic atlas of the human brain. Thieme, Stuttgart.
Urbano-Marquez A, Estruch R, Fernandez-Sola J, Nicolas JM, Pare JC, Rubin E (1995) The greater risk of alcoholic cardiomyopathy and mayopathy in women compared with men. JAMA 274:149–154. Van der Stelt O (1999) ESBRA - Nordmann 1998 Award Lecture: Visual P3
as a potential vulnerability marker of alcoholism: Evidence from the Am-sterdam study of children of alcoholics. Alcohol Alcohol 34:267–282. Verleger RG (1988) Event-related potentials and cognition: A critique of
the context updating hypothesis and an alternative interpretation of P3. Behav Brain Sci 11:343–356.
Woodward SH, Brown WS, Marsh JT, Dawson ME (1991) Probing the time-course of the auditory oddball P3 with secondary reaction time. Psychophysiology 28:609–618.
Williams GD, Grant BF, Harford TC, Noble BA (1989) Population pro-jections using DSM-III criteria: Alcohol abuse and dependence, 1990– 2000. Alcohol Health Res World 13:366–370.
Zhang Y, Kreger BE, Dorgan JF, Splansky GL, Cupples LA, Ellison RC (1999) Alcohol consumption and risk of breast cancer: The Farming-ham Study revisited. Am J Epidemiol 149:93–101.