Accepted Manuscript
Low-angle dunes in the Changjiang (Yangtze) Estuary: Flow and sediment dynamics under tidal influence
Hao Hu, Taoyuan Wei, Zhongyong Yang, Christopher R. Hackney, Daniel R. Parsons PII: S0272-7714(17)30688-1
DOI: 10.1016/j.ecss.2018.03.009 Reference: YECSS 5786
To appear in: Estuarine, Coastal and Shelf Science Received Date: 3 July 2017
Revised Date: 21 December 2017 Accepted Date: 5 March 2018
Please cite this article as: Hu, H., Wei, T., Yang, Z., Hackney, C.R., Parsons, D.R., Low-angle dunes in the Changjiang (Yangtze) Estuary: Flow and sediment dynamics under tidal influence, Estuarine, Coastal and Shelf Science (2018), doi: 10.1016/j.ecss.2018.03.009.
This is a PDF file of an unedited manuscript that has been accepted for publication. As a service to our customers we are providing this early version of the manuscript. The manuscript will undergo copyediting, typesetting, and review of the resulting proof before it is published in its final form. Please note that during the production process errors may be discovered which could affect the content, and all legal disclaimers that apply to the journal pertain.
M
AN
US
CR
IP
T
AC
CE
PT
ED
Low-angle dunes in the Changjiang (Yangtze) Estuary:
flow and sediment dynamics under tidal influence
Highlights:
Low-angle dunes composed of fine sediment were studied;
Flow and sediment dynamics over dunes were measured in the Changjiang Estuary;
Sediment composition attributes to sediment transport mechanism; Evolution process of low-angle dunes within a tidal cycle was elaborated; Clockwise hysteresis loops were found between flows and bedform features.
Abstract: It has long been highlighted that important feedbacks exist between river bed morphology, sediment transport and the turbulent flow field and that these feedbacks change in response to forcing mechanisms. However, our current understanding of bedform dynamics is largely based on studies of steady flow environments and cohesionless bed conditions. Few investigations have been made under rapidly changing flows. Here, we examine flow and sediment dynamics over low-angle dunes in unsteady flows in the Changjiang (Yangtze) Estuary, China. Topography, flow and sediment data were collected over a reach ca 1.8 km long through a semi-diurnal tidal cycle in a moderate tide of flood season. The results show that: (1) roughness length derived from the upper flow changes little with the flow reversing and displays the same value on both the ebb and flood tide. Moreover, the variability of individual bedform features plays an important role in roughness length variation. (2) Shear stress over the crest of low-angle dunes roughly represents the total spatially averaged stress over dunes in this study area, which has significant implications for advancing numerical models. (3) Changes in morphology, flow and sediment dynamics over dunes through time reveal how low-angle dunes evolve within a tidal cycle. (4) The clockwise hysteresis loops between flow dynamics and bedform features (height and aspect ratio) are also observed. The combination of suspended sediment transport and bedload transport on dune transformation and migration attributes to the clockwise hysteresis. The specific sediment composition of the riverbed, in some extent, affects the mechanism of sediment transport related to the exchange between suspended sediment and riverbed, but further investigation is needed to figure out the mechanism behind this for extended series of tides, such as spring/neap tide and tides in flooding and dry season.
M
AN
US
CR
IP
T
AC
CE
PT
ED
1.
Introduction
Dunes are ubiquitous features in sand bed rivers and estuaries [Kleinhans, 2005;
Parsons et al., 2005], and play a significant role in the connection between boundary flow structure and sediment transport [McLean et al., 1994; Nelson et al., 1995; Best, 2005]. There have been many studies attempting to understand the feedbacks between turbulence, dune form and sediment transport [Best, 2005; Parsons and Best, 2013], however, most of them have focused on fixed dune experiments (e.g. [Bennett and Best, 1995; Maddux et al., 2003a; Maddux et al., 2003b; Venditti, 2007]), ignoring the effect of a movable bed. This results in discrepancies between the flume results and field observations [Grant and Madsen, 1982; Naqshband, 2014;
Naqshband et al., 2014b]. Moreover, they have also mainly focused on unidirectional and uniform flow conditions (e.g. [Guy et al., 1966; Best, 1996; Nelson et al., 2011]), limiting the actual comprehension of the natural hydrology and sediment condition over dunes, especially in tidal environments on the time scale as short as single tidal cycle [McLean et al., 1994; Bennett and Best, 1995; Best and Kostaschuk, 2002;
Kostaschuk and Best, 2005; Ernstsen et al., 2006; Lefebvre et al., 2011; Bradley et al., 2013; Lefebvre et al., 2013; Kwoll et al., 2014; Hendershot et al., 2016].
Both flows and sediment transport in natural rivers and estuaries are largely influenced by the generation, development and geometry of dunes [Clifford et al., 1992; Yang et al., 2005; Parsons et al., 2007; Venditti, 2013]. Flow separation generally occurres over the angle-of-repose lee-side and results in the generation of turbulence, thereby altering sediment dynamics [Best, 2005]. However, growing evidence from field observations suggests that symmetrical dunes with smaller lee-side angles (i.e. low-angle dunes, LADs, generally less than 10° [Paarlberg et al., 2009] ) are the prominent bedforms in tidally influenced, suspended sediment dominated, sand-bedded rivers and estuaries [Smith and McLean, 1977; Kostaschuk and Villard, 1996; Carling et al., 2000; Best and Kostaschuk, 2002; Kwoll et al., 2016;
Lefebvre and Winter, 2016]. As documented in past studies on flow dynamics over low-angle dunes [Best and Kostaschuk, 2002; Bradley et al., 2013; Hendershot et al., 2016; Kwoll et al., 2016; Lefebvre et al., 2016], flow separation occurs intermittently
M
AN
US
CR
IP
T
AC
CE
PT
ED
or is absent. Yet, topographic forcing of flow (expansion flow) contributes to similar gross patterns of flow acceleration and deceleration, which is widely recognized in research of angle-of-repose dunes [Best, 2005]. Moreover, sediment deposits from suspension in the lower lee and trough, leading to the dune migration and deformation [Best and Kostaschuk, 2002; Best, 2005; Bradley et al., 2013; Hendershot et al., 2016]. Additionally, an increasing number studies [Kostaschuk and Villard, 1996; Kostaschuk and Best, 2005; Naqshband et al., 2014a; Naqshband et al., 2014b] have revealed that different sand transport mechanisms contribute to these different formations of dunes: high-angle dunes (HADs) occur under bedload dominant regime, while LADs develop under scenarios with high suspension.
Most of the existing research of dune morphodynamics has focused on non-cohesive bed conditions where median grain size is larger than 150 μm [Field et al., 1981;
Németh et al., 2006] and the classic bedform stability diagram proposed by Allen
[1985] is established based on cohesionless sediments. However, recent studies have highlighted the effect of cohesive material, or ‘’sticky stuff’’ (mud, clay and microorganisms, i.e. cohesive bed) on bedform geometry and dynamics, indicating that present bedform phase diagrams and predictors are overly simplistic [Malarkey et al., 2015; Schindler et al., 2015; Baas et al., 2016; Parsons et al., 2016]. Previous research observed that various scales of dunes existed in beds containing clay, for example the Changjiang (Yangtze) Estuary [Cheng et al., 2001; Wu et al., 2009]. However, these studies have mainly focussed on classifying the geometric characteristics of the dunes [Li et al., 2003; Cheng et al., 2004; Shuwei et al., 2017] or exploring how to predict bedload transport rate based on dune migration [Yang et al., 1999]. But, the formative mechanisms of LADs under this specific condition has been rarely studied.
This study aims to enrich current understanding of bedform dynamics in large tidal environments composed of fine bed materials. Here, seven repeat, high-accuracy measurements of bed topography and flow velocities within a single tidal cycle were carried out in the Changjiang (Yangtze) Estuary, China. Bed roughness and flow resistance were quantified to address how they responded to tidal-scale variable flows. Moreover, morphological changes, flow structure and sediment transport over
M
AN
US
CR
IP
T
AC
CE
PT
ED
dunes through time were all quantified to elaborate how dunes evolve across different tidal stages. The findings are expected to help advance the understanding of generation and migration of low-angle dunes in large, tidally influenced areas and give significant implications for long-term modelling of estuarine sediment transport.
2.
Methods
2.1.
Study area
The Changjiang Estuary, well known as Yangtze Estuary, is a multi-channel estuary with a three-level bifurcation and four distributaries separated by islands or banks. The mean annual discharge at Datong Station (the tidal limit, ~600 km upstream to the estuary) was 896 m3 during 1950 - 2010 [CWRC, 2011]. High discharge occurs in the summer in response to monsoon rains in the upper basin. The mean (and maximum) tidal range is 2.66 m (4.62 m) at Zhongjun station near the mouth and decreases up-estuary to 2.43 m (3.96 m) at Gaoqiao station and 2.21 m (4.48 m) at Wusong station in the South Channel [Yun, 2004].
The mean sediment load transported into the estuary is 390 Mt annually over the period 1950 - 2010 [Luan et al., 2016] and median bed material grain size () in the estuary is 80 - 161 μm, composed of coarser silt to very fine sand in the dry season and very fine to fine sand in the flood season, with little seasonal and spatial variation [Cheng et al., 2004; Wu et al., 2009].
M
AN
US
CR
IP
T
AC
CE
PT
ED
Figure 2-1. Bathymetric map of the study dune field. The inset shows the position of the dune field in the main channel of the Changjiang River, China. The red line shows the measuring line of aDcp.
2.2.
Data collection
Field observations were made in the South Channel (Figure 2-1) and measurements on a dune field approximately 1.8 km long were taken over a semi-diurnal tidal cycle on 27th July 2013 to see how flow and morphology changed with the tides through time (Figure 2-2). A 1200 kHz RioGrande Workhorse aDcp and an Inner Space 24 kHz Thermal Depth Recorder (TDR, 449M) were deployed on a ship in order to record flow velocities and bathymetry data, respectively. Boat positions were measured by a Differential Global Positioning System (DGPS, Trimble) tied to a local navigation beacon with sub-meter accuracy.
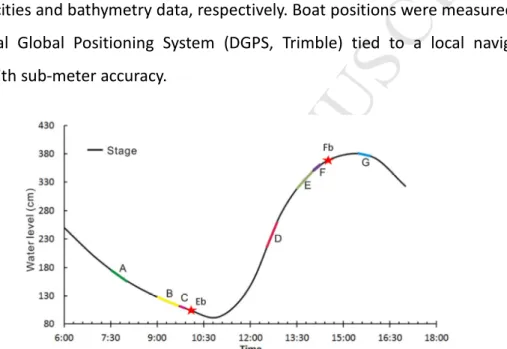
Figure 2-2. River stage at Changxing gauging station during the sampling period; survey periods are marked by letters A-G. The red stars indicate when bed surface sand samples were collected. Eb and Fb mean ebb and flood sample respectively.
Seven surveys were taken and each survey produced continuous, overlapping streamwise transects, grouped into “Lower Falling Tide”, “Low Tide”, “Lower Rising Tide”, “Upper Rising Tide” and “High Tide” according to their location in the tidal cycle, to allow cross-cycle comparisons (Figure 2-2).
M
AN
US
CR
IP
T
AC
CE
PT
ED
Figure 2-3. Mean water depths and transect-averaged current velocity along the transect line.
Table 2-1 summarizes spatially averaged flow velocity <> and flow depth <ℎ > along each transect (Figure 2-4). Measurements started from the Lower Falling stage (Transect A) with mean flow velocity 1.39 m/s, after then <> continued to accelerate during the falling tide (Transects B and C), both peaked at ~1.67 m/s. At the Lower Rising Tide (Transects D), <> reached the lowest value of 0.003 m/s, indicating the occurrence of a slack tide. As the tide rises, <u> increased to 1.19 m/s at the Upper Rising stage (Transect F). The discrepancy between tide and velocity values suggests that variation in velocity lags behind that of tide.
Table 2-1. Descriptive flow and suspended sediment statistics for each transect. Ebb tides were displayed by positive flow velocities. Horizontal resolution of flow data was calculated by / , and is the sampling frequency of aDcp, ca 0.25 Hz.
Tidal stage Transect vboat(m/s) <u> (m/s) <h> (m) Horizontal Resolution (m)
Lower Falling A 1.07 1.39 15.3 5 Low B 0.78 1.67 15.0 3.2 C 2.65 1.67 14.6 12 Lower Rising D 1.55 0.003 15.8 6 Upper Rising E 1.21 -1.06 16.8 4 F 2.4 -1.19 17.0 10 High G 1.3 -0.78 17.5 5
As seven measurements were taken back and forth, some of them went against the current (e.g. A, B, E and G) showing higher resolution which is less than 5 m in the horizontal direction. Experiment C and F were taken along with the tide show a lower resolution, higher than 10 m (Figure 2-2 and Table 2-1). TDR sampling frequency was set at 1 Hz, indicating that horizontal resolution of bathymetry is nearly 2 m.
0.0 0.4 0.8 1.2 1.6 2.0 13 14 15 16 17 18 07:30 09:30 11:30 13:30 15:30 < u > (m /s ) h (m ) Time h U A B C D E F G
M
AN
US
CR
IP
T
AC
CE
PT
ED
Additionally, two bed surface samples were collected via a “cap” type sampler: one during the ebb tide and the other during the flood tide (Figure 2-2). Moreover, a series (29 in total) of water samples across the water column were also taken via 600-ml glass bottles. They were further analysed in the laboratory at East China Normal University.
2.3.
Bedform characteristics calculation
An open source MATLAB software, the “bedform tracking tool” proposed by van der Mark and Blom [2007] was employed here to assess bedform features. In this software, the subjective code has been avoided as much as possible, ensuring it is applicable to various data sets [van der Mark et al., 2008]. Individual bedform height,
Hi, were determined as elevation changes from troughs to downstream crests,
respectively, while individual length, Li, was calculated from the inter-crest distance.
Finally, these individual values were averaged to compute the spatially averaged values (H and L).
2.4.
Suspended sediment concentration evaluated with aDcp
backscatter
During the past decade, acoustic backscatter intensity of aDcp has been recognized as a surrogate approach to monitoring suspended sediment concentrations [Sassi et al., 2012; Latosinski et al., 2014]. However, this method is highly site-specific and displays seasonal dependence, as acoustic signal attenuation is sensitive to particle size, size distribution, shape mineralogy and concentration [Topping et al., 2007;
Guerrero et al., 2013; Guerrero, 2014].
In this study, echo intensity () recorded in counts, according to the calibration
methodology developed by Teledyne [2007], was used to present the corrected results for only water absorption:
= · + 20 !"# + 2$" − 10 · !
'()*
+, -# 2-1
where - means beam angle (20°); '()* is the transmit length; $ indicates sound
M
AN
US
CR
IP
T
AC
CE
PT
ED
127.3/!Te + 273# where 45 is the temperature (in °C). " is a function of 6, '()*
and cos -:
" =6 + 0.5'()*
+, - 2-2
where 6 presents the range from the transducer to the middle of the bin.
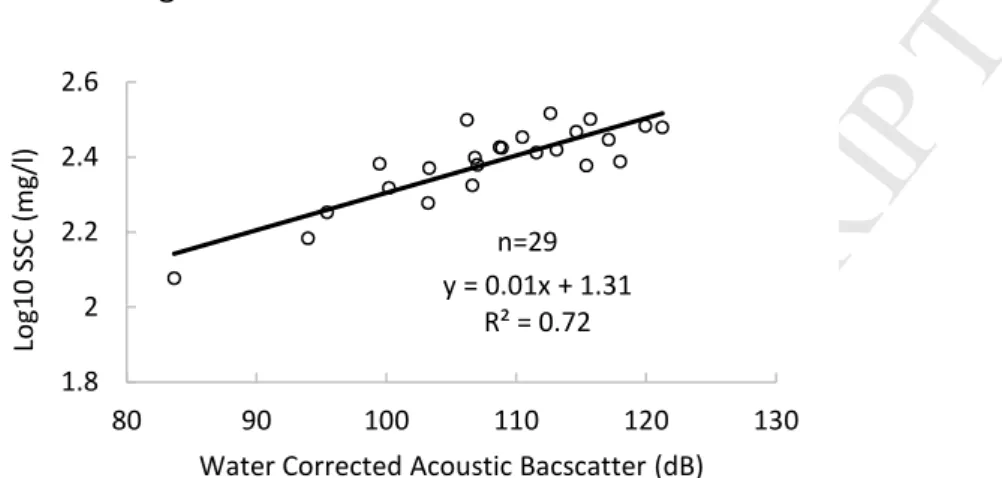
Figure 2-4. Correlation between suspended sediment concentration and water corrected acoustic backscatter.
Gartner [2004] proposed the form of the relation between the concentrations and
based on the equation for sound scattering from small particles:
!;;# = < + = · 2-3
where < and = are regression-determined constants. Therefore, in order to convert the acoustic backscatter intensity into a concentration, measured sediment concentrations are needed. A series of bulk samples were taken through the water column, meanwhile contiguous acoustic backscatter was recorded. A total of 29 concurrent measurements of suspended sediment concentration were used to build the relationship with backscatter intensity (Figure 2-4).
2.5.
Examination of hydro- and sediment- dynamics
Velocity, as measured with aDcps, should be corrected by removing the boat speed (e.g. aDcp speed) referenced to the DGPS (>) and bottom tracking (), both of which can be directly extracted from Winriver II [Rennie, 2002; Muste et al., 2004]. In a mobile bed situation, correcting velocity via bottom tracking may produce bias [Rennie and Villard, 2004], therefore, the DGPS was chosen as the reference.
y = 0.01x + 1.31 R² = 0.72 1.8 2 2.2 2.4 2.6 80 90 100 110 120 130 Lo g 1 0 S S C ( m g /l )
Water Corrected Acoustic Bacscatter (dB) n=29
M
AN
US
CR
IP
T
AC
CE
PT
ED
Afterwards, the zero net cross-stream discharge definition [Paice, 1990; Lane et al., 2000] was adopted on Transect B to define the streamwise direction in low tide. The derived direction is about 120°, which is equal to the direction of downstream survey line (Figure 2-1). Flow data for other transects were rotated and converted into this streamwise direction (see Lane et al. [2000] for a detailed explanation).
Additionally, spatially averaged streamwise velocity 〈〉 and corrected backscatter
〈〉 values for entire flow fields were calculated as
〈〉 =∑ ∑ B CD E FD G 2-4 〈〉 = ∑ ∑B CD E FD G 2-5
where GF is the number of horizontal planes, GC is number of vertical planes; G is the
total number of measurements along each transect, and and are the at-a-point
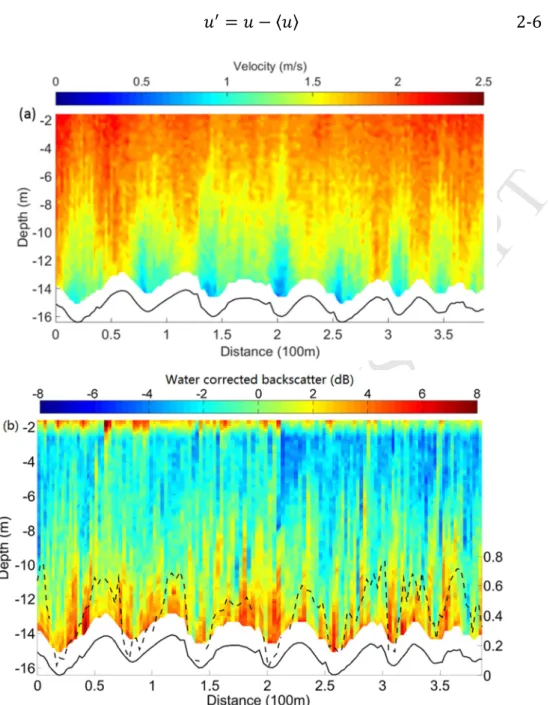
streamwise values. However, spatially averaged values reveal nothing about the structure over the dunes. Bradley et al. [2013] indicated that, as velocity generally increases logarithmically above the bed, two-dimensional plots of flow field over dunes can reveal little about the spatial flow structure, except acceleration over the stoss and deceleration over the lee (Figure 2-5), and calculating the deviation from
〈〉 is a more effective approach to identify spatial patterns. Therefore, the deviation calculated by subtracting 〈〉 were evaluated in this study:
M
AN
US
CR
IP
T
AC
CE
PT
ED
I= − 〈〉 2-6Figure 2-5. Flow (a) and deviation of water corrected backscatter distribution (b) over dunes of Survey b (the largest lee-side angle). The solid lines present the real morphology, while the dashed line in (b) indicates apparent bedload speed distribution.
2.6.
Bedload transport speed
Rennie et al. [2002] firstly proposed that the bottom track records from aDcp measurements, can be used to estimate bedload transport rate in mobile bed, termed apparent bed velocity (K), where:
K = >− 2-7
M
AN
US
CR
IP
T
AC
CE
PT
ED
acoustic pulse length or instrument frequency, and the surrounding circumstances, such as bed material composition. Yet, capturing the distribution of apparent bed velocity over dunes here still could give us significant implications on near-bed sediment dynamics [Latosinski et al., 2017].
2.7.
Standardized method
Previous studies [Best, 1993; Bradley et al., 2013] pointed out that flow structures, sediment transport and dune characteristics over dunes interact in a sophisticated way. The results displayed in Figure 2-5 verify that the discrepancy between morphology and velocity fluctuation near the bed between individual dunes results in assorted hydro- and sediment- dynamics patterns. In order to eliminate individual differences and obtain general flow and sediment dynamics over dunes, data (I, SSC
and K) over each individual dune was extracted, and the vertical and horizontal
dimensions were normalized by water depth and dune length [Bradley et al., 2013]. Afterwards, data over each dune was integrated over the same grid (50 × 50 in x and y axis) and then averaged to obtain standardized results. Consequently, the standardized patterns were used for elaborating and analysing the mechanisms of dune evolution and migration.
2.8.
Hydraulic roughness
In steady subcritical flow, the temporally averaged current velocity ideally displays a logarithmic profile above the bed, called the “Law of the Wall”:
!L# =∗
κ G
L
L 2-8
where !L# presents the time-averaged flow velocity at the height O above the bed, and ∗ is shear velocity, which can be used to calculate shear stress
τ
=ρ
∗P.κ
is thevon Kármán constant (0.4), and O is the roughness length (i.e. the height at which
the follow velocity equals to zero).
M
AN
US
CR
IP
T
AC
CE
PT
ED
GL = GL − !L# ∗⁄κ 2-9However, the presence of bedforms divides the log-linear velocity profile into two parts: the lower layer, which is thought to be controlled by the friction associated with grain roughness, and the upper layer reflecting the total friction, i.e., the combined grain and bedform roughness (see figure 1 in Lefebvre et al. [2011]). Moreover, when several size classes of bedforms were present (e.g., large dunes and superimposed ripples and small dunes), the presence of several log-linear segments was shown to reflect the friction induced by several scaled roughness elements [Smith and McLean, 1977; Lefebvre et al., 2013]. Notably, during the slack tide, the velocity profiles did not follow the log-linear principle, thus survey D was not used to test log-fits.
3.
Results
As it is not easy to keep the survey line straight, the curve of track line may influence the accuracy of dune characteristics. In the following results and discussion section, the analysis was focused on a 280-meter long area, where the dunes are the largest along tracking lines and all of these seven track lines approximately overlapped each other and are relatively straight.
3.1.
Bed material size
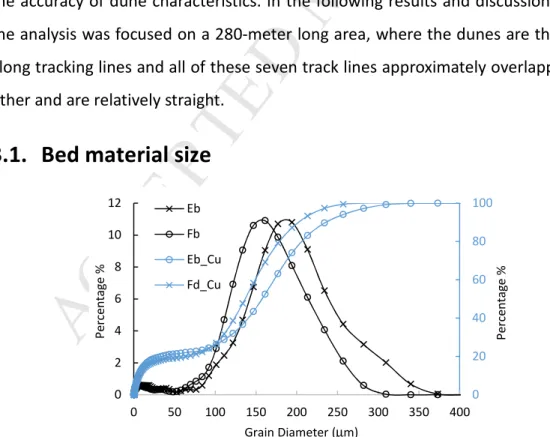
Figure 3-1. Distribution and cumulative (_Cu) distributions of grain size of bed materials for the Ebb tide (Eb) and Flood tide (Fd).
Distribution and cumulative curves of bed materials for both ebb and flood tide
0 20 40 60 80 100 0 2 4 6 8 10 12 0 50 100 150 200 250 300 350 400 P e rc e n ta g e % P e rc e n ta g e % Grain Diameter (µm) Eb Fb Eb_Cu Fd_Cu
M
AN
US
CR
IP
T
AC
CE
PT
ED
within the same tidal cycle were displayed in Figure 3-1. Bimodal patterns are observed, and median grain size of the ebb tide is 157 µm which is 20 µm larger than that of the flood tide. Furthermore, bed mud (< 62.5 µm) and clay (< 8 µm) content does not change with the varying flow, which is ~20 and ~12% respectively. In contrast, part of the very fine sand (62.5 - 125 µm) and fine sand (125 - 250 µm) was suspended into the water column during the ebb tide as a result of high flow velocities.
3.2.
Dune Characteristics
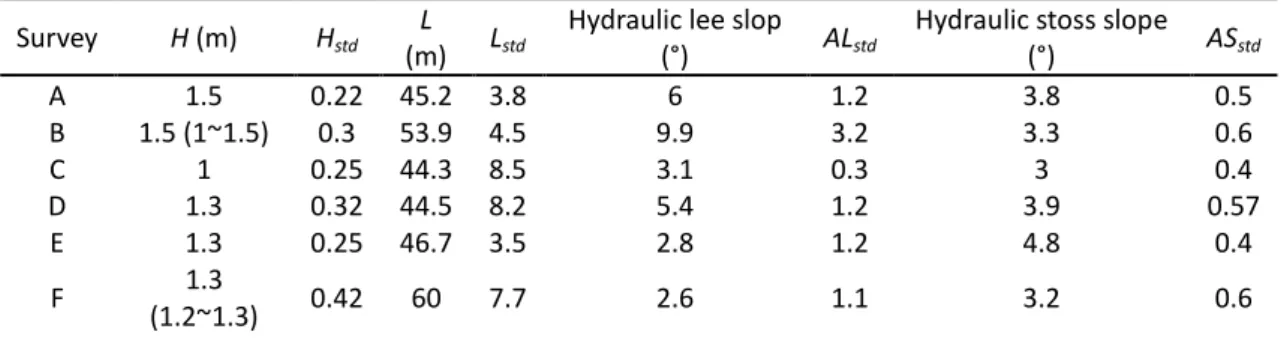
There is no dune planform shape data in this research and little previous research on this in the Changjiang Estuary [Shuwei et al., 2017]. However, for the majority of the survey lines (except survey B and F), the lateral gap between each survey line is less than 5 meters, and the computed dune lengths are relatively constant in line with previous research (e.g. [Hendershot et al., 2016]). Therefore, we speculate that these bedform characteristics reasonably represent the dune geometry, except survey B and F whose results may be slightly affected by the curvature of navigation line. Forthermore, variability in dune height along continuous crestlines might be considerable [Parsons et al., 2005]. The results of survey B (e.g. height, lee-side and stoss-side angle) showed a considerable discrepancy with that of survey C (Table 3-1). However, these two measurements were taken at the relatively similar time, which means that the results should not display great differences. This discrepancy suggests that the calculation of bedform features of survey B is most probably distorted by the curvature of survey line.
Table 3-1. Averaged morphological characteristics of dunes along transects for each survey; the lee-side angle is calculated via the lower lee-side segment, while the stoss-side angle is calculated from trough to crest. The subscript std indicates the standard deviation for each parameter.
Survey H (m) Hstd
L
(m) Lstd
Hydraulic lee slop
(°) ALstd
Hydraulic stoss slope
(°) ASstd A 1.5 0.22 45.2 3.8 6 1.2 3.8 0.5 B 1.5 (1~1.5) 0.3 53.9 4.5 9.9 3.2 3.3 0.6 C 1 0.25 44.3 8.5 3.1 0.3 3 0.4 D 1.3 0.32 44.5 8.2 5.4 1.2 3.9 0.57 E 1.3 0.25 46.7 3.5 2.8 1.2 4.8 0.4 F 1.3 (1.2~1.3) 0.42 60 7.7 2.6 1.1 3.2 0.6
M
AN
US
CR
IP
T
AC
CE
PT
ED
G 1.2 0.2 44.9 4.1 2.9 1.5 4.7 0.4Bedform length nearly kept constant (~45 m) within the tide. In contrast, bedform height decreased to the lowest (1 m) near low tide when flow velocity was the largest, and increased to 1.3 m during the flood tide. Furthermore, the hydraulic lee-side slope was less than 10°, indicating that dunes are with low-angle (Table 3-1).
3.3.
Flow and sediment dynamics
Although the lee-side angle of the individual dunes is higher than 10° (Table 3-2), which can produce intermittent separated flow [Paarlberg et al., 2009], no separated flow occurred during the surveys. The separation zone may be located near the bottom of the lee-side and trough where it is difficult to detect, due to the presence of blanking zone in the aDcp data caused by side-lobe effect. Additionally, the diameter of the area that the aDcp measures, ~11 m (water depth is nearly 15 m), is larger than the length of flow separation zone which is about 4 times of bedform height (i.e. 6 m) [Unsworth, 2015].
These patterns of flow (Figure 2-5) are similar to those documented in past studies of flow over angle-of-repose dunes [Nelson et al., 1993; Bennett and Best, 1995;
McLean et al., 1996; Parsons et al., 2005]. Therefore, although flow separation is not present in the lee side, their topographic forcing of flow (expansion flow) contributes to similar broad scale patterns of flow acceleration and deceleration [Best and Kostaschuk, 2002].
The flow data resolution (>10 m) of survey C and F, whose navigation direction is consistent with flow direction, is relatively low (Table 2-1), indicating that only 4 - 5 vertical profiles were collected over each dune whose length is ca 50 m. The resolution is not high enough to support detailed flow analysis, thus these two surveys were removed in the flowing further analysis.
M
AN
US
CR
IP
T
AC
CE
PT
ED
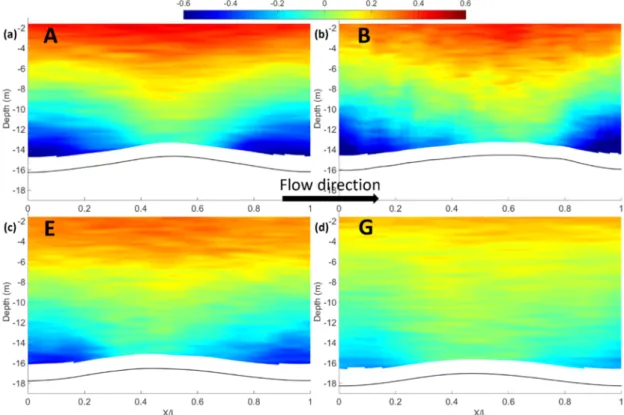
Figure 3-2. Standardized deviation of streamwise velocity from the mean velocity of the entire flow field: a) survey A, b) survey B, c) survey E and d) Survey G. Flow direction is from left to right, therefore, bedform profiles were reversed in c and d, i.e. lee-side for c and d becomes stoss-side. Unit of colour bar is m/s.
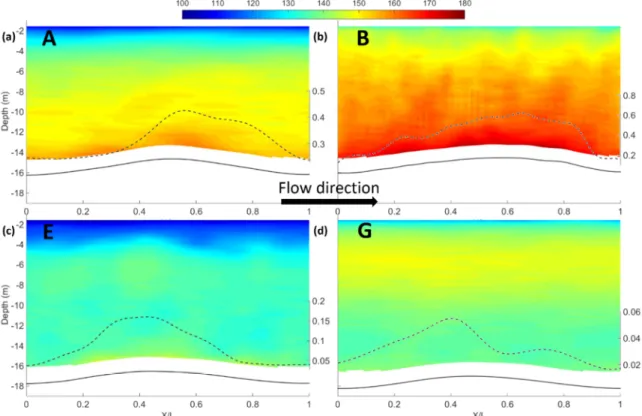
Differences in the standardized flow structure and sediment transport within a tidal cycle are displayed in Figure 3-2 and Figure 3-3. At lower falling tide stage, as dunes are quite symmetric, flow structure over dunes displays a relatively symmetric pattern (Figure 3-2a). In contrast, the distribution of suspended sediment concentration (especially near the bed) and apparent bedload speed show opposite biased trends. Concentration over the stoss-side is relatively larger, while bedload speed over lee-side is greater (Figure 3-3). At low tide, flow velocity nearly reaches the maximum (Figure 2-3b) and the maximum near-bottom velocity increases downstream (Figure 3-2b). Suspended sediment is fully developed and high suspension develops across the whole water column over the entire bedform profile (Figure 3-3b). Moreover, high bedload speeds cover the whole bedform profile except the trough.
M
AN
US
CR
IP
T
AC
CE
PT
ED
Figure 3-3. Standardized suspended sediment concentration and bedload transport speed distribution (the dashed lines): a) survey A, b) survey B, c) survey E and d) Survey G. Unit of the colour bar and the dotted line is mg/L and m/s. Note that the scale of bedload transport speed differs between subplots, in order to more clearly present their distribution over dunes.
During the upper rising stage, bedform profile is still slightly asymmetric, consistent with the bias of lower part of the flow field (Figure 3-2c) and both sediment concentration and bedload speed are much lower than those of ebb tide (Figure 3-3c). At the high tide, bedform profile evolves to become symmetric again, and the lower part of flow field displays relatively small variations. Moreover, bedload speed (Figure 3-3d) drops to a very low level (<0.05 m/s).
3.4.
Spatially average velocity profile over each individual
dune within every survey
According to Figure 2-5, it is clear that there are considerable discrepancies in morphological characteristics among each individual dune, such as lee-side angle and height, especially during the ebb tide. Therefore, both of morphology of each individual dune within survey A, B, E and G (these four surveys are with higher resolution) and corresponding shear stress and roughness length were calculated via the Law of the Wall (see Table 3-2 and Table 3-3).
M
AN
US
CR
IP
T
AC
CE
PT
ED
The roughness length, calculated from the upper part of the spatially averaged velocity profiles over each individual dune, represents the total roughness length, i.e. the sum of skin friction, form resistance from the superimposed and primary dunes [Villard and Kostaschuk, 1998]. The grain roughness, derived from the lower part of the velocity profile was ignored, because it is generally more than one order of magnitude smaller than the bedform roughness, and the lower part of velocity obtained from aDcp does not extend sufficiently close to the bed to estimate skin friction [Villard and Kostaschuk, 1998].
Table 3-2. Summary of the individual dunes during the rising stage of ebb tide.
Ordinal A B Lee-side angle (°) Stoss-side angle (°) τ (N/m2) Z0 (m) Lee-side angle (°) Stoss-side angle (°) τ (N/m2) Z0 (m) 1 7 4.6 32.4 0.27 5.1 3.4 22.5 0.06 2 7 3.3 28.9 0.21 15 2.7 25.6 0.12 3 6.9 3.8 25.6 0.2 11.9 2.5 22.5 0.13 4 6.8 4.2 25.6 0.18 10.7 3.9 22.5 0.08 5 3.9 3.6 25.6 0.2 10.7 3.3 16.9 0.05 6 4.6 3.1 28.9 0.26 6 4.1 16.9 0.04
There is no obvious, general rule for the whole tidal cycle. But during the rising stage of the ebb tide (from survey A to survey B, Table 3-2), velocity increased and both the shear stress,
τ
, and roughness length, O, display a descending trend from 0.22 to0.08 m and from 28 to 21 N/m2. In contrast, during the flood tide (Table 3-3), both
τ
and O show the same decreasing trend from 0.29 to 0.19 and from 20 to 7.3 N/m2,
while velocity increases. The statistical error were on average 11% for roughness length, and 8% for shear stress with little variation [Wilkinson, 1983]. The hydraulic lee-side gets steeper with an increase in velocity and the hydraulic stoss-side slopes gentler in either ebb or flood tide.
Table 3-3. Summary of the individual dunes during flood tide; the lee-side and stoss-side are ebb lee-side and stoss-side respectively.
Ordinal E G Lee-side angle (°) Stoss-side angle (°) τ(N/m 2) Z 0 (m) Lee-side angle (°) Stoss-side angle (°) τ(N/m2) Z0 (m) 1 7.3 3.0 12.9 0.13 6.8 3.1 7.3 0.16
M
AN
US
CR
IP
T
AC
CE
PT
ED
2 5.2 3.1 16.4 0.20 5.5 3.5 7.5 0.18 3 4.6 3.1 26.4 0.44 3.4 3.3 9.1 0.29 4 4.6 3.1 24.4 0.38 4.0 2.9 5.9 0.14 5 3.2 2.0 24.8 0.39 2.5 2.2 7.0 0.20 6 4.3 2.5 17.1 0.20 6.0 2.6 7.1 0.173.4.1.
Velocity profile over different sections of dunes
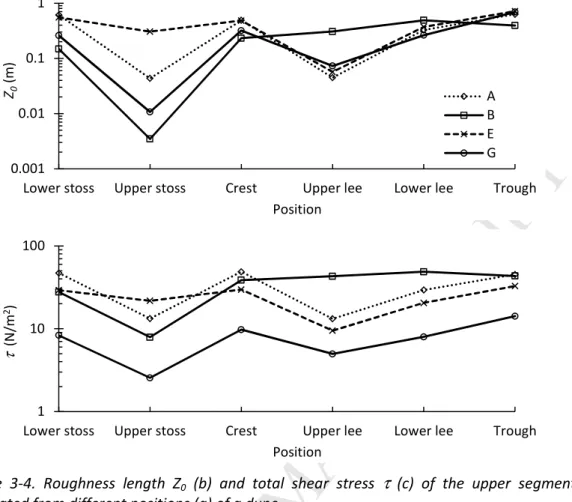
Some research [Kostaschuk and Villard, 1996; Best and Kostaschuk, 2002; Best et al., 2004] has pointed out that the velocity profile showed different patterns over different positions of dunes (e.g. lee-side, trough and crest). Therefore, in order to detail the spatial variation of the velocity profile, a single dune is divided into 6 sections (Figure 3-4a): lower and upper flood lee-side (ebb stoss-side), crest, lower and upper ebb lee-side (flood stoss-side) and trough. The flow velocities above six successive dunes (Table 3-2 and Table 3-3) within the same survey at the six respective positions were averaged, and roughness length and shear stress of upper segments were calculated via Law of the Wall (Figure 3-4b and c). As these dunes are classified as symmetric, low-angle dunes, the delicate difference between downstream lee-side and stoss-side should result in a subtle impact on velocity pattern.
Roughness length of all of these surveys displayed the similar trend: there is a significant decrease over the upper stoss-side and that the magnitude of the decrease varies between surveys (Figure 3-4b). Over the dune lee-side, there are fewer differences between surveys. Moreover, there is also a decrease above the upper lee-side but to less an extent compared with that above the stoss-side. Shear stress shows less pronounced differences between the lee- and stoss-sides, and lowest shear stress occurs during survey G (Figure 3-4c). However, survey B is clearly a little different as higher roughness and shear stress were observed above the lee-side, corresponding to the flow structure bias (Figure 3-2b).
M
AN
US
CR
IP
T
AC
CE
PT
ED
Figure 3-4. Roughness length Z0 (b) and total shear stress τ (c) of the upper segments calculated from different positions (a) of a dune.
3.4.2.
Measured roughness length compared with predicted results
Previous scholars have concluded several equations to calculate roughness length or shear stress related to grain size [Morvan et al., 2008; Ferguson, 2013], bedforms [Van Rijn, 1984; Soulsby, 1997; Bartholdy et al., 2010] and, vegetation [Kadlec, 1990;
Nepf et al., 2007; Luhar et al., 2008]. Roughness lengths related to bedforms predicted by the equations of Soulsby [1997], Van Rijn [1984], and Bartholdy et al.
[2010] were calculated via bedform dimension (Table 3-4).
Table 3-4. Dune roughness predictors.
Authors Equation
Soulsby [1997] O= SP/L
Van Rijn [1984] O= 0.04S!1 − 5UPV/W#, 0.01<H/L<0.2 Bartholdy et al. [2010] O= 0.0019S
From Figure 3-5, both Van Rijn and Bartholdy showed a similar trend – underpredicting roughness length. Roughness lengths predicted via Van Rijn are
0.001 0.01 0.1 1
Lower stoss Upper stoss Crest Upper lee Lower lee Trough
Z0 (m ) Position A B E G 1 10 100
Lower stoss Upper stoss Crest Upper lee Lower lee Trough
τ
(N
/m
2)
M
AN
US
CR
IP
T
AC
CE
PT
ED
slightly higher than those of Bartholdy, although the equation of Van Rijn relates to both bedform height and length, while that of Bartholdy just includes height. The method of Soulsby seems to be the best predictor, as it shows a high positive relationship between 0 and 0.2 m. Furthermore, none of these three equations seems to be able to reasonably predict roughness length when Ocalculated via Law
of the Wall is larger than 0.25 m.
Figure 3-5. Roughness lengths (Z0) measured from spatially averaged velocity profiles (from upper part) compared with those calculated from Soulsby [1997], Van Rijn [1984], and Bartholdy et al. [2010] for the primary bedforms. The dotted line presents the 1:1 line.
3.4.3.
Shear stress estimates from quadratic stress models
The shear stress models of Van Rijn [1984], and Yalin [2015] were used to estimate form stress and skin friction. Both of these two models rely primarily on the quadratic stress equation:
τ= ρXP 3-1
where is drag coefficient and X presents spatially averaged mean velocity over
the entire dune. The Van Rijn and Yalin models use forms of the Chezy coefficient to estimate skin friction and form stress:
τ= !τ#Y+ !τ#∆= [XP\+YP+ [XP⁄+∆P 3-2
where +Y= X ⁄ ∗ = 2.5ln!11 ℎ _⁄ ># is the pure friction of dimensionless Chezy friction factor, _> is granular roughness, +∆ is form-drag components of
dimensionless Chezy friction factor. For Yalin [2015], _> equals to 2 and 0 0.05 0.1 0.15 0.2 0.0 0.1 0.2 0.3 0.4 0.5 P re d ic te d Z0 (m ) Measured Z0(m) Soulsby Van rijn Bartholdy
M
AN
US
CR
IP
T
AC
CE
PT
ED
∆` =P!W#P Wa, while for Van Rijn [1984], _>= 3b and _= 1.1∆!1 − 5UPV/W#.
Figure 3-6. Mean Estimated and Predicted total Shear Stresses (N/m2). The dotted line presents the 1:1 line.
From Figure 3-6, all of the values are concentrated between 5 and 35 N/m2, which shows the same magnitude with the result of Kostaschuk et al. [2004]. Van Rijn seems to predict better than Yalin, while Yalin shows an underestimated trend, compared with total shear stress assessed from velocity profiles.
4.
Discussion
When significant sand transport occurs as bedload, asymmetric dunes generate, whereas symmetric, low-angle dunes develop when most sediment transport is in suspension [Smith and McLean, 1977; Kostaschuk and Villard, 1996]. Dunes in Changjiang estuary, where sediment transport is dominated by suspended sediment, confirms the latter. Furthermore, previous research [Schindler et al., 2015; Baas et al., 2016] has found that the effect of physical cohesion imparted by cohesive clay within mixed sand-mud substrates significantly influences the generation, migration and dimension of bedforms. Schindler et al. [2015] established the inverse linear correlation between clay content and bedform dimensions (bedform height and aspect ratio) based on a series of controlled laboratory experiments. The aspect ratio of bedform in this study varies between 0.02 - 0.03, consistent with their finding that when clay content is 10~12 %. Therefore, both high clay content and significant suspended sediment attribute to the generation of low-angle dunes in the Changjiang Estuary, and the following discussion is conducted based on low-angle
0 5 10 15 20 25 30 0 5 10 15 20 25 30 35 P re d ic te dττττ (N /m 2) Measuredττττ(N/m2)
M
AN
US
CR
IP
T
AC
CE
PT
ED
dunes.4.1.
How does roughness length
Z
0respond to tides?
For flow over bedforms in tidally influenced areas, it is commonly recognized that, in ebb-dominated areas, O(derived from the upper segment) at a site can take two
values, one pertaining to ebb, which is an order of magnitude larger than the one pertaining to flood [Kostaschuk and Villard, 1996; Hoitink et al., 2009; Lefebvre et al., 2011]. That is because, in tidal environments, the primary bedforms usually remain oriented with the direction of dominant flow, while superimposed bedforms may reverse their direction [Ernstsen et al., 2006]. Moreover, Lefebvre et al. [2011] and
Lefebvre et al. [2013] conjectured that the flow separation and recirculation presumably solely occurred over the lee-side of dunes whose downstream slope is above 10° during the ebb, leading to the creation of form drag, while the secondary bedforms dominated the O during the flood. However, dunes in this study have a
low-angle, and there were no secondary bedforms developed over primary dunes [Shuwei et al., 2017]. The downstream slope of the LAD is too gentle to generate significant expansion loss during ebb or flood, thereby, hydraulic roughness associated with the bedforms will be weakened [Hoitink et al., 2009; Paarlberg et al., 2010; Lefebvre et al., 2011].
Hoitink et al. [2009] concluded that, for a given bottom topography, O is generally considered to be independent of velocity magnitude, but related to the orientation of the flow. In tidal environments, flow is inevitably unsteady, resulting in persistent and concomitant alteration of bedform dimension [Ernstsen et al., 2006], thereby, O varies at different tidal stages [Cheng et al., 1999]. However, the symmetry of dune geometry is highly related to the different influence of ebb and flood on flows: for HADs (ebb-orientated), flow structures between ebb and flood tides are relatively different, resulting in differences between roughness lengths [Lefebvre et al., 2013;
Kwoll et al., 2016]. However, for symmetric, low-angle dunes in this study, flow structures between ebb and flood tides are very similar (Figure 3-2), resulting in little variation of O between flood and ebb tides (Table 3-2 and Table 3-3).
M
AN
US
CR
IP
T
AC
CE
PT
ED
Furthermore, flow unsteadiness may contribute to departures from the log-linear velocity profile [Dyer, 1986]. For accelerating flow, the shear stress and roughness length may be subdued, while during the decelerating tide, they could be amplified [Lefebvre et al., 2011]. However, there is not enough evidence to contribute this effect to flow unsteadiness, because roughness length estimation can be also influenced by other impacts, such as suspended sediment concentration [McLean, 1992], and bedform evolution [Lefebvre et al., 2011; van der Zanden et al., 2017].
Fine sediments (most likely the very fine sand according to Figure 3-1) are suspended by greater velocities with higher flow strength, thereby the higher suspended sediment near the bottom and deformation of bedforms directly alters the flow structure around the dunes, i.e. shear stress and flow roughness. Moreover, the result of velocity profiles over different sections reflects that variability of individual bedform characteristics (e.g. lee-side angle) plays an important role in roughness length variations [van der Mark et al., 2008].
4.2.
What are the characteristics of
τ
ττ
τ
over low-angle dunes?
It is commonly recognized that total shear stress can be accurately derived from the depth-slope product. However, it is often difficult to measure, especially in large rivers and estuaries [Villard and Kostaschuk, 1998], and this method is only appropriate for reach-averaged shear stress estimation. When calculating shear stress over dunes, this method becomes unreliable due to the non-uniformity of flow [Hoitink and Hoekstra, 2005; Sime et al., 2007]. Therefore, the quadratic method and velocity gradient were used to estimate total shear stress [Schlichting et al., 1960;
M
AN
US
CR
IP
T
AC
CE
PT
ED
Figure 4-1. Total shear stress calculated over crest and trough compares with that predicted via spatial averages. The X-axis presents spatial averages, and the Y-axis presents crest and trough. The dotted line presents the 1:1 line.
McLean et al. [1999] concluded that, in terms of shear stress estimation, the technique of spatial averaging is better than the method using velocity profiles, but it is still not as accurate as is necessary. Estimation from local velocity profiles over the trough overpredicts total shear stress, while that from the crest fits well with the result of spatial averaging (Figure 4-1). It indicates that although the accuracy of technique of spatial averaging are relevant to bedform characteristics (lee-side angle), flow separation and flow strength [Lefebvre et al., 2016; Lefebvre and Winter, 2016; Kwoll et al., 2017], for low-angle dunes, shear stress over the crest can roughly represent total stress of spatially averaged.
4.3.
How do bedforms evolve with changing flows within a
tidal cycle?
Previous research [Allen, 1976; Hendershot et al., 2016] has concluded that dune height responds more rapidly with the variation of flow than dune length which changes very little during a tidal cycle. Here, bedform characteristics were tracking via the Thermal Depth Recorder, therefore, the accuracy of the statistics highly depends on the accuracy of tracking lines, i.e. some of the variability is probably caused by the deviations in the positions of survey lines [Kostaschuk and Best, 2005]. It is hard to investigate the accurate relationship between bedform features here, but the relatively large variation of dune height and little change of wavelength are still consistent with previous findings.
0 20 40 60 80 100 0 10 20 30 40 p re d ic te d τ (N /m 2) calculatedτ(N/m2) Crest Trough
M
AN
US
CR
IP
T
AC
CE
PT
ED
Sediment deposition and erosion over the tidal cycle lead to changes in bedform characteristics [Hendershot et al., 2016]. The formation of suspension events over low-angle dunes could dominate sediment transport, reaching 70% of the total sediment carried in 50% of the flow [Bradley et al., 2013]. Due to the lack of accurate result of bedform dimension, the evolution of low-angle dunes in the lower Changjiang Estuary evolve across a tidal cycle were illustrated in the following based on flow structure, sediment transport and bedform shape (Figure 3-2, Figure 3-3 and Figure 3-4).
At lower falling tide stage, according to the ratios of dimensionless shields stress to critical shear stress (τ∗⁄τ∗c) [Venditti et al., 2016] and shear velocity to settling velocity (∗/d, i.e. suspension threshold) [Bagnold, 1966; Ferguson and Church, 2004], suspended sediment transport dominates the total sediment transport, as values of τ∗⁄τ∗c are much larger than 33, and value of ∗/d is always greater than 1 [Church, 2006; Yalin, 2015]. Thereby, sediment erosion on the stoss-sides and deposition on the lee-sides lead to the deformation of bedform shape (Figure 3-2a). After hours of ebb flow, at low tide, sediment on the crest was eroded, whichleads to the decrease of bedform height (Table 3-1), verified by the relatively high bedload speed over the crest. Moreover, the suspended sediment concentration increased with flow velocity, with suspended sediment deposited on the trough, leading to the further reduction of dune height [Kostaschuk and Best, 2005; Bradley et al., 2013].
The discrepancy in grain size distribution between flood and ebb tide (Figure 3-1) suggests that part of fine sand was resuspended into the water at high flow and redeposited at low flow. Thus, some of the suspended sediment was deposited over the bedform at low flows during the lower rising stage, which is not captured in this investigation. During the upper rising stage, bedload speed over the flood stoss-side is larger than that over the flood lee-side, indicating that the loosely structured deposits are more likely to deposit on the ebb lee-sides (flood stoss-sides) and troughs (Figure 3-3c). Moreover, they are easier to be entrained (resuspended) again into the flows [Kostaschuk and Best, 2005; Hendershot et al., 2016], reflected by the larger shear stress over the flood stoss-side (Figure 3-4c). Furthermore, the movement of these loose deposits is more likely to stay near the base of the dune, as
M
AN
US
CR
IP
T
AC
CE
PT
ED
it is not detected in Figure 3-3c. At high tide, interactions between flow and sediment are negligible and have little effect on sediment exchange between bedload and suspended sediment, and thereby bedform evolution.
However, the upper part of suspended sediment profile in survey G displays larger concentration than those near the bottom (Figure 3-3d). This is likely due to the common dredging events in the Deep Water Channel located at the downstream of the study area (nearly 10 km). This phenomenon is particularly significant during summers. During the dredging process, highly concentrated water was dumped into water surface near the dredging boats and was transported upstream during the flood tide stages, resulting in higher values of sediment concentration in the upper parts. As a result, there would also be somewhat stochastic effect on dune evolution.
4.4.
How does dune geometry vary with changing flow?
It is widely recognized that an anticlockwise hysteresis correlation exists between dune height (H), aspect ratio (H/L) and mean flow velocity (<u>) [Gabel, 1993;
Dalrymple and Rhodes, 1995; Julien et al., 2002; Wilbers and Ten Brinke, 2003;
Hendershot et al., 2016], while in this study, clockwise hysteresis loops are found (Figure 4-2), consistent with some prior studies (e.g. Kostaschuk and Best [2005]).
Dune length changes little during a tidal cycle, while the variation in dune height responds directly to changes in velocity [Allen, 1976]. Therefore, the variation in dune height dominates the direction of the hysteresis loops [Kostaschuk and Best, 2005]. Previous studies observed that mean dune geometry lags behind the changing flows in sandy beds [Wilbers, 2004; Hendershot et al., 2016]. Those conclusions were made under subcritical conditions when sediment transport over sandy dunes is bedload dominated [Berg, 1987] and dune dimension is proportional to flow strength [Allen, 2009]. However, in the Changjiang Estuary, especially during the flood season with relatively stronger flow strength, both the transformation and migration of dunes are suspended load dominated. As a consequence, the contribution of suspended load to migrating dunes is considerable [Naqshband et al., 2014b]. During the lower falling tide with high flow velocity, fine sand on the upper part of dunes (the crest and upper lee-side and stoss-side) was eroded, and the small bedload
M
AN
US
CR
IP
T
AC
CE
PT
ED
speed lead to the deposition on the trough. This results in the decrease of bedform height at high flow velocities. During the rising tide, the erosion of loosely structured sediment in the trough and deposition on the crest leads to the slight increase of bedform height. Thus, the combination of suspended sediment transport and bedload transport on dune transformation and migration contributes to the clockwise hysteresis. The specific sediment composition of the riverbed affects, to some extent, the mechanism of sediment transport related to the exchange between suspended sediment and riverbed. However, further investigation is needed to figure out the mechanism behind this for extended series of tides, such as spring/neap tide and tides in flooding and dry season.
Figure 4-2. Phase diagram of mean dune height (H) with mean flow velocity (<u>).
5.
Conclusions
The morphological changes and flow and sediment dynamics over a field ca 1.8 km long area during the moderate tide of flood season were examined in a tidal reach of the Changjiang Estuary, China. The dunes composed of fine sediment displayed a relatively symmetric geometry and low-angle lee-sides. Bedform development mechanisms coupled with flow and sediment transport were discussed, and the findings are summarized as follows:
1. Roughness length derived from the law of the wall changes little with the flow reversing, i.e. displaying the same level in both the ebb and flood tide, as dunes are relatively symmetric. The result of velocity profiles over different sections
0.9 1 1.1 1.2 1.3 1.4 1.5 1.6 0 0.5 1 1.5 2 H (m ) <u> (m/s)
M
AN
US
CR
IP
T
AC
CE
PT
ED
reflects that the variability of individual bedform features plays an important role in roughness length variation.
2. Shear stress over the crest of low-angle dunes represents total stress from spatially averaged over dunes in this study area, which has significant implications for advancing numerical models.
3. During the falling tide, as suspended sediment transport dominates the total sediment transport, the stoss-sides are eroded and sediment id deposited on the lee-sides and troughs, resulting in the transformation of dunes.
4. During the rising tide, the loosely structured deposits on the flood stoss-sides are easier to be entrained/resuspended again into the flows but migrate near the bed. Moreover, relatively higher SSC near the surface was observed, and this maybe attributed to frequent dredging events in the Deep Water Channel. As a consequence, there would also be somewhat stochastic effect on dune evolution. 5. Clockwise hysteresis loops are found between dune height, aspect ratio and mean flow velocity. The combination of suspended sediment transport and bedload transport on dune transformation and migration attributes to the clockwise hysteresis. The specific sediment composition of the riverbed affects the mechanism of sediment transport related to the exchange between suspended sediment and riverbed, but further investigation is needed to figure out the mechanism behind this for extended series of tides, such as spring/neap tide and tides in flooding and dry season.
The results elaborate the evolution process of low-angle dunes within a tidal cycle and highlight the complex connections between flows, sediment transport and topography through time in the tidally influenced area composed of fine sediment. This study also emphasises the need for more detailed data on accurate sediment transport and topography, in order to quantify the effect of suspended sediment on dune transformation and migration.
Acknowledgements
M
AN
US
CR
IP
T
AC
CE
PT
ED
(41406096, 41506103).M
AN
US
CR
IP
T
AC
CE
PT
ED
Reference:
Allen, J. (1976), Computational models for dune time-lag: population structures and the effects of discharge pattern and coefficient of change, Sedimentary Geology,
16(2), 99-130.
Allen, J. (1985), Principles of Physical Sedimentology, Allen&Unwin, London, 272. Allen, J. R. L. (2009), River bedforms: progress and problems, Oxford: Blackwell Publishing Ltd.
Baas, J. H., J. L. Best, and J. Peakall (2016), Predicting bedforms and primary current stratification in cohesive mixtures of mud and sand, Journal of the Geological Society,
173(1), 12-45.
Bagnold, R. (1966), An approach to the sediment transport problem, General Physics Geological Survey, Prof. paper.
Bartholdy, J., B. W. Flemming, V. B. Ernstsen, and C. Winter (2010), Hydraulic roughness over simple subaqueous dunes, Geo-Marine Letters, 30(1), 63-76.
Bennett, S., and J. Best (1995), Mean flow and turbulence structure over fixed, two‐ dimensional dunes: Implications for sediment transport and bedform stability,
Sedimentology, 42(3), 491-513.
Berg, J. H. (1987), Bedform migration and bed‐load transport in some rivers and tidal environments, Sedimentology, 34(4), 681-698.
Best, J. (1993), On the interactions between turbulent flow structure, sediment transport and bedform development: some considerations from recent experimental research, Turbulence: Perspectives on Flow and sediment transport, 61-92.
Best, J. (1996), The fluid dynamics of small-scale alluvial bedforms, Advances in fluvial dynamics and stratigraphy, 67-125.
Best, J. (2005), The fluid dynamics of river dunes: A review and some future research directions, Journal of Geophysical Research: Earth Surface (2003–2012), 110(F4). Best, J., and R. Kostaschuk (2002), An experimental study of turbulent flow over a low-angle dune, Journal of Geophysical Research: Oceans, 107(C9), 18-11-18-19, doi:10.1029/2000JC000294.
Best, J., R. Kostaschuk, and R. Hardy (2004), The fluid dynamics of low-angle river dunes: results from integrated field monitoring, laboratory experimentation and numerical modelling, Marine Sandwave and River Dune Dynamics II, University of Twente, Enschede, Netherlands, 17-23.
Biron, P. M., C. Robson, M. F. Lapointe, and S. J. Gaskin (2004), Comparing different methods of bed shear stress estimates in simple and complex flow fields, Earth Surface Processes and Landforms, 29(11), 1403-1415.
Bradley, R., J. Venditti, R. Kostaschuk, M. Church, M. Hendershot, and M. Allison (2013), Flow and sediment suspension events over low-angle dunes: Fraser Estuary, Canada, Journal of Geophysical Research: Earth Surface, 118(3), 1693-1709.
Carling, P., E. Golz, H. Orr, and A. Radecki-Pawlik (2000), The morphodynamics of fluvial sand dunes in the River Rhine, near Mainz, Germany. I. Sedimentology and morphology, Sedimentology, 47(1), 227-252.
Cheng, H., R. Kostaschuk, and Z. Shi (2004), Tidal currents, bed sediments, and bedforms at the South Branch and the South Channel of the Changjiang (Yangtze)
M
AN
US
CR
IP
T
AC
CE
PT
ED
estuary, China: Implications for the ripple-dune transition, Estuaries, 27(5), 861-866. Cheng, H., M. Li, Y. Xue, T. Zhou, and B. Song (2001), High resolution survey on microtopography movement in Yangtze Estuary, Progress in Natural Science, 11(10), 1085-1091.
Cheng, R. T., C. H. Ling, J. W. Gartner, and P. Wang (1999), Estimates of bottom roughness length and bottom shear stress in South San Francisco Bay, California,
Journal of Geophysical Research: Oceans, 104(C4), 7715-7728.
Church, M. (2006), Bed material transport and the morphology of alluvial river channels, Annu. Rev. Earth Planet. Sci., 34, 325-354.
Clifford, N., A. Robert, and K. Richards (1992), Estimation of flow resistance in gravel‐ bedded rivers: A physical explanation of the multiplier of roughness length, Earth Surface Processes and Landforms, 17(2), 111-126.
CWRC (2011), Changjiang Sediment Bulletin, (available at:) http://www.cjh.com.cn/pages/nsgb.html (in Chinese).
Dalrymple, R. W., and R. N. Rhodes (1995), Estuarine dunes and bars, Developments in sedimentology, 53, 359-422.
Dyer, K. (1986), Coastal and estuarine sediment dynamics, Chichester: Wiley.
Ernstsen, V. B., R. Noormets, C. Winter, D. Hebbeln, A. Bartholomä, B. W. Flemming, and J. Bartholdy (2006), Quantification of dune dynamics during a tidal cycle in an inlet channel of the Danish Wadden Sea, Geo-Marine Letters, 26(3), 151-163.
Ferguson, R. (2013), Reach-Scale Flow Resistance in River Channels, Treatise on Geomorphology, 9, 50-68.
Ferguson, R., and M. Church (2004), A simple universal equation for grain settling velocity, Journal of sedimentary Research, 74(6), 933-937.
Field, M. E., C. H. Nelson, D. A. Cacchione, and D. E. Drake (1981), Sand waves on an epicontinental shelf: Northern Bering Sea, Marine Geology, 42(1), 233-258.
Gabel, S. L. (1993), Geometry and kinematics of dunes during steady and unsteady flows in the Calamus River, Nebraska, USA, Sedimentology, 40(2), 237-269.
Gartner, J. W. (2004), Estimating suspended solids concentrations from backscatter intensity measured by acoustic Doppler current profiler in San Francisco Bay, California, Marine Geology, 211(3), 169-187.
Grant, W. D., and O. S. Madsen (1982), Movable bed roughness in unsteady oscillatory flow, Journal of Geophysical Research: Oceans (1978–2012), 87(C1), 469-481.
Guerrero, M. (2014), The investigation of sediment processes in rivers by means of the Acoustic Doppler Profiler, Proceedings of Evolving Water Resources Systems: Understanding, Predicting and Managing Water–Society Interactions, Bologna, Italy: IAHS, 364.
Guerrero, M., R. N. Szupiany, and F. Latosinski (2013), Multi-frequency acoustics for suspended sediment studies: an application in the Parana River, Journal of Hydraulic Research, 51(6), 696-707.
Guy, H. P., D. B. Simons, and E. V. Richardson (1966), Summary of alluvial channel data from flume experiments, 1956-61Rep. 2330-7102.
Hendershot, M. L., J. G. Venditti, R. W. Bradley, R. A. Kostaschuk, M. Church, and M. A. Allison (2016), Response of low‐angle dunes to variable flow, Sedimentology,
M
AN
US
CR
IP
T
AC
CE
PT
ED
Hoitink, A., F. Buschman, and B. Vermeulen (2009), Continuous measurements of discharge from a horizontal acoustic Doppler current profiler in a tidal river, Water resources research, 45(11).
Hoitink, A., and P. Hoekstra (2005), Observations of suspended sediment from ADCP and OBS measurements in a mud-dominated environment, Coastal Engineering,
52(2), 103-118.
Julien, P. Y., G. J. Klaassen, W. B. M. Ten Brinke, and A. W. E. Wilbers (2002), Case study: Bed resistance of Rhine River during 1998 flood, Journal of Hydraulic Engineering, 128(12), 1042-1050.
Kadlec, R. H. (1990), Overland flow in wetlands: vegetation resistance, Journal of Hydraulic Engineering, 116(5), 691-706.
Kleinhans, M. (2005), Phase diagrams of bed states in steady, unsteady, oscillatory and mixed flows.
Kostaschuk, R. A., and J. Best (2005), Response of sand dunes to variations in tidal flow: Fraser Estuary, Canada, Journal of Geophysical Research: Earth Surface (2003– 2012), 110(F4).
Kostaschuk, R. A., and P. Villard (1996), Flow and sediment transport over large subaqueous dunes: Fraser River, Canada, Sedimentology, 43(5), 849-863.
Kostaschuk, R. A., P. Villard, and J. Best (2004), Measuring velocity and shear stress over dunes with acoustic Doppler profiler, Journal of hydraulic engineering, 130(9), 932-936.
Kwoll, E., M. Becker, and C. Winter (2014), With or against the tide: The influence of bed form asymmetry on the formation of macroturbulence and suspended sediment patterns, Water Resources Research, 50(10), 7800-7815.
Kwoll, E., J. Venditti, R. Bradley, and C. Winter (2016), Flow structure and resistance over subaquaeous high‐and low‐angle dunes, Journal of Geophysical Research: Earth Surface, 121(3), 545-564.
Kwoll, E., J. G. Venditti, R. W. Bradley, and C. Winter (2017), Observations of Coherent flow structures over Sub-aqueous high- and low-angle Dunes, Journal of Geophysical Research: Earth Surface, n/a-n/a, doi:10.1002/2017JF004356.
Lane, S., K. Bradbrook, K. Richards, P. Biron, and A. Roy (2000), Secondary circulation cells in river channel confluences: measurement artefacts or coherent flow structures?, Hydrological Processes, 14(11‐12), 2047-2071.
Latosinski, F. G., R. N. Szupiany, C. M. García, M. Guerrero, and M. L. Amsler (2014), Estimation of concentration and load of suspended bed sediment in a large river by means of acoustic Doppler technology, Journal of Hydraulic Engineering, 140(7), 04014023.
Latosinski, F. G., R. N. Szupiany, M. Guerrero, M. L. Amsler, and C. Vionnet (2017), The ADCP's bottom track capability for bedload prediction: evidence on method reliability from sandy river applications, Flow Measurement and Instrumentation. Lefebvre, A., V. B. Ernstsen, and C. Winter (2011), Influence of compound bedforms on hydraulic roughness in a tidal environment, Ocean Dynamics, 61(12), 2201-2210. Lefebvre, A., V. B. Ernstsen, and C. Winter (2013), Estimation of roughness lengths and flow separation over compound bedforms in a natural-tidal inlet, Continental Shelf Research, 61, 98-111.