AAPOR Report on Big Data
AAPOR Big Data Task ForceFebruary 12, 2015
Prepared for AAPOR Council by the Task Force, with Task Force members including: Lilli Japec, Co-Chair, Statistics Sweden
Frauke Kreuter, Co-Chair, JPSM at the U. of Maryland, U. of Mannheim & IAB Marcus Berg, Stockholm University
Paul Biemer, RTI International
Paul Decker, Mathematica Policy Research
Cliff Lampe, School of Information at the University of Michigan Julia Lane, American Institutes for Research
Cathy O’Neil, Johnson Research Labs Abe Usher, HumanGeo Group
Acknowledgement: We are grateful for comments, feedback and editorial help from Eran Ben-Porath, Jason McMillan, and the AAPOR council members.
1
Contents
1. Executive Summary ... 2
2. Background and Purpose of this Report ... 4
3. What is Big Data? ... 5
3.1 Characteristics of Big Data ... 8
3.2 Paradigm Shift ... 10
Summary ... 12
4. Why Big Data Matters ... 13
Summary ... 15
5. The Big Data Process and Data Quality Challenges ... 15
5.1 A Total Error Framework for Big Data ... 18
5.2 Extending the Framework for Big Data ... 20
Summary ... 22
6. What are the Policy, Technical and Technology Challenges, and How Can We Deal with Them? . 22 6.1 Policy Challenge: Data Ownership ... 23
6.2 Policy Challenge: Data Stewardship ... 23
6.3 Policy Challenge: Data Collection Authority ... 24
6.4 Policy Challenge: Privacy and Reidentification ... 24
6.5 Policy Challenge: Meaning of “Reasonable Means” Not Sufficiently Defined ... 25
6.6 Technical Challenge: Skills Required to Integrate Big Data into Opinion Research ... 26
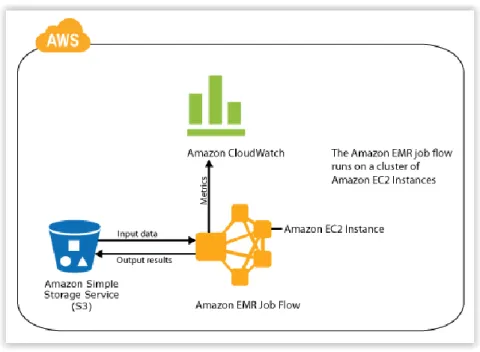
6.7 Technology Challenge: Computational Requirements ... 28
Summary ... 30
7. How can Big Data be Used to Gain Insights? ... 30
7.1 Relative Advantages of Survey Data and Big Data to Support Research ... 32
7.2 Research Methods that Exploit Availability of Big Data ... 34
7.3 Combining Big Data and Survey Data ... 37
Summary ... 39
8. Conclusions and Research Needs ... 39
9. References ... 42
2
1. Executive Summary
In recent years we have seen an increase in the amount of statistics in society describing different phenomena based on so called Big Data. The term Big Data is used for a variety of data as explained in the report, many of them characterized not just by their large volume, but also by their variety and velocity, the organic way in which they are created, and the new types of processes needed to analyze them and make inference from them. The change in the nature of the new types of data, their availability, the way in which they are collected, and disseminated are fundamental. The change constitutes a paradigm shift for survey research. There is a great potential in Big Data but there are some fundamental challenges that have to be resolved before its full potential can be realized. In this report we give examples of different types of Big Data and their potential for survey research. We also describe the Big Data process and discuss its main challenges. The task force recommendations are
summarized below.
1. Surveys and Big Data are complementary data sources not competing data sources. There are differences between the approaches, but this should be seen as an advantage rather than a disadvantage.
Research is about answering questions, and one way to answer questions is to start utilizing all information available. The availability of Big Data to support research provides a new way to approach old questions as well as an ability to address some new questions that in the past were out of reach. However, the findings that are generated based on Big Data inevitably generate more questions, and some of those questions tend to be best addressed by traditional survey research methods.
2. AAPOR should develop standards for the use of Big Data in survey research when more knowledge has been accumulated.
Using Big Data in statistically valid ways is a challenge. One common misconception is the belief that volume of data can compensate for any other deficiency in the data. AAPOR should develop standards of disclosure and transparency when using Big Data in survey research. AAPOR’s transparency initiative is a good role model that should be extended to other data sources besides surveys.
3. AAPOR should start working with the private sector and other professional organizations to educate its members on Big Data
The current pace of the Big Data development in itself is a challenge. It is very difficult to keep up with the research and development in the Big Data area. Research on new technology tends to become outdated very fast. There is currently insufficient capacity in the AAPOR community. AAPOR should tap other professional associations, such as the American Statistical Association and the Association for Computing Machinery, to help understand these issues and provide training for other AAPOR members and non-members.
3 4. AAPOR should inform the public of the risks and benefits of Big Data.
Most users of digital services are unaware of the fact that data formed out of their digital behavior may be reused for other purposes, for both public and private good. AAPOR should be active in public debates and provide training for journalists to improve data-driven
journalism. AAPOR should also update its Code of Professional Ethics and Practice to include the collection of digital data outside of surveys. It should work with Institutional Review Boards to facilitate the research use of such data in an ethical fashion.
5. AAPOR should help remove the barrier associated with different uses of terminology. Effective use of Big Data usually requires a multidisciplinary team consisting of e.g., a domain expert, a researcher, a computer scientist, and a system administrator. Because of the interdisciplinary nature of Big Data, there are many concepts and terms that are defined differently by people with different backgrounds. AAPOR should help remove this barrier by informing its community about the different uses of terminology. Short courses and webinars are successful instruments that AAPOR can use to accomplish this task.
6. AAPOR should take a leading role in working with federal agencies in developing a necessary infrastructure for the use of Big Data in survey research.
Data ownership is not well defined and there is no clear legal framework for the collection and subsequent use of Big Data. There is a need for public-private partnerships to ensure data access and reproducibility. The Office of Management and Budget (OMB) is very much involved in federal surveys since they develop guidelines for those and research funded by government should follow these guidelines. It is important that AAPOR work together with federal statistical agencies on Big Data issues and build capacity in this field. AAPOR’s involvement could include the creation or propagation of shared cloud computing resources.
4
2. Background and Purpose of this Report
The American Association for Public Opinion Research (AAPOR) is a professional
organization dedicated to advancing the study of “public opinion,” broadly defined, to include attitudes, norms, values, and behaviors. AAPOR continually works to improve the methods and measures used to collect relevant data, to educate its members as well as policy makers, the media, and the public at large to help them make better use of surveys and survey findings, and to inform them about new developments in the field. It is in this context the AAPOR council saw the pressing need for a report summarizing the discussion and challenges surrounding Big Data for the AAPOR community.
Since AAPOR advocates the highest standards of ethical conduct of survey and opinion research, and promotes best practices in collecting, analyzing, and interpreting (survey) data, this task force report will also have ethical issues in mind when it comes to the use of Big Data and it suggests a way forward for possible guidelines towards best practices and standards when using Big Data by itself or in combination with survey data.
There are many different data quality frameworks that cover quality dimensions besides accuracy. For example, Statistics Canada has its own framework and Eurostat (the European statistical office) has developed a similar framework that all European National Statistical Institutes should adhere to. The European framework consists of the following dimensions, namely relevance, accuracy and reliability, timeliness and punctuality, coherence and
comparability, as well as accessibility and clarity. These dimensions are important also when considering quality of Big Data. One obvious improvement that is also mentioned in our report is that Big Data can have a positive effect on timeliness. The effects on the other quality dimensions will depend on the different Big Data sources and the user needs. Producing statistical output that meets these quality dimensions, should ideally be based on sound methodology, appropriate statistical procedures, an acceptable burden on the
respondents, and cost effectiveness. Methodology and procedures will vary with the data sources used; however, this task force had these principles in mind when creating the report. This report has four objectives:
to educate the AAPOR membership about Big Data (Section 3) to describe the Big Data potential (Section 4 and Section 7) to describe the Big Data challenges (Section 5 and 6) to discuss possible solutions and research needs (Section 8)
This report is only one of many that will be of interest to the AAPOR audience. We want to point readers to a strategic initiative underway at the American Statistical Association to identify models for curriculum development, to engage in professional education, and to
5 engage with external stakeholders1. Similarly, the United Nations2 Secretary-General has asked an Independent Expert Advisory Group to make concrete recommendations on bringing about a data revolution in sustainable development. The United Nations Statistics Economic Commission for Europe started a task team to work out key issues in using Big Data for Official Statistics, and the European Statistical System has put Big Data on their current roadmap for funding and development. Furthermore, we want to point readers to the three AAPOR task force reports on: the use of Social Media, mobile devices for survey research, and nonprobability sampling. All reports touch on related topics, but are distinct enough that reading all three might be necessary to get the full picture. These reports can be accessed on AAPOR’s website.
3. What is Big Data?
The term “Big Data” is an imprecise description of a rich and complicated set of
characteristics, practices, techniques, ethical issues, and outcomes all associated with data. Big Data originated in the physical sciences, with physics and astronomy early to adopt of many of the techniques now called Big Data. Instruments like the Large Hadron Collider and the Square Kilometer Array are massive collectors of exabytes of information, and the ability to collect such massive amounts of data necessitated an increased capacity to manipulate and analyze these data as well.
More recently, large data sources have been mined to enable insights about economic and social systems, which previously relied on methods such as surveys, experiments, and
ethnographies to drive conclusions and predictions. Below are some recent examples. Not all of these might immediately match what people have in mind when they think about Big Data, however, all of them share characteristics of Big Data as presented below (in section 3.1):
Example 1 Online Prices
The MIT Billion Prices Projects, PriceStats3, is an academic initiative using prices collected daily from hundreds of online retailers around the world to conduct economic research. One statistical product is the estimation of inflation in the US. Changes in inflation trends can be observed sooner in PriceStats than in the monthly Consumer Price Index (CPI). Figure 1 shows aggregated inflation series on a monthly basis for the U.S. from 2008 to 2014 where the statistics derived from the PriceStats Index are displayed in orange, overlaid with the CPI estimates in blue. 1 http://magazine.amstat.org/blog/2013/06/01/the-asa-and-big-data/ 2 http://www.undatarevolution.org/ 3 http://bpp.mit.edu/
6 Figure 1. US Aggregated Inflation Series, Monthly Rate, PriceStats Index vs. Official CPI. Accessed January 18, 2015 from the PriceStats website.
Some National Statistical Institutes in Europe are now using internet robots to collect prices from the web or scanner data from retailers as part of their data collection for the CPI (Norberg et al. 2011, ten Bosch and Windmeijer 2014).
Example 2 Traffic and Infrastructure
Big Data can be used to monitor traffic or to identify infrastructural problems. For example, Figure 2 illustrates the number of vehicles on streets in the Netherlands over the course of one day. The graph is based on roughly 100 million records generated through traffic loops. Infrastructure usage can be assessed with the help of these data. Likewise, the City of Boston issued a smart phone application available to anybody, which is designed to automatically detect pavement problems4. Anyone who downloads the mobile app creates data about the smoothness of the ride. According to their website, these data provide the City with real-time information it uses to fix problems and plan long term investments.
4
7 Figure 2. Number of vehicles detected in the Netherlands on December 1, 2011 created by Statistics Netherlands (Daas et al. 2013). The vehicle size is shown in different colors; black is small size, red is medium size and green is large size.
Example 3 Social Media Messages
A consumer confidence index is produced every month by Statistics Netherlands using survey data. The index measures households’ sentiments on their financial situation and on the economic climate in general. Daas and Puts (2014) studied social media messages to see if they could be used to measure social media sentiment. They found that the correlation between social media sentiment (mainly Facebook data) and consumer confidence is very high (see Figure 3).
Social media messages (in this case Twitter data) form the basis of the University of Michigan Social Media Job Loss Index 5, with the goal of generating early predictions of Initial Claims for Unemployment Insurance. The predictions are based on a factor analysis of social media messages mentioning job loss and related outcomes (Antenucci et al. 2014).
5
8 Figure 3. Social media sentiment (daily, weekly and monthly) in the Netherlands, June 2010 - November 2013. The development of consumer confidence for the same period is shown in the insert (Daas and Puts 2014).
3.1 Characteristics of Big Data
In order to know when and how Big Data can be an appropriate technique for social insight, it is important to know more about the different features of Big Data. While there is no
singularly preeminent Big Data definition, one very widely used definition comes from a 2001 Gartner report (Laney 2001, Laney 2012) describing several characteristics of Big Data:
Volume: This refers to the sheer amount of data available for analysis. This volume of
data is driven by the increasing number of data collection instruments (e.g., social media tools, mobile applications, sensors) as well as the increased ability to store and transfer those data with recent improvements in data storage and networking.
Velocity: This refers to both the speed at which these data collection events can occur,
and the pressure of managing large streams of real-time data. Across the means of collecting social information, new information is being added to the database at rates ranging from as slow as every hour or so, to as fast as thousands of events per second.
Variety: This refers to the complexity of formats in which Big Data can exist. Besides
structured databases, there are large streams of unstructured documents, images, email messages, video, links between devices and other forms that create a heterogeneous set of data points. One effect of this complexity is that structuring and tying data together becomes a major effort, and therefore a central concern of Big Data analysis.
9 Others have added additional characteristics to the definition. These include: Variability (inconsistency of the data across time), Veracity (ability to trust the data is accurate), and
Complexity (need to link multiple data sources).
There are many different types of Big Data sources e.g.: 1. Social media data
2. Personal data (e.g. data from tracking devices) 3. Sensor data
4. Transactional data 5. Administrative data
There are different opinions on whether administrative data should be considered to be Big Data or not. Administrative data are usually large in volume, they are generated for a different purpose and arise organically through administrative processes. Also the content of
administrative data is usually not designed by researchers. For these reasons, and because there is a great potential in using administrative data, we will consider it to be in scope for this report. There are a number of differences between administrative data and other types of Big Data that are worth pointing out. The amount of control a researcher has and the potential inferential power vary between different types of Big Data sources. For example, a researcher will likely not have any control of data from different social media platforms and it could be difficult to decipher a text from social media. For administrative data on the other hand, a statistical agency can form partnership with owners of the data and influence the design of the data. Administrative data is more structured, well defined and more is known about the data than perhaps other Big Data sources.
Big Data as “Found” Data
A dimension of Big Data not often mentioned in the practitioner literature, but important for survey researchers to consider is that Big Data are often secondary data, intended for another primary use. This means that Big Data are typically related to some non-research purpose and then re-used by researchers to make a social observation. This is related to Sean Taylor’s distinction between “found vs. made” data (Taylor 2013). He argues that a key difference between Big Data approaches, and other social science approaches, is that the data are not being initially “made” through the intervention of some researcher. When a survey researcher constructs an instrument there are levels of planning and control that are necessarily absent in the data used in Big Data approaches. Big Data sources might have only a few variables as compared with surveys that have a set of variables of interest to the researcher. In a 2011 Public Opinion Quarterly article and a blog post in his former role as director of the U.S. Census Bureau, Robert Groves described a similar difference between organic and designed data (Groves 2011a, Groves 2011b).
In the context of public opinion studies, a survey researcher could measure opinion by prompt responses about a topic that may never naturally appear in a Big Data source. On the other hand, the “found” data of social media are “nonreactive,” or “naturally occurring,” so that a
10 data point, devoid of researcher-manipulation, may be a more accurate representation of a true opinion or behavior. ”Found” data may be a behavior, such as a log of steps drawn from networked pedometers or the previously mentioned recordings of travel patterns, which might be more accurate than what could be solicited in surveys given known problems with recall error (Tourangeau et al. 2000).
While the scale of data often used is what receives prominence, hence the name Big Data, it is actually this “found” nature of the data that is of concern to survey researchers. For example, since the data were not created for research there often are no informed consent policies surrounding their creation, leading to ethical concerns. Additionally, there are statistical concerns with respect to the representative nature of the data. While these are serious concerns covered in more depth later in this report, they are not necessarily fatal to the proposition Big Data can be used to construct social insights (see Section 6).
Data created through administering the tax systems, social programs, and regulation, are also a form of “found” data. They are not created with a specific scientific research question in mind, but rather are the by-product for the respective administrative processes. Just like (certain types of) paradata are created as a by-product of survey data collections. In many instances these administrative data are large in volume, and share the unstructured nature of many other Big Data sources.
3.2 Paradigm Shift
Before considering to the usability and use of Big Data it is worth exploring the paradigm shift happening in the presence of these new data sources. This change in paradigm stems from changes in many factors affecting the measurement of human behavior: the nature of the new types of data, their availability, and the way in which they are collected, mixed with other data sources, and disseminated. The consequences of these changes for public opinion
research is fundamental in both the analysis that can be done and who the analysts might be. While the statistical community has moved beyond survey and even administrative data to begin understanding how to mine data from social media to capture national sentiment, from cellphone data to understand or even predict anti-government uprisings, and from financial data to examine swings in the economy, it is equally important to note that now some data are freely available and usable to anyone who wishes to mesh data points and series together and produce such analyses. With data readily accessible on the internet – this creates opportunities for amateur, rather than professional, data analysts.
The change in the nature of the new type of data is transformative. Its characteristics – its velocity, volume and variety – and the way in which it is collected, mean a new analytical paradigm is open to statisticians and social scientists (Hey et al. 2009). The classic statistical paradigm was one in which researchers formulated a hypothesis, identified a population frame, designed a survey and a sampling technique and then analyzed the results (Groves 2011a). The new paradigm means it is now possible to digitally capture, semantically reconcile, aggregate, and correlate data. These correlations might be effective (Halevy et al.
11 2009, Cukier and Mayer-Schoenberger 2013) or suspect (Couper 2013), but they enable completely new analyses to be undertaken – many of which would not be possible using survey data alone. For example, the new type of analysis might be one that captures rich environmental detail on individuals from sensors, Google Earth, videos, photos or financial transactions. Alternatively, the analysis might include rich and detailed information on unique and quite small subsets of the population (from microbiome data, or websearch logs), or the analysis could be on completely new units of analysis, like networks of individuals or businesses, whose connections can only be captured by new types of data (like tweets, cell phone conversations, and administrative records). As Kahneman (2011) points out, the new measurement can change the paradigm in its own right.
The change in paradigm also means changes in the production of public opinion research. The changes in the way data are processed and the type of skills needed to process the data are driven, in part, by the cost of converting data to usable information. The production process is very different in a Big Data world relative to a survey world. One of the most obvious Big Data advantages is that electronic data gathering is substantially cheaper than surveys. Surveys are inherently expensive, requiring a good deal of labor to collect the data. In contrast Big Data, by relying on computer software, electronic data gathering, while requiring some upfront and maintenance costs, can be much more cost effective. But while Big Data are relatively cheap to collect, they can be expensive to clean and process (see Section 5), requiring a reallocation of the human capital which previously went into designing and sampling to structuring, linking and managing the new types of data.
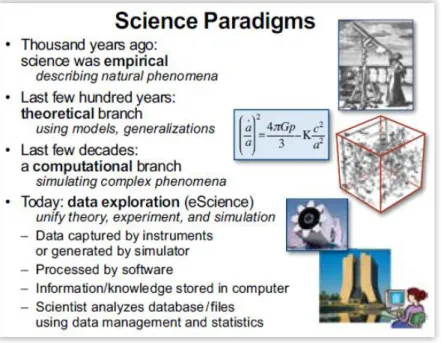
Figure 4. Science Paradigms from Hey et al. (2009).
The change in data ownership has also transformed the way in which data are disseminated. The population of potential data analysts – trained and untrained – has dramatically expanded. This expansion can result in tremendous new insights, as the Sloan Digital Sky Survey and
12 the Polymath project have shown (Nielsen 2012), and is reflected in Grey’s Fourth Paradigm (Figure 4) (Hey et al. 2009), but can also lead to the degradation of the quality of analysis that can be done and issues with the conclusions drawn and reported based on these data. AAPOR as an organization will need to find its place in giving guidance to the proper use of these data with respect to public opinion research.
Finally, the excitement of the change in research paradigm should be tempered by a
recognition that our existing ways of protecting confidentiality are no longer viable (Karr and Reiter 2014). As order and analytical rigor are hopefully brought to the new data frontier, we should ensure that the future structure of data access allows for good science to be attained while protecting the confidentiality of the unsuspecting contributors to this science. There is a great deal of research that can be used to inform the development of such a structure, but it has been siloed into disconnected research areas, such as statistics, cybersecurity,
cryptography, as well as a variety of different practical applications, including the successful development of remote access secure data enclaves. We must piece together the knowledge from these various fields to develop ways in which vast new sets of data on human beings can be collected, integrated, and analyzed while protecting them (Lane et al. 2014). Here too, AAPOR should extend the role it is currently playing, and involve itself in the discussion.
Summary
The term “Big Data” is an imprecise description of a rich and complicated set of characteristics, practices, techniques, ethical issues, and outcomes all associated with data. Examples of Big Data sources are cell phone usage data, web scraping, search queries, sensor and scanner data.
Big Data are sometimes called “found” or “organic data” since they are byproducts from processes whose primary purposes are not survey research.
There are different types of Big Data; social media data, data from tracking devices, sensor data, transactional data and administrative data. The amount of control a researcher has and the potential inferential power vary between the different types of Big Data sources.
There are a number of challenges and concerns regarding the use of Big Data e.g., data access, ethical concerns, storage and methodological issues.
Big Data introduce new ways of measuring human behavior. The change in the nature of the new types of data, their availability, the way in which they are collected, mixed with other data sources, and disseminated is fundamental. It is a change in paradigm for survey research.
AAPOR can play a fundamental role in identifying ways in which vast new sets of data on human beings can be collected, integrated, and analyzed while protecting
13
4. Why Big Data Matters
Personal data have been hailed as the “new oil” of the 21st century (Greenwood et al. 2014), with profound benefits to policy, society, and public opinion research. Detailed data on human beings can be used by policy-makers to reduce crime, improve health delivery and better manage cities (Keller et al. 2012). Society can benefit from these data as well. Recent work shows data driven businesses were 5% more productive and 6% more profitable than their competitors (Brynjolfsson et al. 2011, McAfee and Brynjolfsson 2012). Using data with high volume, velocity, and variety, public opinion researchers can potentially increase the scope of their data collection efforts while at the same time reducing costs, increasing timeliness, and increasing precision (Murphy et al. 2014).
The value of Big Data to each of these groups (policy-makers, businesses, and researchers), the balancing of the benefits and costs, including the risks of using these new data assets, differs for them because the calculus is different for each group. The Big Data benefits to policy-makers have been well and often stated (Lohr 2012, Koonin and Holland 2014). The White House has noted, “Big Data technology stands to improve nearly all the services the public sector delivers” (Executive Office of the President 2014), but the costs of realizing these benefits are nontrivial. As mentioned earlier, even if data collection is cheap, the costs of cleaning, curating, standardizing, integrating and using the new types of data can be substantial (see Section 5). Oftentimes federal, state and local agencies do not have the internal capacity to do such analysis (Pardo 2014), and as a consequence they must make the data available either to consultants or to the research community, requiring the development of access protocols and modalities. Indeed, the federal government, many state governments, and some local government have appointed Chief Data Officers to spearhead these many activities (Griffin 2008, Pardo 2014).
There are also substantial risks associated with replacing traditional data collection methods, one of which is the misallocation of resources. For example, overreliance on Twitter data in deploying resources in the aftermath of hurricanes can lead to the misallocation of resources towards young, internet savvy people with cell-phones and away from elderly or
impoverished neighborhoods (Shelton et al. 2014). But all data collection approaches suffer from similar risks. Poor survey methodology led the Literary Digest to incorrectly call the 1936 presidential elections (Squire 1988). Inadequate understanding of coverage, incentive and quality issues, together with the lack of a comparison group, has hampered the use of administrative records, famously in the case of using administrative records on crime to make inference about the role of death penalty policy in crime reduction (Donohue and Wolfers 2006, Levitt and Miles 2006). But as is the case of traditional data collection methods, it is also important to document these risks under the new approaches in order to address them (see Section 5). Another risk is the alienation of the people on whom the data are gathered. In some areas, there are no clear rules or guidelines governing privacy in this new world in which public and some private actions generate data that can be harvested (Ohm 2010, Executive Office of the President 2014, Strandburg 2014). Similarly, there are no clear data
14 stewards or custodians who can be entrusted to preserving privacy and confidentiality (Lane and Stodden 2013).
The use of Big Data for research purposes also has substantial benefits to society.
Commercial products can be effectively targeted to the right consumers, health interventions can be better designed, and taxpayers may pay less for government services (Lohr 2012). Commercial firms also benefit from lower expenses and greater efficiency (Brynjolfsson et al. 2011, Tambe and Hitt 2012). Challenges include risks that are not well understood and
quantified (Barocas and Nissenbaun 2014). Better crime data can help target police resources, but it can also exacerbate racial tensions (Gelman et al. 2007). More data on possible
terrorists, like the Boston bomber, can aid in quick identification, but can also wrongly identify innocent citizens as terrorists (Tapia et al. 2014). As Acquisti has noted:
“The mining of personal data can help increase welfare, lower search costs, and reduce economic inefficiencies; at the same time, it can be source of losses, economic
inequalities, and power imbalances between those who hold the data and those whose data is controlled. For instance, a firm may reduce its inventory costs by mining and analyzing the behavior of many individual consumers; however, the infrastructure needed to carry out analysis may require substantial investments, and if the analysis is conducted in manners that raise consumers’ privacy concerns, those investments may backfire. Likewise, a consumer may benefit from contributing her data to a vast database of individuals’ preferences (for instance, by sharing music interests with an online vendor, and receiving in turn targeted recommendations for new music to listen to); that same consumer, having lost control over that data, may end up suffering from identity theft, price discrimination, or stigma associated with the information
unintended parties can acquire about her (Acquisti 2014, p. 98).”
The benefits for public opinion researchers are potentially extraordinary. The new type of data collection has been referred to as creating a “fourth paradigm” for science (Hey et al. 2009) and the importance of the intersection between social science and computer science
represented by Big Data analysis has been recognized by major professional associations (Schenker et al. 2013). One clear benefit is that it adds to researchers’ analytical toolkit. In addition to careful hypothesis-driven data collection, the new data have, as Robert Groves (2011a) has pointed out, four common and salient attributes that need to be incorporated into the research mindset: (i) they tend to measure behaviors, not internalized states like attitudes or beliefs; (ii) they tend to offer near real-time records of phenomena; they are highly
granulated temporally; (iii) they tend to be lean in number of variables, many merely having some sort of an identifier and one other variable (e.g., a text tweet, a GPS coordinate); and (iv) they rarely offer well-defined coverage of a large population (we don’t know who isn’t on Facebook, Twitter, Google searches). Developing statistical techniques that exploit the
richness of the data but preserve inference will be critical (Varian 2014), and so is the combination of data sources (see Section 7).
But most interestingly, the new data can change the way researchers think about behavior. For example, they enable capturing of information on a subject’s entire environment offering
15 the potential to understand the effects of complex environmental inputs on human behavior. In addition, some of the Big Data sources enable researchers to study the tails of a distribution in a way not possible with small data (assuming that the data sources do not suffer from self-selection). The tails of the distribution are often the more interesting and hardest to reach parts of the population being studied; consider health care costs for a small numbers of ill people (Stanton 2006), or economic activity and employment by a small number of firms (Jovanovic 1982, Evans 1987).
Summary
The benefits of using Big Data to improve public sector services have been recognized but the costs and risks of realizing these benefits are non-trivial.
Big Data offers entirely new ways to measure behaviors, in near real-time. Though behavioral measures are often lean in variables.
Big Data offers the possibility to study tails of distributions.
5. The Big Data Process and Data Quality Challenges
The massive amounts of very high-dimensional and unstructured data in Big Data bring both new opportunities and new challenges to the data analyst. Many of the problems with Big Data are well-known, with some highlighted previously (in Sections 3 and 4). Big Data is often selective, incomplete and erroneous. New errors can be introduced downstream. Big Data are typically aggregated from disparate sources at various points in time and integrated to form data sets. These processes involve linking records together, transforming them to form new variables, documenting the actions taken and interpreting the newly created features of the data. These activities also introduce errors that may be variable, creating noise and poor reliability, or systematic, leading to bias and invalidity. Thus, using Big Data in statistically valid ways is increasingly challenging, yet exceedingly important for quality inference.
The core issue confronting Big Data veracity is that these data are not generated from instruments and methods designed to produce valid and reliable data amenable to scientific analysis. Rather, as discussed earlier in Section 3, these found data are often byproducts, also sometimes called data exhaust, from processes whose primary purposes do not always align with those of data analysts. There is also a risk of mischief e.g., automated systems can be written to generate content. Consequently, Big Data generators often have little or no regard for the quality of the data flowing from their processes. Therefore, it is the responsibility of
16 Big Data analysts to be keenly aware of the data’s many limitations and to take the necessary steps to limit the effects of Big Data error on their results.
A well-known example of the risks of Big Data error is provided by the Google Flu Trends series which uses Google searches on flu symptoms, remedies and other related key words to provide “near real-time” estimates of flu activity in the U.S. and 24 other countries world-wide. Compared to CDC data, the Google Flu Trends provided remarkably accurate indicators of flu incidence in the U.S. between 2009 and 2011. However, for the 2012-2013 flu seasons, Google Flu Trends predicted more than double the proportion of doctor visits for flu-like symptoms than the CDC (Butler 2013). Lazer et al. (2014) cite two causes of this error: Big Data hubris and algorithm dynamics. The former occurs when the Big Data researcher believes that the volume of the data compensates for any of their deficiencies, thus obviating the need for traditional, scientific analytic approaches. As Lazer et al. (2014:2) note, Big Data hubris fails to recognize that “… quantity of data does not mean that one can ignore
foundational issues of measurement and construct validity and reliability….”
Although explanations vary, the fact remains that Google Flu Trends was too high and by considerable margins for 100 out of 108 weeks starting in July 2012. Lazer et al. (2014) also blames “blue team dynamics” which occurs when the data generating engine is modified in such a way that the formerly, highly predictive search terms eventually failed to work. For example, when a Google user searched on “fever” or “cough,” Google’s other programs started recommending searches for flu symptoms and treatments – the very search terms the algorithm used to predict flu. Thus, flu-related searches artificially spiked as a result of these changes to the algorithm. In survey research, this is similar to the bias induced by interviewers who suggest to respondents who are coughing that they might have flu; then asking the same respondents if they think they might have flu.
Algorithm dynamic issues are not limited to Google. Platforms such as Twitter and Facebook are also frequently being modified to improve the user experience. A key lesson provided by Google Flu Trends is that successful analyses using Big Data today may fail to produce good results tomorrow. All these platforms change their algorithms more or less frequently, with ambiguous results for any kind of long-term study. Recommendation engines often exacerbate effects in a certain direction, but these effects are hard to tease out. Furthermore, other sources of error may affect Google Flu Trends to an unknown extent. For example, selectivity may be an important issue because the demographics of people with internet access are quite different from the demographic characteristics related to flu incidence (see, for example, Thompson et al. 2006). This means that the “at risk” population for influenza and the implied population based on Google internet searches do not correspond. This illustrates just one type of
representativeness issue that often plagues Big Data analysis. In general it is an issue that algorithms are not (publicly) measured for accuracy, since they are often proprietary. Google Flu is special in that it publicly failed. From what we have seen, most models fail privately and often without anyone at all noticing.
Data deficiencies represent only one set of challenges for the Big Data analyst. Other
17 (2014) identify three types of issues they refer to as: (a) noise accumulation, (b) spurious correlations, and (c) incidental endogeneity. These issues should concern Big Data analysts even if the data could be regarded as error-free. Nonsampling errors would only exacerbate these problems.
To illustrate noise accumulation (a), suppose an analyst is interested in classifying individuals into two categories – C1 and C2 – based upon the values of 1000 features (or variables) in a Big Data set. Suppose further that, unknown to the researcher, the mean value for persons in C1 is 0 on all 1000 features while persons in C2 have a mean of 3 on the first 10 features, and a value of 0 on the other 990 features. A classification rule based upon the first m ≤ 10 features performs quite well with little classification error. However, as more and more features are included in the rule, classification error increases because the uninformative features (i.e., the 990 features having no discriminating power) eventually overwhelm the informative signals (i.e., the first 10 features). In the Fan et al. (2014) example, when m > 200, the accumulated noise exceeds the signal embedded in the first 10 features and classification rule becomes equivalent to a coin flip classification rule.
High dimensionality can also introduces spurious correlations (b) in that many unrelated features may be highly correlated simply by chance, resulting in false discoveries and erroneous inferences. For example, using simulated populations and relatively small sample sizes, Fan et al. (2014) show that with 800 independent features, the analyst has a 50% chance of observing an absolute correlation that exceeds 0.4. Their results suggest that there are considerable risks of false inference associated with a purely empirical approach to predictive analytics using high dimensional data.
Finally (c), a key assumption in regression analysis is that the model covariates are
uncorrelated with the residual error. Endogeneity refers to a violation of this assumption. For high dimensional models, this can occur purely by chance – a phenomenon Fan and Liao (2012) call “incidental endogeneity.” Incidental endogeneity leads to the modeling of spurious variation in the outcome variables resulting in errors in the model selection process and biases in the model predictions. The risks of incidental endogeneity increase as the number of
variables in the model selection process grows large. Thus it is a particularly important concern for Big Data analytics.
Fan et al. (2014) as well as a number of other authors (see, for example, Stock and Watson 2002, Fan et al. 2009, Hall and Miller 2009, Fan and Liao 2012) suggest robust statistical methods aimed at mitigating the risks of (a) – (c). However, as previously noted, these issues and more are further compounded when nonsampling errors are introduced into the data. Biemer and Trewin (1991) show that nonsampling errors will bias the results of traditional data analysis and inflate the variance of estimates in ways that are difficult to evaluated or mitigate in the analysis process. Thus, the massiveness and high dimensionality of Big Data combined with the risks of variable and systematic errors requires new, robust approaches to data analysis.
18
5.1 A Total Error Framework for Big Data
Dealing with the risks that nonsampling errors introduce in Big Data analysis can be facilitated through a better understanding of the sources and nature of the errors. Such knowledge is gained through in-depth knowledge of the data generating mechanism, the data processing infrastructure and the approaches used to create a specific data set or the estimates derived from it. For survey data, this knowledge is embodied in a “total survey error (TSE)” framework that identifies all the major sources of error contributing to data validity and estimator accuracy (see, for example, Biemer 2010). The TSE framework also attempts to describe the nature of the error sources and what they may suggest about how the errors could affect inference. The framework parses the total error into bias and variance components which, in turn, may be further subdivided into subcomponents that map the specific types of errors to unique components of the total mean squared error. It should be noted, that while our discussion on issues regarding inference have quantitative analyses in mind, some of the issues discussed here are also of interest to more qualitative uses of Big Data.
For surveys, the TSE framework provides useful insights regarding how the many steps in the data generating and preparation processes affect estimation and inference and may also suggest methods for either reducing the errors at their source or adjusting for their effects in the final data products to produce inferences of higher quality. We believe that a Total Error framework is needed for Big Data. In this section we offer a skeletal view of the framework for a Total Error approach for Big Data. We suggest an approach closely modeled after the TSE framework since, as we will see, a number of error sources are common to both. However, the Big Data Total Error (BDTE) framework necessarily will include additional error sources that are unique to Big Data and can create substantial biases and uncertainties in Big Data products. Like the TSE framework, the BDTE framework will aid in our
understanding the limitations of the data, leading to better-informed analyses and applications of the results. It may also inform a research agenda for reducing the effects of error on Big Data analytics.
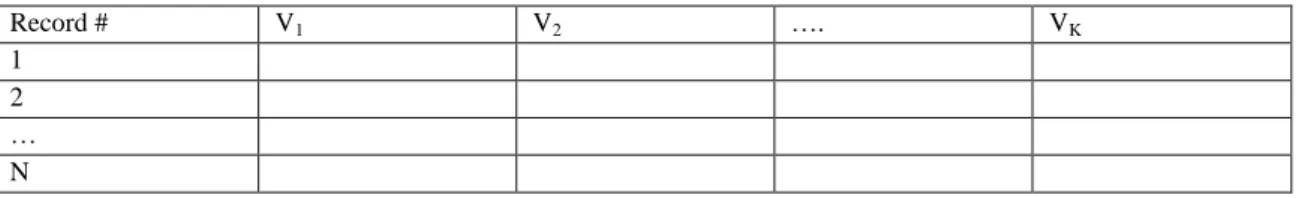
A typical survey data set is shown in Figure 5 as a matrix consisting of some number of rows and columns. Data sets derived from Big Data may also be represented in this way and, thus, will share many of the same properties. In surveys, the rows may be sample or population elements, the columns may be the characteristics of the row elements and the cells contain values of the characteristics for each element. The total error for this data set may be expressed by the following heuristic formula:
Total error = Row error + Column error + Cell error.
Record # V1 V2 …. VK
1 2 … N
19 Row errors may be of three types:
Omissions – some population elements are not among the rows Duplications – some population elements occupy more than one row
Erroneous inclusions – some rows contain elements or entities that are not part of the population of interest
For survey sample data sets, omissions include nonsampled elements in the population as well as population members deliberately excluded from the sampling frame. For Big Data,
selectivity is a common form of omissions. For example, a data set consisting of persons who conducted a Google search in the past week, necessarily excludes persons not satisfying that criterion. Unlike survey sampling, this is a form of nonrandom selectivity. For example, persons who do not have access to the internet are excluded from the file. This exclusion may be biasing in that persons with internet access may have very different demographic
characteristics than from persons who do not have internet access. This problem is akin to non-coverage in sampling, depending on the population about which the researcher is attempting to estimate.
We can also expect that Big Data sets, such as a data set containing Google searches during the previous week, could have the same person represented many times. People who
conducted many searches during that period would be disproportionately represented relative to those who conducted fewer searchers. Other erroneous inclusions can occur when the entity conducting a search is not a person but another computer; for instance, via a web scraping routine.
The most common type of column error is caused by inaccurate or erroneous labeling of the column data – an example of metadata error. For example, a business register may include a column labeled “number of employees” defined as the number of persons in the company that received a payroll check in the month preceding. Instead the column contains the number of persons on the payroll whether they received a check last month or not, including persons on leave without pay. Such errors would seem to be quite common in Big Data analysis given the multiple layers of processing required to produce a data set. For example, data generated from a source, such as an individual Tweet, may undergo a number of transformations before it lands in a rectangular file such as the one in Figure 5. This transformation process can be quite complex; for example, it may involve parsing phrases, identifying words, and
classifying them as to subject matter and then further as to positive or negative expressions about the economy. There is considerable risk that the resulting features are either
inaccurately defined or misinterpreted by the data analyst.
Finally, cell errors can be of three types: content error, specification error, or missing data. A content error occurs when the value in a cell satisfies the column definition but is still
erroneous. For example, value satisfies the definition of “number of employees” but the value does not agree with the true number of employees for the company. Content errors may be the result of a measurement error, a data processing error (e.g., keying, coding, editing, etc.), an imputation error or some other cause. A specification error is just as described for the column
20 error but applied to a cell. For example, the column is correctly defined and labeled; however, a few companies provided values that, although otherwise highly accurate, were nevertheless inconsistent with the required definition. Missing data, as the name implies, is just an empty cell that should be filled. As described in Kreuter and Peng (2014), data sets derived from Big Data are notoriously affected by all three types of cell errors, particularly missing or
incomplete data.
5.2 Extending the Framework for Big Data
The traditional TSE framework is quite general in that it can be applied to essentially any data set that conforms to the format in Figure 5. However, in most practical situations it is quite limited because it makes no attempt to describe the error in the processes that generated the data. In some cases, these processes constitute a “black box” and the best approach is to attempt to evaluate the quality of the end product. For survey data, the TSE framework provides a fairly complete description of the error generating processes for survey data and survey frames (see, for example, Biemer 2010). In addition, there has been some effort to describe these processes for population registers and administrative data (Wallgren and Wallgren 2007). But at this writing, very little effort has been devoted to enumerating the error sources and the error generating processes for Big Data. One obstacle in this endeavor is that the processes involved in generating Big Data are as varied as Big Data are themselves. Nevertheless, some progress can be made by considering the generic steps involved. These steps include the following:
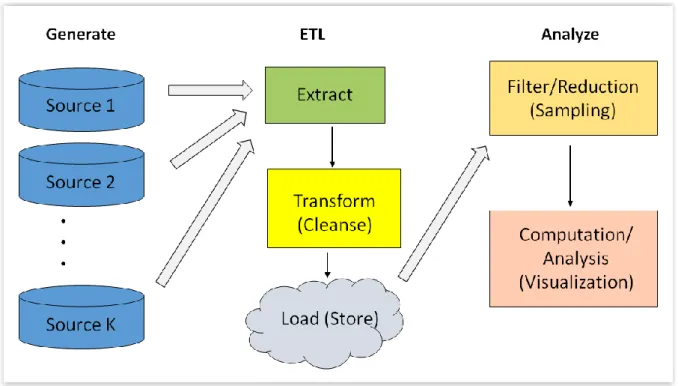
Generate – data are generated from some source either incidentally or purposively.
Extract/Transform/Load (ETL) –all data are brought together under a homogeneous
computing environment in three stages:
o Extract Stage – data are harvested from their sources, parsed, validated, curated and stored.
o Transform Stage – data are translated, coded, recoded, aggregated/disaggregated, and/or edited.
o Load Stage – data are integrated and stored in the data warehouse.
Analyze – Data are converted to information through a process involving:
o Filtering (Sampling)/Reduction – Unwanted features and content are deleted; features may be combined to produce new ones; data elements may be thinned or sampled to be more manageable for the next steps.
o Computation/Analysis/Visualization – data are analyzed and/or presented for interpretation and information extraction.
21 Figure 6. Big data process map
Figure 6 graphically depicts the flow of data along these steps. The severity of the errors that arise from these processes will depend on the specific data sources and analytic goals
involved. Nevertheless, we can still consider how each stage might create errors in a more generic fashion.
For example, data generation error is somewhat analogous to errors arising in survey data collection. Like surveys, the generic data generating process for Big Data can create erroneous and incomplete data. In addition, the data generating sources may be selective in that the data collected may not represent a well-defined population or one that is
representative of a target population of interest. Thus, data generation errors include low signal/noise ratio, lost signals, incomplete or missing values, non-random, selective source and meta-data that are lacking, absent, or erroneous.
ETL processes may be quite similar to various data processing stages for surveys. These may include creating or enhancing meta-data, record matching, variable coding, editing, data munging (or scrubbing), and data integration (i.e., linking and merging records and files across disparate systems). ETL errors include: specification error (including, errors in meta-data), matching error, coding error, editing error, data munging errors, and data integration errors.
As noted above, the analysis of Big Data introduces risks for noise accumulation, spurious correlations, and incidental endogeneity which may be compounded by sampling and
nonsampling errors. Related to the former, data may be filtered, sampled or otherwise reduced to form more manageable or representative data sets. These processes may involve further
22 transformations of the data. Errors include sampling errors, selectivity errors (or lack of representativeness), and modeling errors.
Other errors that may be introduced in the computation stage are similar to estimation and modeling error in surveys. These include modeling errors, inadequate or erroneous
adjustments for representativeness, improper or erroneous weighting, computation and algorithmic errors.
In Section 4 we mentioned that all data collections suffer from error in the data generating process. AAPOR is promoting the transparency of these processes. A similar effort will be very valuable for Big Data driven research.
Summary
Using Big Data in statistically valid ways is challenging. One misconception is the belief that the volume of the data can compensate for any other deficiency in the data (Big Data hubris).
Size often dominates issues of selectivity in public perception.
Many platforms that produce statistics with Big Data change their algorithms (algorithm dynamic). This can lead to ambiguous results for any kind of long term study.
The massive size of Big Data can cause problems such as noise accumulation, spurious correlations, and incidental endogeneity.
Each step in the Big Data process will generate errors that will affect the estimates and each Big Data source will have its own set of errors.
We need to have a Total Error perspective when we consider using a Big Data source. It is the responsibility of Big Data analysts to be aware of the data’s many limitations and
to take the necessary steps to limit the effects of Big Data error on their results.
Many Big Data models currently in use are not measured for accuracy in a public way. So far models tend to fail privately.
AAPORs transparency initiative can be a model for data use beyond surveys.
6. What are the Policy, Technical and Technology
Challenges, and How Can We Deal with Them?
Public opinion research is entering a new era, one in which traditional survey research may play a less dominant role. The proliferation of new technologies, such as mobile devices and social media platforms, are changing the societal landscape across which public opinion researchers operate. As these technologies expand, so does access to users’ thoughts, feelings and actions expressed instantaneously, organically, and often publicly across the platforms they use. The ways in which people both access and share information about opinions,
23 attitudes, and behaviors have gone through perhaps a greater transformation in the last decade than in any previous point in history and this trend appears likely to continue. The ubiquity of social media and the opinions users express on social media provide researchers with new data collection tools and alternative sources of qualitative and quantitative information to augment or, in some cases, provide alternatives to more traditional data collection methods. There is great potential for Big Data to generate innovation in public opinion research. While traditional survey research has a very important role, the addition of large-scale observations from numerous sources (e.g. social media, mobile computing devices) promises to bring new opportunities. To realize these potential advances we must address numerous challenges in a systematic way. This section examines several policy challenges for Big Data (ownership, stewardship, collection authority, privacy protection), technical challenges (multi-disciplinary skills required) as well as technology challenges (computing resources required).
6.1 Policy Challenge: Data Ownership
Many individuals now produce data that are potentially useful for research as part of their everyday participation in the digital world. There has always been a lack of clarity in legal guidance stemming from a lack of clarity as to who owns the data – whether it is the person who is the subject of the information, the person or organization who collects that data (the data custodian), the person who compiles, analyzes or otherwise adds value to the
information, the person who purchases interest in the data, or society at large. The lack of clarity is exacerbated because some laws treat data as property and some treat it as
information (Cecil and Eden 2003). The new types of data make the ownership rules even more unclear: data are no longer housed in statistical agencies, with well-defined rules of conduct, but are housed in businesses or administrative agencies. In addition, since digital data can be alive forever, ownership could be claimed by yet to be born relatives whose personal privacy could be threatened by release of information about blood relations. For the AAPOR community it will be important to stay informed about emerging rules and to be aware of differences in regulations across countries.
6.2 Policy Challenge: Data Stewardship
An eloquent description of statistical confidentiality is “the stewardship of data to be used for statistical purposes” (Duncan et al. 2011). Statistical agencies have been at the forefront of developing that stewardship community in a number of ways. First, on the job training is provided to statistical agency employees. Second, in the United States, academic programs such as the Joint Program on Survey Methodology, communities such as the Federal Committee on Statistical Methodology, and resources such as the Committee on National Statistics have been largely supported by the federal statistical community. In the past the focus was almost exclusively on developing methodologies to improve the analytical use of survey data, and to a lesser extent, administrative data. It is important to expand the training efforts to train scientists in developing an understanding of such issues such as identifying the
24 relevant population and linkage methodologies. Around the US several programs are
emerging. However it is important to integrate the training of these skills into the existing programs, in particular if the field is moving towards data integration from survey and non-survey data (see Section 7).
6.3 Policy Challenge: Data Collection Authority
When statistical agencies were the main collectors of data, they did so under very clear statutory authority with statutory protections. For example, Title 26 (Internal Revenue Service) and Title 13 (Census Bureau) of the US code provided penalties for breaches of confidentiality, and agencies developed researcher access modalities in accordance with their statutory authorization.
The statutory authorization for the new technology enabled collection of data is less clear. The Fourth Amendment to the Constitution, for example, constrains the government’s power to “search” the citizenry’s “persons, houses, papers, and effects.” State privacy torts create liability for “intrusion upon seclusion.” Yet the generation of Big Data often takes place in the open, or through commercial transactions with a business, and hence is not covered by either of these frameworks. There are major questions as to what is reasonably private, and what constitutes unwarranted intrusion (Strandburg 2014). Data generated by interacting with professionals, such as lawyers and doctors, or by online consumer transactions, are governed by laws requiring “informed consent” and draw on the Fair Information Practice Principles (FIPP). Despite the FIPP’s explicit application to “data,” they are typically confined to personal information, and do not address the large-scale data collection issues that arise through location tracking and smart grid data (Strandburg 2014)
6.4 Policy Challenge: Privacy and Reidentification
The risk of reidentifying individuals in a micro-dataset is intuitively obvious. Indeed, one way to formally measure the reidentification risk associated with a particular file is to measure the likelihood that a record can be matched to a master file (Winkler 2005). If the data include direct identifiers, like names, social security numbers, establishment id numbers, the risk is quite high. However, even access to close identifiers, such as physical addresses and IP addresses can be problematic. Indeed, the Health Insurance Portability and Accountability Act (HIPAA) regulations under The Privacy Rule of 2003 require the removal of 18 different types of identifiers including other less obvious identifiers such as birth date, vehicle serial numbers, URLs, and voice prints. However, even seemingly innocuous information makes it relatively straightforward to reidentify individuals, for example by finding a record with sufficient information such that there is only one person in the relevant population with that set of characteristics: the risk of re-identification has been increasing due to the growing public availability of identified data and rapid advances in the technology of linking files (Dwork 2011). With many variables, everyone is a population unique. Since Big Data have wide-ranging coverage, one cannot rely on protection from sampling (Karr and Reiter 2014). Indeed, as Ohm (2010) points out, a person with knowledge of an individual’s zip code,
25 birthdate and sex can reidentify more than 80% of Netflix users, yet none of those are
typically classified as Personally Identifiable Information (PII).
6.5 Policy Challenge: Meaning of “Reasonable Means” Not
Sufficiently Defined
The statutory constraint on agencies such as the IRS and the U.S. Census Bureau makes it clear that the agencies, as data producers should take “reasonable means” to protect data, although these reasonable means are not defined. Trust clearly depends on people’s views on privacy, but these views are changing rapidly (Nissenbaum 2011). Nissenbaum (2011:34) also notes that it is increasingly difficult for many people to understand where the old norms end and new ones begin, as “Default constraints on streams of information from us and about us seem to respond not to social, ethical, and political logic but to the logic of technical
possibility: that is, whatever the Net allows.” Yet there is some evidence that people do not require complete protection, and will gladly share even private information provided that certain social norms are met, similar to what Gerber reported in 2001. There are three factors that affect these norms: actors (the information senders and recipients or providers and users); attributes (especially types of information about the providers, including how these might be transformed or linked); and transmission principles (the constraints underlying the
information flows).
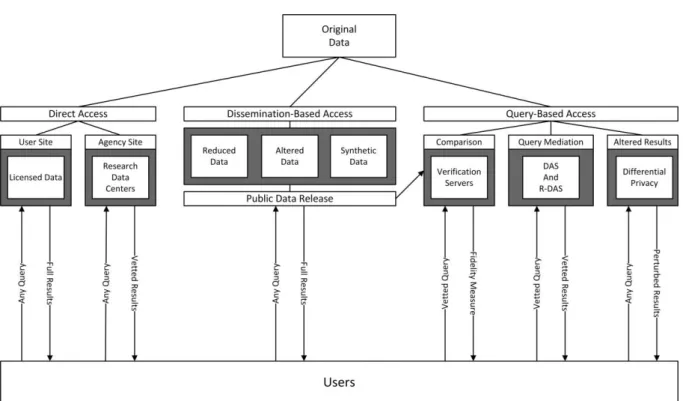
26 What We Can Learn from Current Knowledge
Kinney et al. (2009) identify a variety of mechanisms for interaction between users and confidential data. As they note, in Figure 7 (above) “there are three major forms of
interaction: direct access, dissemination-based access (public data releases), and query-based access. Direct access imposes the least interference between the users and the confidential data. Dissemination-based access refers to the practice of releasing masked data in public files. In the query-based interaction mode, users cannot directly access individual data records, but are able to submit queries, either electronically or manually.” (Kinney et al. 2009:127). Thorough reviews of different approaches are provided in Duncan et al. (2011) and Prada et al. (2011).
The current statistical disclosure literature offers multiple ways of permitting access to microdata, but less relevant guidance about release.
6.6 Technical Challenge: Skills Required to Integrate Big Data
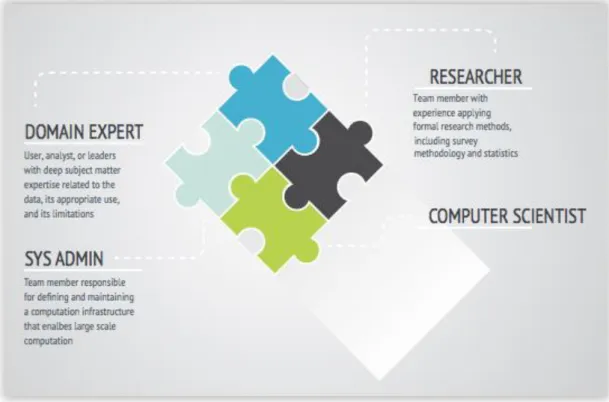
into Opinion Research
Depending on the scale of the data being discussed, there can be significant challenges in terms of the skills and resources necessary to work with Big Data. In particular, most Big Data problems require a minimum of four roles:
● Domain Expert. A user, analyst, or leader with deep subject matter expertise related
to the data, their appropriate use, and their limitations.
● Researcher. Team member with experience applying formal research methods,
including survey methodology and statistics.
● Computer Scientist. Technically skilled team member with education in computer
programming and data processing technologies.
● System Administrator. Team member responsible for defining and maintaining a
computation infrastructure that enables large scale computation.
However, from our experience, many companies are trying to make do with only one person. Domain expertise is particularly important with new types of data that have been collected without instrumentation, usually for purposes other than quantitative survey analysis. For example, looking at Big Data from social media sources requires an in depth understanding of the technical affordances and user behaviors of that social media source. Posting to Twitter, as an example, involves norms and practices that could affect the interpretation of data from that source. This could refer to the use of handles and hashtags, certain terminology and acronyms used, or practices such as retweeting, modifying tweets and favoring. Additionally it is
important to understand to what degree different forms of new media may under-represent particular demographics (e.g. there may be a low number of citizens age 60 years and older using Twitter to express themselves).
27 Foundational research skills such as the application of classical survey methodology and the appropriate use of descriptive statistics remain critical for understanding Big Data. As the volume of digital data grows and the barrier to obtaining such data is continually lowered, there is an increasing risk of untrained engineers and computer programmers finding bogus associations in Big Data. To ensure Big Data are appropriately integrated into public opinion research, there remains an ongoing requirement for classically trained researchers to be involved throughout the entire process.
Figure 8. The different roles needed in a Big Data team
From the computer science skills standpoint, baseline competencies can include the ability to work in command line environments, some capability with programming languages, facility with databases and database languages, and experience with advanced analytical tools. The larger the dataset, the more important skills in databases and analytics become. Some
researchers choose to partner with computer scientists, or skilled programmers, to cover these needed skills. While this has led to viable research partnerships, it creates a new need in terms of interdisciplinary collaboration. Major information technology components that are
frequently used in the process of collecting, storing, and analyzing Big Data include:
● Apache Hadoop. A system for maintaining a distributed file system that supports the
storage of large-scale (Terabytes or Petabytes of content), and the parallel processing of algorithms against large data collections. Requires a programming language such as Java or Python.
● Apache Spark. A fast and general purpose engine for large-scale data processing that
works in support of Hadoop or in-memory databases. Requires a programming language such as Java or Python.