Modeling Driving Behavior
at Single-Lane Roundabouts
Min Zhao
Berichte aus dem DLR-Institut
für Verkehrssystemtechnik
Band 34
Modeling Driving Behavior
at Single-Lane Roundabouts
Von der Fakultät für Maschinenbau
der Technischen Universität Carolo-Wilhelmina zu Braunschweig
zur Erlangung der Würde
einer Doktor-Ingenieurin (Dr.-Ing.)
genehmigte Dissertation
von: Min Zhao
aus: Nei Mongol, China
eingereicht am: 04.01.2018
mündliche Prüfung am: 09.03.2018
Gutachter: Prof. Dr.-Ing. Karsten Lemmer
Prof. Dr.-Ing. Dirk Söffker PD Dr. rer. soc. Meike Jipp
Berichte aus dem DLR-Institut für Verkehrssystemtechnik
Band 34
Modeling Driving Behavior at Single-Lane Roundabouts
Min Zhao
Herausgeber:
Deutsches Zentrum für Luft- und Raumfahrt e. V. Institut für Verkehrssystemtechnik Lilienthalplatz 7, 38108 Braunschweig ISSN: 1866-721X DLR-TS 1.34 Braunschweig, im Januar 2019 Institutsdirektorin: Verfasserin:
Vorwort der Herausgeberin
Liebe Leserinnen und Leser,in Ihren Händen halten Sie einen Band unserer Buchreihe "Berichte aus dem DLR-Institut für Verkehrssystemtechnik". In dieser Reihe veröffentlichen wir spannende, wissenschaftliche The-men aus dem Institut für Verkehrssystemtechnik des Deutschen Zentrums für Luft- und Raum-fahrt e.V. (DLR) und aus seinem Umfeld. Einen Teil der Auflage stellen wir Bibliotheken und Fachbibliotheken für ihren Buchbestand zur Verfügung. Herausragende wissenschaftliche Ar-beiten und Dissertationen finden hier ebenso Platz wie Projektberichte und Beiträge zu Tagun-gen in unserem Hause von verschiedenen Referenten aus Wirtschaft, Wissenschaft und Politik. Mit dieser Veröffentlichungsreihe verfolgen wir das Ziel, einen weiteren Zugang zu wissenschaft-lichen Arbeiten und Ergebnissen zu ermögwissenschaft-lichen. Wir nutzen die Reihe auch als praktische Nachwuchsförderung durch die Publikation der wissenschaftlichen Ergebnisse von Dissertationen unserer Mitarbeiter und auch externer Doktoranden. Veröffentlichungen sind wichtige Meilen-steine auf dem akademischen Berufsweg. Mit der Reihe "Berichte aus dem DLR-Institut für Verkehrssystemtechnik" erweitern wir das Spektrum der möglichen Publikationen um einen Baustein. Darüber hinaus verstehen wir die Kommunikation unserer Forschungsthemen als Beitrag zur nationalen und internationalen Forschungslandschaft auf den Gebieten Automotive, Bahnsysteme und Verkehrsmanagement.
Der vorliegende Band stellt einen datengetriebenen Ansatz zur Erhöhung der Verkehrssicherheit an Kreisverkehren vor. Der Ansatz basiert auf einem empirischen Forschungsparadigma, im Rah-men dessen Fahrdaten sowie Daten von Blick- und Kopfbewegungen im Realverkehr und in der Simulation erhoben wurden. Diese Daten wurden mit Hilfe von Methoden der künstlichen Intelli-genz mit Informationen über das Verhalten anderer Verkehrsteilnehmer und über das geographi-sche Layout des Kreisverkehrs miteinander in Beziehung gesetzt. Darauf aufbauend wurde ein Algorithmus entwickelt und validiert, der insbesondere Daten über den zeitlichen Verlauf der Lenkradbewegung und Daten zum geographischen Layout des aktuellen Kreisverkehrs nutzt, um vorherzusagen, ob die jeweiligen Fahrer den Kreisverkehr bei der nächsten Ausfahrt verlassen oder nicht. Dies gelingt in einer Distanz von bis zu 10 m vor der Ausfahrt in über 95% der Fälle. Diese Quote kann bei einer Individualisierung des Modells noch deutlich früher erreicht werden. Somit erscheint es auch realistisch, mit Hilfe dieses Ansatzes die Verkehrssicherheit an Kreisverkehren zu erhöhen: Fahrer können damit nämlich rechtzeitig vor der Durchführung eines intendierten Abbiegemanövers gewarnt werden, sollte eine Kollision mit einem anderen (schwächeren) Verkehrsteilnehmer drohen.
Acknowledgments of the author
The research presented in this thesis was carried out when I worked at German Aerospace Center (Deutsches Zentrum für Luft- und Raumfahrt, DLR) as a PhD student. In this thesis, the problem of driving behavior prediction at roundabouts was investigated with data driven algorithms, which is an essential component of the advanced driver-assistance systems (ADAS) and could contribute to the future autonomous driving. I am proud to be involved in the big trend of intelligent transportation system (ITS) and make my own contribution. It is my honor here to thank all the people who have supported me in completing this research.
I would like to thank my supervisor Prof. Dr.-Ing. Karsten Lemmer who gave me the chance to undertake my thesis at the Institute of Transportation Systems at DLR. I am grateful for our regular meetings, his encouragement, suggestions as well as the friendly and positive working environment he maintained at our institute.
Further, I express my gratitude to PD Dr. rer. soc. Meike Jipp for her constant support, detailed discussions and practical suggestions for my research and how I should do research in Germany. Many aspects of this work, from measurement conduction to thesis revision, are supported by her. I have learned a lot from her in the last few years. Her professional attitude in scientific work, friendliness, calmness and passion are always exemplary to me.
Also, I would like to thank Prof. Dr.-Ing. Dirk Söffker for being the second referee of this thesis. I have learned a lot with the experience of exchanging at his institute and the discussions with him. With his advice, not only my doctoral work but my writing and presentation skills were improved. Furthermore, I would like to thank Dr.-Ing. Uwe Becker for being the chair of my examination board.
I would also like to thank my colleagues at DLR. In particular, I am grateful to David Käthner for his significant help, from his assistance in measurement even during weekend to his inspiring suggestion during our discussions. His comprehensive knowledge helped me not only with my research, but also various aspects of the German culture. Also, I thank my colleagues Uwe Drewitz, Klas Arne Ihme, Meng Zhang, Björn Hendriks, Paulin Pekezou Fouopi, Eric Nicolay, Dirk Assmann, Fabian Utesch, and Robert Kaul for providing me assistance in my studies and enjoyable working environment throughout the whole time of my PhD.
Finally, I would like to give my special thanks to my family. I thank my parents Yonghong Pei and Pingyuan Zhao for their constant love and their understanding when I seek my way to live the life. Most importantly, I wish to thank my husband Bile Peng for his company at each important moment during my PhD as well as his understanding and encouragement when we seek our way to live the life together.
Contents
Vorwort der Herausgeberin i
Acknowledgments of the author iii
Abstract xiii Kurzfassung xv 1 Introduction 1 1.1 Motivation . . . 1 1.2 Objective . . . 1 1.3 Methodology . . . 2 1.4 Contributions . . . 6 1.5 Outline . . . 7
2 Current State of Driver Maneuver Prediction 9 2.1 Driving Behavior Data . . . 9
2.2 Algorithms . . . 10
2.3 Evaluation . . . 16
2.4 Conclusion . . . 17
3 Scenario Categorization Method 21 3.1 Field Study . . . 22
3.2 Approach to Scenario Categorization . . . 27
3.3 Simulator Study . . . 31
3.4 Method of Scenario Categorization . . . 39
3.5 Summary . . . 44
4 Developing a Model for Driver Maneuver Prediction 47 4.1 Classifier-Based Model . . . 48
4.2 Classifier Training . . . 54
4.3 Reinforcement Learning for a Personalized Model . . . 62
4.4 Summary . . . 64
5 Evaluation and Discussion 65 5.1 Model Evaluation for Feature and Algorithm Selection . . . 66
5.2 Model Evaluation for Traffic Scenarios . . . 80
5.3 Personalized Model Evaluation . . . 87
5.4 Summary . . . 89
6.1 Summary . . . 91 6.2 Conclusions and Contributions . . . 93 6.3 Limitations and Outlook . . . 97
A Evaluation Scores for All Algorithms and Features 99
B Effect Size Results in the Four Scenarios 113
C Box Plots for the Evaluation of the Features and the Algorithms 123
D Outputs of the Soft-Classification Algorithms 131
E Symbols and Acronyms 139
Bibliography 141
List of Figures
Figure 1-1 : Two driver maneuvers in front of an exit of a roundabout. . . 2
Figure 1-2 : Modeling workflow. . . 3
Figure 2-1 : Feature map from a lower dimension to a higher dimension. . . 11
Figure 2-2 : An example of the decision tree. . . 13
Figure 2-3 : Typical hidden Markov structure. . . 14
Figure 3-1 : Driving route in the field study. . . 22
Figure 3-2 : Selection of relevant data. . . 24
Figure 3-3 : A typical erroneous observation at a roundabout. . . 24
Figure 3-4 : Direction of the first and the last yaw vectors of two drives. . . 25
Figure 3-5 : Checking the first/last yaw values to detect the drives with measure-ment errors. . . 26
Figure 3-6 : Drives with measurement errors detected by checking the first/last yaw values. . . 26
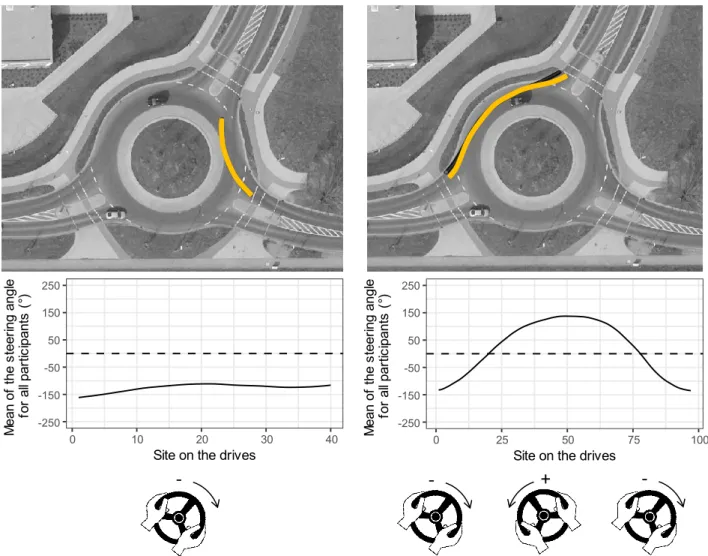
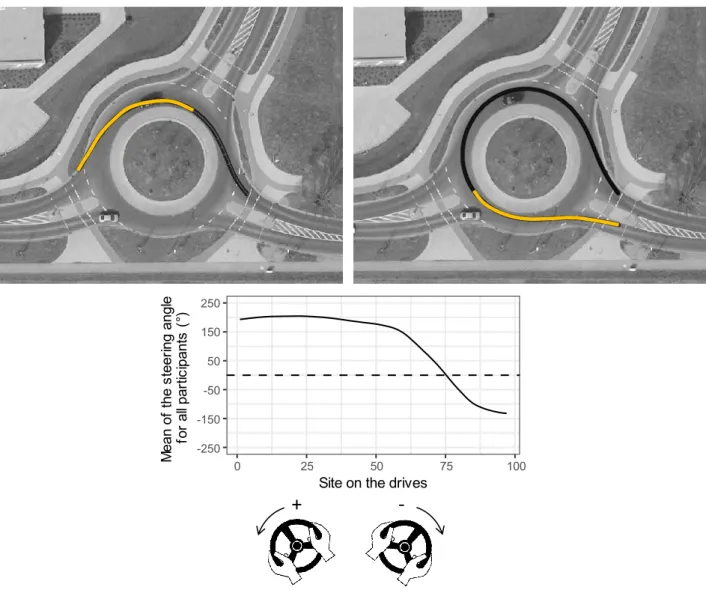
Figure 3-7 : Steering wheel information for the maneuver exiting through the first exit. . . 28
Figure 3-8 : Steering wheel information for the maneuver exiting through the non-first exit. . . 29
Figure 3-9 : Prediction sites and accuracies for three scenarios. . . 32
Figure 3-10 : Fourteen roundabouts with different radii and entry-exit angles. . . 34
Figure 3-11 : Simulation tracks for Session 1. . . 34
Figure 3-12 : Three driver maneuvers at the roundabout. . . 35
Figure 3-13 : Scenarios with different cyclist tracks. . . 36
Figure 3-14 : Simulation tracks for Session 2. . . 37
Figure 3-15 : Four cameras of the eye tracking system. . . 38
Figure 3-16 : Information for the exit that the participants should take. . . 39
Figure 3-17 : Data selection with dashed circle. . . 40
Figure 3-18 : Mean values of steering angles for the drives through the roundabouts. 42 Figure 3-19 : Correlation between the local extremum of steering angle and the inte-grated geometric feature. . . 43
Figure 3-20 : Four ranges for the local extremum of steering angle and the integrated geometric feature. . . 43
Figure 3-21 : Scenario categorization of the roundabouts. . . 45
Figure 4-1 : Positions of the approaching sites. . . 49
Figure 4-2 : Prediction sites for four scenarios. . . 49
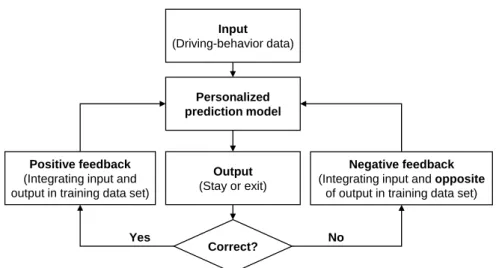
Figure 4-3 : Work flow of the driver maneuver predictive model. . . 50
Figure 4-4 : Prediction procedure when a driver drives through a roundabout. . . . 52
Figure 4-5 : Activated sub-models in the example. . . 53
Figure 4-7 : Quasi-HMM structure. . . 59
Figure 4-8 : Mean values of steering angle from each participant. . . 62
Figure 4-9 : Work flow of the reinforcement learning-based predictive model. . . . 64
Figure 5-1 : Average performance scores of three clusters of features. . . 71
Figure 5-2 : Performance scores of the model trained with logistic-based quasi-HMM and Steering-Motion (The gray areas denote the 95% confidence in-tervals). . . 73
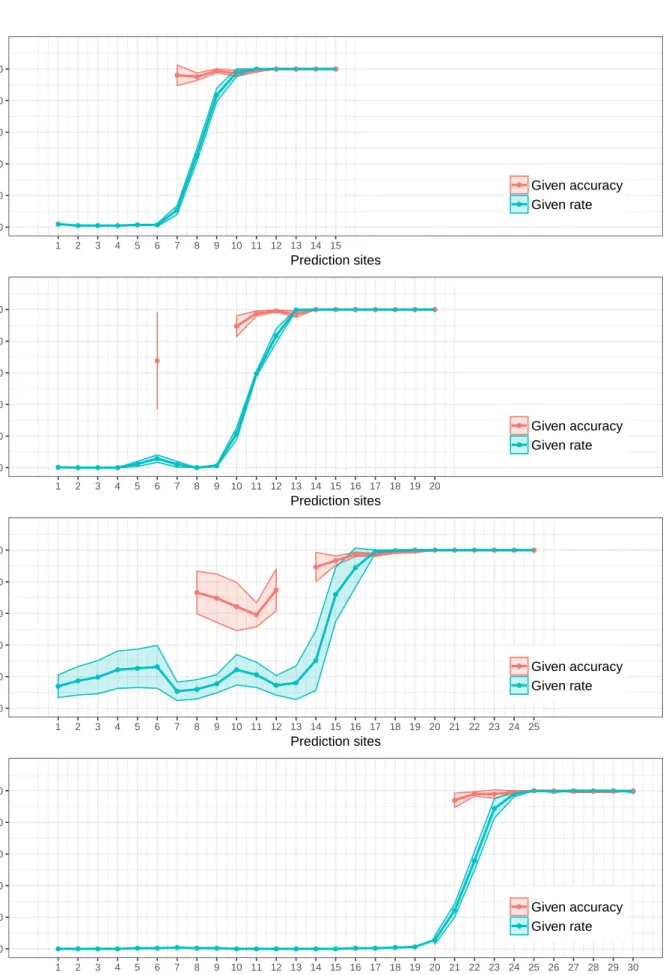
Figure 5-3 : Given rate and given accuracy of the model trained with logistic-based quasi-HMM and Steering-Motion. . . 75
Figure 5-4 : Prediction results of the best algorithm-feature combination. . . 77
Figure 5-5 : Performance score of the without-traffic model and the with-traffic model. 81 Figure 5-6 : Given rate and given accuracy of the with-traffic model. . . 83
Figure 5-7 : Prediction results and the cyclist positions. . . 84
Figure 5-8 : Two different types of driving tracks in the scenario with Traffic 3. . . 86
Figure 5-9 : Given rate and given accuracy for the generalized and the personalized models. . . 88
Figure A-1 : Performance scores of linear SVM-based quasi-HMM with all features. 100 Figure A-2 : Performance scores of Gaussian SVM-based quasi-HMM with all features.101 Figure A-3 : Performance scores of polynomial SVM-based quasi-HMM with all fea-tures. . . 102
Figure A-4 : Performance scores of logistic-based quasi-HMM with all features. . . 103
Figure A-5 : Performance scores of Ada-based quasi-HMM with all features. . . 104
Figure A-6 : Performance scores of RF-based quasi-HMM with all features. . . 105
Figure A-7 : Performance scores of linear SVM with all features. . . 106
Figure A-8 : Performance scores of Gaussian SVM with all features. . . 107
Figure A-9 : Performance scores of polynomial SVM with all features. . . 108
Figure A-10 : Performance scores of logistic regression with all features. . . 109
Figure A-11 : Performance scores of AdaBoost with all features. . . 110
Figure A-12 : Performance scores of random forest with all features. . . 111
Figure C-1 : Box plots of the features over different algorithms in Scenario 1. . . . 124
Figure C-2 : Box plots of the features over different algorithms in Scenario 2. . . . 125
Figure C-3 : Box plots of the features over different algorithms in Scenario 3. . . . 126
Figure C-4 : Box plots of the features over different algorithms in Scenario 4. . . . 127
Figure C-5 : Box plots of the complex algorithms and the simple algorithms in Sce-nario 1. . . 128
Figure C-6 : Box plots of the complex algorithms and the simple algorithms in Sce-nario 2. . . 128
Figure C-7 : Box plots of the complex algorithms and the simple algorithms in Sce-nario 3. . . 129
Figure C-8 : Box plots of the complex algorithms and the simple algorithms in Sce-nario 4. . . 129
Figure D-1 : Soft-decision outputs of linear SVM. . . 131 viii
Figure D-2 : Soft-decision outputs of linear SVM-based quasi-HMM. . . 132
Figure D-3 : Soft-decision outputs of Gaussian SVM. . . 132
Figure D-4 : Soft-decision outputs of Gaussian SVM-based quasi-HMM. . . 133
Figure D-5 : Soft-decision outputs of polynomial SVM. . . 133
Figure D-6 : Soft-decision outputs of polynomial SVM-based quasi-HMM. . . 134
Figure D-7 : Soft-decision outputs of random forest (RF). . . 134
Figure D-8 : Soft-decision outputs of RF-based quasi-HMM. . . 135
Figure D-9 : Soft-decision outputs of AdaBoost. . . 135
Figure D-10 : Soft-decision outputs of AdaBoost-based quasi-HMM. . . 136
Figure D-11 : Soft-decision outputs of logistic regression. . . 136
List of Tables
Table 2-1 : State of the art. . . 18
Table 4-1 : Fifteen possible feature combinations. . . 55
Table 4-2 : Driving experience of participants in the field study. . . 63
Table 5-1 : Top algorithm-feature combinations at Prediction Site 9 in Scenario 1. . 69
Table 5-2 : Prediction results in the four different scenarios. . . 76
Table 5-3 : Prediction results in the scenarios with surrounding cyclists. . . 82
Table 6-1 : State of the art and the results of this thesis. . . 95
Table B-1 : Effect size results at Prediction Site 9 in Scenario 1. . . 113 Table B-2 : Top algorithm-feature combinations at Prediction Site 10 in Scenario 1. 117 Table B-3 : Top algorithm-feature combinations at Prediction Site 11 in Scenario 1. 118 Table B-4 : Top algorithm-feature combinations at Prediction Site 12 in Scenario 1. 118 Table B-5 : Top algorithm-feature combinations at Prediction Site 12 in Scenario 2. 118 Table B-6 : Top algorithm-feature combinations at Prediction Site 13 in Scenario 2. 119 Table B-7 : Top algorithm-feature combinations at Prediction Site 14 in Scenario 2. 119 Table B-8 : Top algorithm-feature combinations at Prediction Site 15 in Scenario 2. 120 Table B-9 : Top algorithm-feature combinations at Prediction Site 17 in Scenario 3. 120 Table B-10 : Top algorithm-feature combinations at Prediction Site 18 in Scenario 3. 120 Table B-11 : Top algorithm-feature combinations at Prediction Site 19 in Scenario 3. 121 Table B-12 : Top algorithm-feature combinations at Prediction Site 20 in Scenario 3. 121 Table B-13 : Top algorithm-feature combinations at Prediction Site 25 in Scenario 4. 121 Table B-14 : Top algorithm-feature combinations at Prediction Site 26 in Scenario 4. 121 Table B-15 : Top algorithm-feature combinations at Prediction Site 27 in Scenario 4. 122 Table B-16 : Top algorithm-feature combinations at Prediction Site 28 in Scenario 4. 122
Abstract
Roundabouts are considered important because converting an intersection into a roundabout has been proven to improve safety. However, the absolute number of crashes at roundabouts is still high. Many crashes occur because car drivers fail to yield. Intelligent systems can increase safety if they can prevent crashes by precisely predicting driver maneuvers. Therefore, a reliable and trustworthy predictive model of driver maneuvers is needed.
A few studies analyze human behavior at roundabouts. However, they focus on an operational timescale rather than on maneuvers on a tactical timescale. Tactical maneuvers have mostly been investigated in scenarios about typical intersections and overtaking. Thus, there is still a lack of research on driver maneuver prediction at roundabouts. To fill this gap, the objective of this thesis is to develop a model that can predict driver maneuvers at single-lane roundabouts. Two types of driver maneuvers are possible in front of each exit of a roundabout: exiting the roundabout and staying in the roundabout. To predict which maneuver a driver will execute in front of an exit, a driver maneuver predictive model was developed on the basis of an analysis of driver behavior data acquired from a field study and a simulator study. Soft-classification algorithms were proposed to train the predictive model. The model consisted of four sub-models for four different scenarios, which were defined by the correlation between roundabout layouts and drivers’ steering behavior. The sub-models make it possible to predict the exiting or staying maneuvers executed in the corresponding scenarios. Furthermore, a personalized predictive model was developed to adapt to individual drivers because different drivers have different driving styles.
The driver maneuver predictive model shows excellent predictability: In the scenarios without traffic, the model reported prediction results for more than 97.60% of test drives at the position 10 m from the exits of the roundabouts. Of these drives, more than 97.10% were predicted correctly. The personalized predictive model provided even better prediction results for individual drivers with significantly different driving styles. Moreover, the driver maneuver predictive model also successfully predicts drivers’ maneuvers in most scenarios with cyclists. The prediction results show that steering angle, steering angle speed, velocity, and acceleration of the ego car provide the most important information. With this information, the model can predict the maneuver of a driver with any type of driving style at a single-lane roundabout with any type of layout.
Kurzfassung
Kreisverkehre gelten als ein wichtiger Bestandteil der Verkehrsinfrastruktur, da ihre Verwendung anstelle von traditionellen Kreuzungen einen wesentlichen Beitrag zur Verkehrssicherheit leistet. Die absolute Anzahl von Unfällen bleibt jedoch auch an Kreisverkehren noch hoch. Viele Kolli-sionen werden dabei durch Missachtung der Vorfahrt verursacht. Intelligente Fahrzeugassisten-zsysteme könnten hier eingreifen, vorausgesetzt sie verfügen über eine zuverlässige Vorhersage des Fahrerverhaltens. Hierfür wird ein robustes und präzises Modell für die Vorhersage von Fahrmanövern im Kreisverkehr benötigt.
Empirische Studien zu menschlichem Verhalten an Kreisverkehren fokussieren in der Regel auf die operationale Ebene der Fahraufgabe, also auf eine zeitlich hoch aufgelöste Zeitskala. Die tak-tische Ebene, auf der Manöver wie “Verlassen des Kreisverkehr” stattfinden, wurde dabei jedoch nicht ausreichend analysiert. Insbesondere fehlen Modelle, die Fahrmanöver im Kreisverkehr vorhersagen. Ziel dieser Arbeit ist es daher, ein solches Modell für einspurige Kreisverkehre zu entwickeln.
Zwei Arten von Manövern sind innerhalb eines einspurigen Kreisverkehrs möglich: Im Kreisel zu bleiben, oder ihn zu verlassen. Um möglichst früh eines der beiden Manöver vorherzusagen wur-den im Rahmen dieser Arbeit verschiewur-dene Modelle entwickelt, welche auf Fahrdaten aus dem Realverkehr sowie Simulationsstudien basieren. Für das Training der jeweiligen Modelle wer-den Soft-Klassifikationsalgorithmen vorgeschlagen, die auf einem Quasi-Hidwer-den-Markov-Modell basieren.
Dieses Modell besteht aus vier Teilmodellen für jeweils vier verschiedene Szenarien, die durch die Korrelation zwischen Kreisverkehrlayouts und Lenkverhalten von Fahrern definiert wurden. Mit den Teilmodellen können die in den entsprechenden Szenarien ausgeführten Manöver "Ver-lassen" oder "Bleiben" vorhergesagt werden. Des Weiteren wurde ein personalisiertes Vorher-sagemodell entwickelt, um sich an den individuellen Fahrer anzupassen, da verschiedene Fahrer unterschiedliche Fahrstile aufweisen.
Das Fahrmanöver-Vorhersagemodell zeigt eine ausgezeichnete Performanz: In den Szenarien ohne Verkehr lieferte das Modell in einem Abstand von 10 m vor der Kreisverkehrsausfahrt Vorhersagen für mindestens 97,60% aller Testfahrten. Von diesen Fahrten wurden wiederum über 97,10% korrekt vorhergesagt. Personalisierte Modelle erreichen noch bessere Vorher-sageergebnisse. Sind weitere Verkehrsteilnehmer in den analysierten Szenarien anwesend liegt die Vorhersagegüte etwas darunter. Die Ergebnisse zeigen, dass Lenkwinkel, Lenkwinkelgeschwindig-keit sowie EigengeschwindigLenkwinkelgeschwindig-keit und -beschleunigung die wichtigsten Informationen liefern. Hier-mit kann das Modell das Manöver eines Fahrers Hier-mit jeder Art von Fahrstil an einem Kreisverkehr mit jeder Art von Layout vorhersagen.
1 Introduction
1.1 Motivation
Roundabouts are considered important because converting an intersection into a roundabout results in fewer injury accidents for both car drivers and pedestrians [Bri11, EHVS09, RPGL01, HV00]. A study by Montella shows that roundabouts reduce the total number of injury crashes by 76% and the total number of fatal crashes by more than 90% compared to signalized in-tersections [Mon11]. However, many crashes with cyclists occur at roundabouts [HOB07]. Roundabouts increase cyclist injury accidents by 27% and fatal accidents by 46% [DNW08]. The most dangerous situations are those in which a) a car enters a roundabout when a cyclist is circulating or b) in which they both circulate in parallel and the car driver exits the round-about [SLSH10]. In almost one-third of the crashes between cars and cyclists, the failure of car drivers to give way is the main contributing factor in terms of road users. For instance, turn signals were used incorrectly in about 20% of all turn maneuvers [Eur08][LKB+13]. Therefore,
an important factor for accidents is when drivers indicate their planned behavior to leave or stay in the roundabout incorrectly, or make incorrect predictions about other road users’ maneuvers. Advanced Driver Assistance Systems (ADASs) can decrease the probability of crashes or miti-gate the damage caused by accidents [HKBL11]. In risky situations, ADASs can assist drivers by warning them of dangers, activating blinkers automatically to warn other road users, or acti-vating the braking system to avoid potential crashes [DMT11]. These systems work efficiently only when they can predict drivers’ upcoming maneuvers correctly and offer appropriate help based on these predictions, otherwise, drivers might feel annoyed by the interference and disable the ADAS [DMT11][HZW12]. Therefore, an ADAS that can effectively mitigate accidents at roundabouts must include a reliable and trustworthy driver maneuver predictive model. This model must be able to predict future driver maneuver of exiting or staying in roundabouts. The prediction result will allow the ADAS to decide whether and how to assist the driver in considering her/his future maneuver.
Predicting driver maneuvers correctly at roundabouts is still an open research question, and is thus the focus of this thesis. Specifically, a model for predicting driver maneuver at generic roundabouts was developed and evaluated in this thesis.
1.2 Objective
The objective underlying this thesis is to develop a driver maneuver predictive model that can predict future driver maneuvers at roundabouts with different layout designs and in different traffic situations for all drivers with their different driving styles. It should be noted that the focus of this thesis is on compact roundabouts, which are defined as roundabouts with a single
1 Introduction
circulating lane and a diameter of 26 - 40 m [Bri11][Hof14]. Two types of driver maneuvers in front of each exit of compact roundabouts are possible: exiting the roundabout or staying in the roundabout (see Figure 1-1). To predict these two maneuvers, the following challenges need to be addressed:
• Identify the driving behavior information that provides indications for the upcoming driver maneuver. Although driver maneuvers cannot be observed before they are executed, cer-tain information (e.g., driving velocity, steering wheel angle) can be used to infer which maneuver a driver is going to execute.
• Identify the effect of different roundabout geometric layouts on driving behavior. Drivers behave differently when driving through roundabouts with different radii and entry-exit angles. Only when the effects of the geometric design on human driver behavior are considered can driving behavior effectively predict driver maneuvers.
• Identify a classification algorithm that can distinguish between pieces of driving behavior data that are related to the two maneuvers.
• Identify a modeling method that can make use of driving behavior and the classification algorithm to predict driver maneuvers in different scenarios in a valid manner.
• Identify an evaluation method to evaluate the performance of the driver maneuver predic-tive model.
Addressing these challenges will allow the objective of developing a driver maneuver predictive model to be achieved.
Exit or stay?
Actual driving route Possible driving route
Exit or stay? Exit or stay?
Figure 1-1: Two driver maneuvers in front of an exit of a roundabout.
1.3 Methodology
Here, the methodology for developing a driver maneuver predictive model is introduced in a general way. The specific details of the methodology are provided in Chapters 3, 4, and 5. 2
1.3 Methodology
Driver maneuvers are both a cause and a consequence of driving behavior. Thus, driving behavior can be used to predict driver maneuvers. However, drivers may behave differently when they drive through roundabouts with different geometric layouts. This is why the effects of roundabout layouts need to be controlled for. Otherwise, driver maneuver can hardly be predicted effectively. Hence, driving behavior data relevant to roundabouts with different layouts were acquired and analyzed to develop an understanding of the effects of the roundabout layout on driving behavior. Then, machine-learning algorithms were used to train classifiers to distinguish between different patterns of driving behavior to understand what maneuvers drivers are going to execute in the immediate future. The workflow of the thesis is presented in Figure 1-2, the details of which are explained in this chapter.
Data acquisition with field study and data
analysis Feature extraction Machine-learning-based model Model evaluation Scenario definition Data categorization
Simulator study design and data acquisition
Data analysis
Figure 1-2: Modeling workflow.
Driving Data Acquisition
A field study was conducted to acquire data about how drivers drive through roundabouts. In this field study, participants drove on a standardized route through compact roundabouts in real traffic with a sensor-equipped experimental car. Each participant drove through every combination of entries and exits in accordance with an experimenter’s instructions. Thus, data on participants’ naturalistic driving behavior were acquired, including steering angle, steering
1 Introduction
angle velocity, acceleration, velocity, yaw, and driver gaze and head direction. The data showed that information about steering wheel behavior is useful for predicting driver maneuvers at the investigated roundabouts [ZKJ+17]. The limitations of the field study were that the driving
behavior was mediated by uncontrolled factors related to surrounding traffic and that driving behavior data were only captured at three roundabouts. To complement these limitations, a simulator study was designed to acquire driving behavior data at more generic roundabouts with varied geometric layouts (in Session 1) and varied traffic situations (in Session 2). In Session 1, two geometric features of roundabout layout design, radius and entry-exit angle, were manipulated experimentally. In Session 2, four types of surrounding cyclists were placed at or near the roundabouts to see how they would affect the participants’ driving behavior. In the simulator study sessions, the participants drove through tracks that had been produced to match the roundabouts with the varied geometric features and the varied traffic discussed above. The following variables were recorded during the two sessions for each scenario:
• Steering angle
• Steering angle velocity • Acceleration
• Velocity • Position • Gaze direction • Head direction
Therefore, relevant driving behavior data were acquired and analyzed. The details of the studies and the analysis are provided in Chapter 3.
Scenario Definition
The driver behavior data acquired from the simulator study were analyzed to identify the impact of roundabout layout on driving behavior. The local extremum of steering angles (θe) and the
integrated geometric feature (Geo) were defined to characterize the steering wheel
informa-tion and the geometric features of roundabouts, respectively. The mathematical correlainforma-tion of these two variables was calculated to define each scenario. Subsequently, a method of sce-nario categorization for roundabouts was proposed using this correlation, so that all scesce-narios at roundabouts could be categorized into four categories. This allows the effect of geometric features of roundabouts on driving behavior to be eliminated in each scenario category. The details of the scenario definition are also provided in Chapter 3.
1.3 Methodology
Modeling
A driver maneuver predictive model was developed for the four scenarios. The model includes four sub-models that correspond to each of the four scenarios. Each sub-model consists of a series of classifiers corresponding to a series of prediction sites. Prediction sites are locations where a prediction is made along the route between the entry and the exit of a roundabout. The information on driving behavior at each prediction site were used to train the corresponding classifier. With the classifiers, two driver maneuvers of test drives at each prediction site were classified. The features and the algorithms used for classifier training are as follows:
• Features for classifier training. The relevant features are those that significantly differ between exiting a roundabout VS. staying in the roundabout. Steering angle and steering angle velocity proved to be important features [ZKJ+17]. The other features, including
acceleration, velocity, and driver gaze and head direction, were also tested. The values for steering angle, steering angle velocity, speed, acceleration, heading direction, and gaze direction at each prediction site were extracted as features for training the classifiers. Different features and different combinations of features provide different predictabilities. Thus, all combinations of features were used as inputs to train the classifiers, and the most important ones were selected.
• Algorithms for classifier training. The algorithms were developed based on those that have proven to be successful in earlier studies (see Chapter 2). Soft-classification algorithms were used because hard-classification algorithms are inappropriate for driver maneuver prediction: hard classifiers output discrete values of "Exiting" or "Staying" when fed with feature data [LZW11], and thus always offer results even when predictability is still weak at the very beginning of drives. In contrast, soft classifiers output continuous values of the likelihood of "Exiting" or "Staying" [LZW11]. This output is known as soft-decision output. Soft classifiers decide whether or not to report the results of "Exiting" or "Staying" with a soft-decision output and an output threshold: The classifiers will not report results if the soft-decision outputs of "Exiting" and "Staying" are lower than the threshold. Thus, the prediction results had three possible stati: correct, incorrect, or not available. In this work, two types of soft-classification algorithms were investigated: simple algorithms and complex algorithms. The simple classification algorithms include support vector machines, random forest, AdaBoost, and logistic regression. The complex algorithms are the algorithms proposed by integrating the hidden Markov model and the above simple algorithms. So, the classifiers were trained with these soft-classification algorithms.
A personalized predictive model was then developed for individual drivers because drivers have different driving styles even in the same roundabout scenario. This model was obtained by updating the original predictive model, which was trained using data about generic drivers, to include the specific driver’s driving data. Details on this process are provided in Chapter 4.
1 Introduction
Evaluation
Evaluation is needed to select the feature and the algorithm with the best performance. Five-fold cross validation was used for the model evaluation, so one-fifth of the driving behavior data are test data for the predictive model. The test data set contained driving samples with the exiting maneuver and samples with the staying maneuver. When the models were tested with these samples, they labeled the samples as "Exiting", "Staying", or "NA (no result available)" using the soft-decision outputs and an output threshold. Traditional evaluation scores for hard classification such as accuracy, F1 score, detection rate, and false alarm rate are not appropri-ate in this case because these scores would treat "no result available" as an incorrect result. Therefore, a unique grading system was proposed to evaluate the soft-decision based models. The basic principle of the grading system is that a correct prediction is the best situation, an incorrect prediction is the worst situation, and no result available is neutral. Following this prin-ciple, the models receive one positive point when they offered a correct prediction result, one negative point when they offered an incorrect prediction result, and zero points when they did not offer a result for a given test drive. However, the scores the models acquired in this way depended not only on the prediction results but also on the number of test drives. Therefore, the points were converted into percentages, so that the scores for all scenarios varied in the same range, from -100 (incorrectly predicting all test drives) to 100 (correctly predicting all test drives). Performance scores were calculated for all combinations of the algorithms and the features at each prediction site in each of the four scenarios.
The performance scores of better models reached 100 at earlier prediction sites, therefore, the prediction sites for which scores were close to 100 were selected as key sites. Performance of the algorithm-feature combinations at each key site in each scenario could be ranked using the comparison method. The rank allowed for the selection of the best feature and the best algorithm. Afterwards, the model that was trained using the selected feature and the selected algorithm was evaluated in the traffic scenarios.
The evaluation showed that the model performs well when it comes to predicting driver maneu-vers at roundabouts. Therefore, the objective of this thesis was achieved. The details of the evaluation are provided in Chapter 5.
1.4 Contributions
The work presented in this thesis makes the following contributions:
1. Empirical proof that human driving behavior in roundabouts is affected by the geometric features of roundabouts. The mathematical relationship between driving behavior and roundabout geometric features is introduced in Chapter 3.
2. A method for categorizing roundabout scenarios according to relevant geometric features and human driving behavior–a prerequisite for modeling human behavior at generic round-abouts. This method is also introduced in Chapter 3.
1.5 Outline
3. A generic structure for the driver maneuver predictive model. The model consists of sub-models for each scenario category. Each sub-model consists of a series of classifiers trained with data captured at roundabouts to predict drivers’ future maneuvers. The model’s structure and training are introduced in Chapter 4.
4. A grading system for evaluating the model. This grading system rewards correct predic-tions, punishes incorrect predicpredic-tions, and ignores unavailable results. The grading system is introduced and defined in Chapter 5.
5. Identification of information that can be captured automatically and be used to best predict future behavior. This information includes steering wheel information and car motion parameters. The advantage of this information is that it can be acquired at a low cost and without violating drivers’ privacy. The evaluation of the driving information can be found in Chapter 5.
6. A complex algorithm that integrates hidden Markov model and logistic regression is well suited for predicting driver behavior. The evaluation of the algorithms can also be found in Chapter 5.
7. A driver maneuver predictive model that is successful in scenarios with and without sur-rounding traffic. The performance of the model can be found in Chapter 5.
8. Empirical proof that human behavior depends not only on the geometric features of round-abouts but also on person-specific parameters such as driving style. A personalized pre-dictive model was developed on the basis of this knowledge. The performance of the personalized model can also be found in Chapter 5.
1.5 Outline
Chapter 2 presents the state-of-the-art regarding driver maneuver prediction [TIS+07, NMI+08,
BED08, BD09, SH14, GJW+16, TMF16]. Many researchers have focused on turning behavior at
(urban) intersections [TIS+07][BLSIG17]. Fewer researchers have investigated driving behavior
at roundabouts and how cyclists impact driving behavior [Rom05][Raa17]. Predicting driver maneuvers at roundabouts has not yet been investigated at all.
Chapter 3 introduces a method for categorizing scenarios. In each scenario category, the ef-fect of the geometric features of roundabouts on driving behavior is eliminated, increasing the predictability of driving behavior.
Chapter 4 presents the development of the driver maneuver predictive model. Multiple forms of driving behavior information were used as classification features and multiple machine-learning algorithms were used as classification algorithms. Additionally, a method for personalizing the model was proposed for individual drivers. The final driver maneuver predictive model achieves universality for both: roundabouts and drivers, i.e., the model can predict the maneuvers of all drivers with all driving styles at compact roundabouts with any types of layouts.
Chapter 5 presents the evaluation of the driver maneuver predictive model. First, the features and the algorithm with the best predictive performance were selected and the positions where
1 Introduction
reliable prediction can be obtained were investigated. Second, the impact of cyclists at or near a roundabout on the driver maneuver prediction was analyzed. Finally, a personalized model that was trained to predict the behavior of a specific driver was evaluated.
Chapter 6 summarizes the modeling process and provides conclusions about driver maneuver prediction. Limitations and further work are also presented.
2 Current State of Driver Maneuver
Pre-diction
Research on driver maneuver prediction incorporates many aspects, from cognition to the behav-ior of human drivers [Ran94, Mac03, PE07, DT11, MM15]. Driving behavbehav-ior can be planned on operational, tactical, and strategic timescales [Ran94][PE07]. The operational timescale, the shortest timescale of human interaction, is on the order of hundreds of milliseconds. The tac-tical timescale, which includes successive operations, is on the order of seconds. The strategic timescale, meanwhile, is associated with minutes or hours of prior planning [DT11]. Therefore, driver maneuvers related to turning at roundabouts are on the tactical timescales, on the order of seconds.
Some studies analyze human behavior at roundabouts, however, on the operational timescale rather than the tactical timescale [Rom05][SASMMI13][MHCG14]. Tactical maneuvers have been investigated in intersection and overtaking scenarios. In this chapter, turning maneuver prediction at intersections is focused because roundabouts are a special type of intersection. Previous work is summarized as the state of the art in following parts: driving behavior data, algorithms, and evaluation methods.
2.1 Driving Behavior Data
Driver maneuver studies are usually based on driving data collected either from real driving, in a simulator, or via a mixture of both [BLSIG17]. Data that are captured in a realistic traffic scenario can be generalized to reality, whereas simulator studies can control for more variables, such as surrounding traffic [DT11]. Studies on driver maneuvers at intersections show that the data used for prediction generally include driver information, ego car information, surrounding traffic information, and geometric information on the intersections [TIS+07, NMI+08, LIGL11,
LLIG11, SSH12, LKB+13, GKO14, SH14, TKG15, GJW+16, TMF16, BLSIG17, PWK17].
Driver information and ego car information
Driver information includes head, eye, foot, or hand positions that are usually collected using camera-based systems inside the car [TMF16]. Ego car information is generally collected from a CAN bus or off-the-shelf portable devices [SSH12]. The car information includes steering wheel angle, pedal position, turn signal state, lateral and longitudinal position, velocity, and acceler-ation [TIS+07, NMI+08, SH14, GJW+16, TMF16]. To acquire driving information at specific
sites of intersections, driving data are usually assigned to potential routes and transformed from time-based to distance-based representation [GJW+16].
2 Current State of Driver Maneuver Prediction
Surrounding traffic information
Surrounding traffic information includes the position, yaw angle, and velocity of the other ve-hicles, which are usually collected using sensors and cameras equipped on the outside of the car [TMF16]. In some studies [LKB+13][LRKS13], traffic information is not directly used to
predict driver maneuver but to investigate how traffic affects predictions. Liebner et al. (2013) predicted driver maneuvers at urban intersections in the presence of preceding vehicles. With no preceding vehicles, they achieved a false positive rate of 5% and a true positive rate of 95%; the true positive rate decreased to 55% in the presence of preceding vehicles. Hence, this approach allows for the expression of uncertainty in the presence of a preceding vehi-cles [LKB+13][GJW+16][LRKS13].
Geometric information of intersections
Geometric information of intersections includes information about the geometrical and topolog-ical characteristics of the road intersection, which are usually collected from a geographic infor-mation system (GIS) and digital map [LIGL11, LLIG11, TKG15]. This inforinfor-mation can be com-bined with car information and traffic information to predict driver maneuvers [LIGL11][LLIG11].
2.2 Algorithms
Machine-learning approaches have been demonstrated to perform well in driver maneuver pre-diction due to their ability to learn from large amounts of available data [TB13]. The machine-learning algorithms SVM, RF, Adaboost, and logistic regression are explained here because pre-vious research has found them to be suitable classification algorithms for the binary classification problem [TIS+07, SH14, GJW+16, TMF16, BLSIG17, GKO14, TKG15].
2.2.1 Support Vector Machines
Support vector machines (SVM) is a classification and regression method for categorizing data [CV95][BSB+96]. It has been used for driver maneuver prediction at intersections and exhibited
good prediction ability: A turn prediction accuracy of 90% was achieved 1.6 seconds before the intersection [TKG15].
The main idea of SVM for a binary classification is to map data to a higher dimensional space with a kernel function, so that the two categories are more easily separated (see Figure 2-1). Typical kernel functions include linear functions, Gaussian functions, and polynomial functions. Then, the mapped data are separated with the hyper-plane, which can be identified by solving an optimization problem. The hyper-plane is based on support vectors, which are a set of boundary training data. New data are classified according to which side of the hyper-plane they fall into. 10
2.2 Algorithms
There can be more than one plane for a given set of data. The goal is to find a hyper-plane that maximizes the margin between these two classes. The margin is defined as the sum of distances from the closest data points of both classes to the hyper-plane. A larger margin is good because it reduces the overfitting problem. Overfitting occurs when the solution is too customized for the training data and cannot be generalized to new data [Ben12]. The correct choice of kernel and data representation leads to good solutions [MS05]. In machine learning, Platt scaling or Platt calibration is a way of transforming the outputs of a classification model into a probability distribution over classes [HMK06].
Hyper-plane Feature map
Figure 2-1: Feature map from a lower dimension to a higher dimension.
2.2.2 Logistic Regression
Logistic regression has also shown success when used for decision prediction at intersections [TIS+07].
Logistic regression is generally well-suited for describing relationships between a categorical out-come variable and one or multiple continuous predictor variables [PLI02]. For the case of multiple predictors x, a logistic regression can be constructed for one dichotomous outcome variable Y
as follows [PLI02] logit(Y) = ln π 1−π =α+β1X1+β2X2 (2.2.1) Therefore,
π =P r obabi l i ty(Y =outc ome of i nter est|X1=x1, X2=x2, a spec i f i c v al ue of X)
= e
α+β1X1+β2X2 1 +eα+β1X1+β2X2
(2.2.2) whereπ is the probability of the event, α is the Y intercept,βs are regression coefficients, and Xs are a set of predictors. α and βs are typically estimated using the maximum likelihood (ML)
method [PLI02].
2.2.3 AdaBoost
The AdaBoost algorithm [FHT+00] is the first practical realization of the boosting algorithm and
2 Current State of Driver Maneuver Prediction
driver maneuver prediction. The basic idea of boosting is to make accurate predictions based on heterogeneous data by combining several relatively simple and less accurate predictions [Sch13]. Consider m training data (x1, y1), . . . , (xm, ym) where xi is the observed data (e.g., steering
wheel angle, vehicle velocity),xi ∈X andy1 is the classification label, yi ∈ {−1,+1}, where −1
and 1 stand for two different maneuvers.
T simple predictors (a predictor with simple rules to map the data set and classification label with
a high error rate) are applied to construct an AdaBoost predictor, and the tth simple predictor
is denoted as ht : X → {−1,+1}. The combined predictor is the weighted combination of the
simple predictors H(x) = T X t=1 αtht(x). (2.2.3)
In plain text, H(x) is the weighted vote of the simple predictors where the tth predictor is
assigned weight αt.
The error rate of each simple predictor is only expected to be slightly lower than 50%, i.e., no individual predictor has to be good, which is called the weak learning condition. Under this condition, it can be proven that the error rate in the training data set decreases to zero quickly [FS95] with a few simple predictors (i.e.,T) of boosting and with a reasonable complexity
measured according to the Vapnik and Chervonenkis (VC) dimension.
According to [FS95, BH89], the VC dimension of the final predictor increases roughly propor-tionally to the number of simple predictors T. Furthermore, the error rate in the training data
set decreases monotonously with T and achieves, and then stays at 0 as further simple
predic-tors are added. However, the error rate in the test set, which is different from but has identical statistical characteristics to the training set, decreases first and then increases again as the number of simple predictors grows. This problem is referred to as overfitting. Therefore, with a view to both complexity and the error rate, the number of simple predictors should be chosen as the smallest number that reduces the error rate in the training set to 0.
2.2.4 Random Forest
Random forest (RF) has also shown good predictability in driver maneuver prediction at inter-sections [GJW+16, TMF16, BLSIG17]. A study by Gross (2016) showed that maneuvers can
be predicted with a recall of 76% 30 m before the relevant intersection center using RF. Random forest comprises several predictors in the form of decision trees, with the final decision based on the votes of the individual decision trees [LWWL13]. Decision trees are a widely-used classification algorithm that splits the data space into two or more classes on the basis of significant features. Fig. 2-2 shows an example of a decision tree. Beginning with the root node (also a decision node), each decision node splits the data space according to the currently most significant feature. The currently most significant feature is excluded from the decision nodes beneath it, and the second most significant feature is applied to split the data space. The classification is complete when a terminal node is reached.
2.2 Algorithms
Root node
Decision node Decision node
Decision node Terminal node Terminal node
Terminal node Terminal node
Terminal node
Figure 2-2: An example of the decision tree.
The decision tree outperforms linear models (e.g., SVM and logistic regressions) when the problem at hand involves non-linearities or the relationship between dependent and independent features is highly complex. However, one common issue of decision trees is the overfitting problem. To deal with this, one can use bagging to reduce the variance of the estimation [Bre96]. Bagging splits the complete training data into several sub-samples and uses each of them to train a decision tree. This algorithm is called Random Forest, because the training data is selected randomly and because there are quite a large number of decision trees. The final decision in RF is the class receiving the most votes from the decision trees. The RF algorithm is particularly suitable for complicated input data with a large number of dimensions with a wide range of relative importances.
2.2.5 Hidden Markov Models
Hidden Markov models (HMM) are also a suitable method for driver maneuver prediction at intersections [SH14, GKO14]. A study by Streubel (2014) [SH14] showed that HMM accom-plished a robust prediction with high accuracy, above 90%, as early as 7 seconds before entering an intersection.
An HMM [RJ86] comprises hidden states and observations, as shown in Fig. 2-3. The ob-servations are the measured data, which depend on unobserved states (hidden states) but are disturbed by random factors. The hidden states are assumed to have the Markov property, i.e., that each state in the sequence depends on the previous state and is independent of all other states, which can be formulated as
p(Si|S1, S2, . . . , Si−1) =p(Si|Si−1) (2.2.4)
2 Current State of Driver Maneuver Prediction
S
1S
2S
TO
1O
2O
T Observation Hidden states 𝜋 A A B B BFigure 2-3: Typical hidden Markov structure.
Each observation is used to predict a sequence of states starting from an initial state. The prior probability of states given the previous posterior state probability is defined as thestate transition
probabilities. The probability of observations given the state is the emission probability. The
notations used in the following text are defined as follows:
• N is the number of states, the individual states are denoted as X ={x1, x2, . . . , xN}, and
the state at time t is denoted as St.
• Ais the transition probability matrix, its elementai j at rowi and columnj is the conditional
probability ai j =p(St+1=xi|St =xj), where 1≤i , j ≤N,
• Ois the set of observations. Its elementsv are possible continuous or discrete observations,
• B is the emission probability, i.e. the conditional probability of an observation v given a
certain state xi,
• πis the initial state probability vector. Itsith element isπi =p(S1=xi), where1≤i ≤N.
A complete specification of an HMM requires specification of possible statesS, possible
obser-vations O and three probabilities A, B, and π. Therefore, the complete parameter set of an
HMM isλ= (A, B, π).
In an HMM, the prior probability is defined as the probability of a state and the previous observations, i.e.,
α(Si =x) =p(O1, . . . , Oi−1, Si =x). (2.2.5)
The posterior probability is defined as the probability of a state and the previous and current
observations, i.e.,
β(Si =x) =p(O1, . . . , Oi, Si =x) (2.2.6)
2.2 Algorithms
which can be iteratively derived as
β(Si =x) =p(O1, . . . , Oi, Si =x) =X κ∈X p(O1, . . . , Oi, Si =x , Si−1=κ) =X κ∈X
p(Oi, Si =x|O1, . . . , Oi−1, Si−1=κ)p(O1, . . . , Oi−1, Si−1=κ)
=X
κ∈X
p(Oi, Si =x|Si−1 =κ)p(O1, . . . , Oi−1, Si−1=κ)
=X
κ∈X
p(Oi|Si =x)p(Si =x|Si−1=κ)p(O1, . . . , Oi−1, Si−1=κ)
=X
κ∈X
p(Oi|Si =x)p(Si =x|Si−1=κ)β(Si−1=κ)
(2.2.7)
wherep(Oi|Si =x) is the emission probability, i.e., the probability that observation Oi happens
givenSi =x, which can be obtained from the classification algorithms mentioned above;p(Si = x|Si−1=κ) is the transition probability, i.e., the probability that the system state at time slice
i is x given that the system state at time slice i −1 is κ, which determines how “resistant”
the algorithm is. A high transition probability of p(Si = x|Si−1 = x) suggests that a previous
estimate is unlikely to change in the future and vice visa. The second line of (2.2.7) is the marginalization. The third line is the application of Bayes’ rule. The fourth line is because Oi
and Si are independent of O1, . . . , Oi−1 given Si−1. The fifth line is the application of Bayes’
rule again and the last line is the iterative application of the definition of posterior probability. Hidden Markov models can be used to predict future driving behavior for two reasons. First, driving maneuvers can be represented as the implementation of the driver’s future plan on the tactical level [Mic85]. As this future behavior is a plan of the driver and cannot be observed directly, it has to be inferred from observable signals within the driver’s current behavior and the environment in which the driver is operating. Many signals that describe how drivers influences vehicle dynamics, such as the steering wheel angle and velocity, are appropriate for making this observation [MS04]. Second, HMM supports recognition of temporal data patterns. This is important because humans perform different actions on different timescales. Even within a simple maneuver, internal states may vary over time. HMM provide an excellent framework for such temporal mappings. Thus, HMM is a good method to solve the driving behavior prediction problem.
Driver behavior can be successfully modeled with HMM by solving the following problems: 1. Given an observation sequenceO and definition of statesS, find the model λ= (A, B, π)
that maximizes the probability of O. This can be seen as training a model to best fit the
observed data.
2. Given λ = (A, B, π) and an observation sequence O, find an optimal state sequence for
the underlying Markov process, i.e., to estimate the states of the HMM. The conventional method for solving these two problems is as follows [Sta04]:
2 Current State of Driver Maneuver Prediction
behavior at roundabouts. This is a model training process. The Baum-Welch algorithm can be used for parameter estimation based on the training set. In addition to the match between the HMM properties and the time series data, the expectation maximization (EM) algorithm provides an efficient class of training methods. Given plenty of data generated by some hidden power, a HMM architecture can be created and the EM algorithm can be used to find the best model parameters that maximize the likelihood of the observed training data.
2. The solution to Problem 2 can be used to estimate the driver’s future behavior in new drives, which is an evaluation process. Two conventional methods to solve this problem are the Viterbi algorithm and the forward algorithm. The former finds the path in the state space with the maximum likelihood, whereas the latter chooses the state in every step to maximize the likelihood. For the considered problem, the two algorithms are equivalent. These methods allow a typical HMM to be determined, thus predicting future driver maneuver on the basis of the observations of driver behavior.
2.2.6 Summary
In summary, support vector machines, logistic regression, AdaBoost, and random forest algo-rithms have all proved to be effective for driver maneuver prediction. These four algoalgo-rithms were tested in this work. In addition, complex algorithms that integrate these four algorithms and HMM were also developed in this work to improve the model’s predictability, see the process of the model development in Chapter 4 and their predictive performance in Chapter 5.
2.3 Evaluation
A prediction method can be considered effective if its predictions are precise enough. An eval-uation method is necessary to evaluate the precision of predictions, such as a confusion ma-trix [Pow11] or receiver operating characteristic (ROC) curve [Han98]. In the field of machine learning for binary classification, a confusion matrix is used to visualize the performance of an algorithm: Each row of the matrix represents the instances in a predicted class, whereas each column represents the instances in an actual class [Pow11]. The visualization allows to check whether the system is confusing two classes. The confusion matrix generates some widely-used scores to represent the proportion of target examples that are correctly or incorrectly predicted, such as accuracy, detection rate, false alarm rate, and F-measure. The performances of different models can be compared using a ROC curve [DT11].
The time lag or the distance lag of the prediction is also important to consider when evaluating a predictive model. As the time gets closer to maneuver execution, prediction performance generally increases. Some studies have been able to predict the maneuver just before it occurs [OYT04, GSBD06, KYSL00, Kru08], whereas others have been able to predict the maneuver at earlier times (e.g., several seconds before the maneuver) or some distance before the relevant intersection (e.g., 30 m before the intersection) [NMI+08, SH14, GJW+16, TMF16, TKG15,
2.4 Conclusion
PWK17].
2.4 Conclusion
The driving behavior data, algorithms, and evaluation methods found in the previous literature are summarized in Table 2-1. However, no study focusing on driver maneuver prediction at roundabouts is available. This thesis will fill this research gap.
2 Current State of Driver Maneuver Prediction
Table 2-1: State of the art.
Study Measure Algorithm Evaluation Result
Taguchi et al. (2007) [TIS+07]
Ego car velocity, leading-car velocity, and the distance between the ego car and leading cars
Logistic regression Detection rate Detection rate of 80.0%
Naito et al. (2008) [NMI+08]
Accelerator throttle, brake, and veloc-ity of the ego car
K-means Accuracy 95.6% as early as 5 seconds before
the intersections Lefevre et al.
(2011) [LIGL11, LLIG11]
Turn signal of the ego car and the in-formation about the entry lanes
Bayesian network Accuracy 100% approximately 10 m away
from the exit of the intersection. Sathyanaray-ana
et al. (2012) [SSH12]
Velocity, steering wheel angle, engine RPM, and gas/brake pedal pressure in-formation
SVM Accuracy Accuracy of 89%
Liebner et al. (2013) [LRKS13, LKB+13]
Ego car velocity Intelligent driver
model (IDM)
Detection rate Detection rate of 95% Without traffic whereas 55% in the presence of preceding vehicles
Gadepally et al. (2014) [GKO14]
Velocity, position, and orientation of the ego car
HMM Number of correct
predictions
Correct recognition for 38 of the 40 observation sequences.
Streubel et al. (2014) [SH14]
Velocity, acceleration, and yaw value of ego car
HMM Accuracy Above 90% as early as 7 seconds
before entering the intersections Tang et al. (2015)
[TKG15]
Position, velocity, acceleration, yaw value of the ego car and lane-level maps
SVM accuracy 90% as early as 1.6 seconds before
the intersection
Continued on next page
2.4
Conclusion
Table 2-1 – continued from previous page
Study Measure Algorithm Evaluation Result
Gross et al. (2016) [GJW+16]
Position, heading, acceleration, and velocity of the ego car
RF Recall 76% at 30 m before the relevant
intersection center Tawari et al.
(2016) [TMF16]
The information extracted from driver camera, scene camera, and navigation camera
RF Accuracy Over 80% 2 seconds before the
ma-neuver event Barbier et al.
(2017) [BLSIG17]
Velocity, position, and heading of the ego car (20% of real driving data and 80% of data from simulated environ-ment)
RF Accuracy Accuracy of 80.3%
Phillips et al. (2017) [PWK17]
Ego car velocity and acceleration, the lane-relative heading, the number of lanes, and the headway distance to the preceding vehicle
Recurrent Neural Networks (RNNs)
Accuracy 85% as early as 150 m before the intersection
3 Scenario Categorization Method
In this chapter, a scenario categorization method was developed to categorize any drive through a roundabout. The driver maneuver is both, a cause and a consequence of driving behavior, which can be used to predict the driver maneuver. However, drivers behave differently when driving through roundabouts with different geometric features. For this reason, it is important to eliminate the effect of geometric features on driving behavior. Otherwise, the driver maneuver can hardly be predicted effectively with the driving behavior. In this chapter, the relationships between driving behavior and the geometric features of roundabouts are described, achieving Contribution 1 presented in Chapter 1.4. The effects will then be used to propose a scenario categorization method that can categorize any drive through a roundabout. This finding is Contribution 3 presented in Chapter 1.4. In each category, the effect of the geometric features of roundabouts on driving behavior is eliminated, increasing the predictability of the driving behavior.
Two studies were conducted to identify the appropriate scenario categorization method and develop a model to predict driver maneuver with driving behavior data. These studies are described in detail in this chapter. First, a field study was conducted to gain an empirically well-founded understanding of driving behavior at roundabouts. Driving behavior data from participants were acquired in real driving environment as they drove through a track including three roundabouts with different geometric features. The limitations of the field study were that the driving behavior was mediated by uncontrolled factors related to surrounding traffic and that driving behavior data were only captured at three roundabouts. Thus, a simulator study was designed, taking the results of the field study into consideration. The simulator study was conducted in a laboratory in which the experimental conditions could be controlled and undesired disturbances could be eliminated. In the simulator study, driving behavior data from participants were acquired as they drove through tracks including roundabouts with controlled geometric features and a controlled traffic situation. On the basis of these two studies, a method of scenario categorization was proposed to make progress towards achieving the goal of developing the driver maneuver predictive model. This method can be used to propose the structure of the driver maneuver predictive model.
The relevant definitions used in this chapter are listed below:
• A driver maneuver is either exiting a roundabout via an oncoming exit or staying in the roundabout by following the circulating lane. The goal of this thesis is to predict the driver maneuver of exiting /staying in a roundabout in front of an oncoming roundabout exit. • Driving behavior is the car status and driver actions in a driving task, such as turning the
steering wheel turning and controlling velocity.
• Driving behavior data are the values of the driving behavior, i.e., data on the steering angle, steering angle velocity, velocity, acceleration, car yaw, driver gaze direction, and driver head direction.
3 Scenario Categorization Method
• Entry-exit angle is the angle between the entry a driver takes to enter the roundabout and the exit she/he takes to exit the roundabout.
• The local extremum of steering angle θe is the value of the steering wheel rotation angle
when the steering wheel is turned to leftmost.
• The integrated geometric feature Geo is a feature that integrates the information about
the roundabout radius and the entry-exit angle.
• Geometric features of roundabouts is a general term for the features that can characterize roundabout layout geometry, such as radius, entry-exit angle, and the integrated geometric feature Geo.
3.1 Field Study
3.1.1 Method
The field study took place on a route leading through three roundabouts in the city of Braun-schweig (Germany), see Figure 3-1 for details. Of the seven study participants, three were female and four male. Their age ranged from 22 to 33 years (M = 25.28, SD = 4.11). Each participant had at least one year of driving experience and drove more than 1000 km per year. They were paid 10 Euro per hour to participate in this study. During the drive, an experimenter instructed the participants which exit to choose in the roundabout. This assured that each participant drove through every combination of entries and exits. The order of roundabouts and exits were changed randomly across participants to eliminate potential effects of order on driving behavior.
DLR
Roundabout 1
Roundabout 2 Roundabout 3
Figure 3-1: Driving route in the field study.
An experimental car was used for the study. It is an equipped research vehicle, dedicated to the 22
3.1 Field Study
observation of driving behavior in real traffic. Using a logging frequency of 100 Hz, the following variables were recorded:
• Steering angle
• Steering angle velocity • Acceleration
• Velocity • Yaw
• GPS position
Further, information of the participants’ gaze and head direction was obtained with an eye-tracking system using a logging frequency of 120 Hz. Therefore, the participants’ naturalistic driving behavior data including car state and human gaze and head direction were acquired. The driving behavior data were contained in 1239 drives generated by all participants when they drove through each combination of entries and exits of the three roundabouts.
3.1.2 Data Selection
The driving behavior data regarding the driver maneuvers lie in the path covered by the vehicle. Trivially, a driver taking the first exit of a three-exit roundabout produced a different path than a driver exiting the roundabout at the third exit. As Figure 3-2 (a) shows, there are three different possible drives when a driver drove through a roundabout. The blue path leads the vehicle out of the first exit, the red one out of the second, and the yellow one out of the third exit. This consideration was used to filter the relevant observations from the recorded data. To filter for data in which the driver potentially took the first exit, the observations positioned between the entry and the first exit were selected. To filter for data in which the driver potentially took the second exit, the observations positioned between the first and the second exit were selected. GPS data were used as a filter criterion, see the yellow zones in Figure 3-2. Data falling into the yellow zone depicted in Figure 3-2 (b) were considered relevant for the driver maneuver regarding the first exit, whereas data located within the yellow zone in panel (c) were considered relevant for the driver maneuver regarding the second exit. The panels (d) and (e) show the result of the data filtering. These data were used for analyzing and modeling: The data falling in panel (d) were used to predict whether or not drivers will leave the roundabout at the first exit, whereas data from panel (e) were used to predict whether or not drivers will leave at the second exit.
The observations selected by the GPS data-based filter criterion contained errors because the GPS data contained measurement errors due to GPS signal multi-paths, signal reflections from buildings and trees, or a low number of GPS satellites in a line-of-sight to the antenna. Figure 3-3 depicts a typical erroneous observation at a roundabout: The solid red line denotes a drive
3 Scenario Categorization Method
(a)
(b) (d)
(c) (e)
Figure 3-2: Selection of relevant data.
from the entry to the exit of the roundabout. From the shape of the line, it can be determined that the car’s actual position was at the position of the dashed red line, i.e., the driving behavior data were actually related to the position of the dashed line. Hence, the information could not be used to predict the driver maneuver at the position where it appeared to be. Therefore, the observations with error needed to be excluded.
Figure 3-3: A typical erroneous observation at a roundabout.
Measurement errors also led to incorrect yaw values. Due to all paths being on the same roundabout with the same curvature, the yaw of correct measurements hardly varied, whereas the yaw of erroneous measurements varied markedly from the correct ones. Thus, the first yaw value and the last yaw value for each drive were checked to detect whether they contained an error. Figure 3-4 shows the direction of the first and the last yaw values of two drives with four arrows: Two black arrows denote the first yaw value and the last yaw value for a drive with correct measurement, that is denoted by a black line. Two red arrows denote the first 24