Global AIDS Progress Report 2012
Fiji Islands
Reporting period: January 2010 – December 2011
ABBREVIATIONS 2
I. STATUS AT A GLANCE 4
INCLUSIVENESS OF STAKEHOLDERS IN THE REPORT WRITING PROCESS 4
STATUS OF THE EPIDEMIC 4
THE POLICY AND PROGRAMMATIC RESPONSE 5
PREVENTION 5
CONTINUUM OF TREATMENT, CARE AND SUPPORT 5
COORDINATION AND GOVERNANCE 5
THE FIJI HIV/AIDSDECREE 6
RESOURCES 6
II. OVERVIEW OF THE AIDS EPIDEMIC 18
FIJI SOCIO-ECONOMIC CONTEXT 18
ORGANISATION OF THE HEALTH SYSTEM 19
HIV SALIENT STATISTICS 20
SEXUALLY TRANSMITTED INFECTIONS (STIS) 23
THE NEED FOR FURTHER EPIDEMIOLOGICAL RESEARCH 24
SOCIAL RESEARCH PROVIDES FURTHER UNDERSTANDING OF FACTORS INFLUENCING THE SITUATION 25 NATIONAL HIVLEGISLATION –THE HIV/AIDSDECREE 2011 27
NATIONAL STRATEGIC PLAN 28
NATIONAL HIV COORDINATION MECHANISM 28
MONITORING AND EVALUATION FRAMEWORK 29
NATIONAL FUNDING OF HIV AND AIDS PREVENTION, TREATMENT AND CARE AND SUPPORT SERVICES 29
III. NATIONAL RESPONSE TO THE AIDS EPIDEMIC 30
PREVENTION:YOUNG PEOPLE 31
PREVENTION:SPECIFIC SUB-POPULATIONS WITH HIGHER RISK OF HIV EXPOSURE 34
HIV TESTING AND COUNSELLING SERVICES 39
PREVENTION OF PARENT-TO-CHILD-TRANSMISSION OF HIV SERVICES: STATS & FACTS 41
TREATMENT, CARE AND SUPPORT 46
IV. BEST PRACTICES 49
V. MAJOR CHALLENGES AND GAPS 52
POLITICAL SUPPORT AND LEADERSHIP 52
HUMAN RIGHTS AND LEGISLATION 52
MONITORING AND EVALUATION 52
PREVENTION 53
COUNSELLING AND TESTING 53
PREVENTION OF PARENT TO CHILD TRANSMISSION OF HIV 54
TREATMENT CARE &SUPPORT 54
ORPHANS 55
ANNEX 3:REFERENCES 57
Abbreviations
ADRA Adventist Development Relief Agency ANC Ante Natal Clinic
ART Antiretroviral Therapy ATFF AIDS Task Force of Fiji
CD4 Cluster of Differentiation 4 (a CD4 count is a proxy indicator of the state of the immune system)
CWM Colonial War Memorial Hospital
FASANOC Fiji Association of Sports and National Olympic Committee / International Olympic Committee
FBOs Faith Based Organisations
FijiSTAHS Fiji Students Stand Against HIV and AIDS FJN+ Fiji Network of People Living with HIV FLE Family Life Education
FNU Fiji National University FRCS Fiji Red Cross Society
FSPI Foundation of the Peoples of the South Pacific International FWCC Fiji Women’s Crisis Centre
GDP Gross Domestic Product GNI Gross National Income
Global Fund Global Fund for AIDS, Tuberculosis and Malaria
HCW Health Care Worker
HIV Human Immunodeficiency Virus
IBBS Integrated Biological and Behavioural Surveillance IPPF International Planned Parenthood Federation MEN-Fiji Men’s Empowerment Network of Fiji
M&E Monitoring and Evaluation MOH Ministry of Health
MOU Memorandum of Understanding MSM Men who have sex with men MTCT Mother To Child Transmission
NACA National Council on AIDS (Peak body of last strategy, to be replaced now by the new HIV/AIDS Board)
NASA National AIDS Spending Assessment NGO Non Government Organisation
NRL National Reference Laboratory (Australia) NSP National Strategic Plan
OSSHHM Oceania Society of Sexual Health HIV Medicine
PacS-RHRC Pacific Sexual and Reproductive Health Research Centre (based at FNU) PCSS Pacific Counselling and Social Services
PIAF Pacific Islands AIDS Foundation PLHIV People living with HIV
PMTCT Prevention of Maternal to Child Transmission PPTCT Prevention of Parent to Child Transmission
UN Women United Nations Entity for Gender Equality and the Empowerment of Women USP University of the South Pacific
SAN Survival Advocacy Network
SENPEF Support and Empowerment Network for Peer Educators of Fiji
SGS Second Generation Surveillance (meaning integrated biological and behavioural surveillance)
SPC The Secretariat of the Pacific Community STI Sexually transmitted infection
UNDP United Nations Development Programme
UNGASS UN General Assembly Special Session on AIDS (UNGASS Report is the annual reporting of progress on recommendations of that Special Session)
VCCT Voluntary and Confidential Counselling and Testing WAC Women’s Action for Change
I.
Status at a glance
Inclusiveness of stakeholders in the report writing process
An orientation and consultation workshop was held in 23 February to discuss the preparation of the 2012 Global AIDS Response Progress Report. The 30 participants in the workshop were partners in the HIV response from the public sector (Ministries of Health, Youth, Education, Women & Social Welfare, and Labour), civil society, and multilateral organisations.
A core group of five consisting of representatives from the public sector (MOH), civil society and the UN was selected tow work with a technical adviser engaged to assist in preparing the report. The core group included the two coordinators, one each from public and civil society sectors, selected to lead the preparation of the national commitment and policy reports. The core group met as a whole face-to-face three times during the preparation of the GAPR report and via electronically continually. The national commitments and policy instrument (NCPI) was sent electronically to all stakeholders who attended the initial consultation meeting for completion. In addition, the Technical Adviser conducted face-to-face interviews with selected key informers using the NCPI. The Technical Adviser analysed the completed government and civil society NCPI questionnaires. Separate meetings for government and civil organisations were held to validate the findings of the completed questionnaires and agree on the responses from each sector. The Technical Adviser finalised the NCPI for the government and civil society sectors and prepared a table comparing the ratings for each of the NCPI sections with the rating from previous years.
The data for all the indicators (where such data existed), including the expenditure from all funding sources, was compiled by the core team, which assessed their validity at one of their face-to-face meetings. The Technical Adviser compiled the first draft of the Indicator table.
The core team presented the indicator data and to all the stakeholders at a final validation meeting in March 2012. Feedback from the stakeholders was incorporated into the report.
The narrative report was compiled by the Technical Adviser based on reviews of national and project reports from partners engaged in the HIV response, interviews with key informants, analysis of NCPI questionnaires, and analysis of HIV, AIDS and STI data from the Ministry of Health.
Status of the epidemic
Fiji is classified as a low HIV prevalence country. The UNAIDS and WHO Epidemiological Factsheet for Fiji estimated the number of people living with HIV in 2009 to be about 500, and the prevalence rate for 15 – 49 year olds at approximately 0.12%.1There have been no epidemiological HIV sero-surveys of the general population conducted, but the number of HIV infections detected among the many thousands of HIV tests undertaken each year support (see Table 1 below),supports the estimated prevalence of 0.12%.
At the end of 2011, a cumulative total of 420 confirmed HIV cases had been reported in the country since the first case was diagnosed in January 1989. However it is unclear how many of the confirmed HIV cases are still alive. At present (March 2012), fewer than 100 HIV+ cases are in contact with the health care services.
In the first 10 years of the HIV epidemic in Fiji, there was a slow but steady increase in the number of HIV infections detected annually, with between three and eight new infections reported. The rate of increase in HIV diagnoses quickened from 2000 with an average of 30 HIV infections diagnosed annually between 2000 and 2008. However in 2009, the number of infections diagnosed, 43, was about one third higher than the annual figures for the previous six years. The number of new HIV infections in 2010 and 2011 were 33 and 54 respectively. The overall impression of the HIV epidemic in Fiji is one of continuous incline, although the rate of increase is not steep.
Fiji developed a new national strategic plan in 2011 for the period 2012-2015, following the completion of the 2007 – 2011 National HIV/AIDS Strategic Plan (NHSP). The review of the 2007-2011 NHSP that preceded the development of the new plan identified the many achievements and challenges of the national HIV response.
Prevention
Prevention had been the major priority within the national response to the HIV epidemic. Since the last National Strategic Plan was adopted in 2006, there had been expansion of prevention activities as well as improvements in the methods used and collaboration between prevention partners. Young people have been a major focus of HIV prevention activities, with in-school education provided by the Ministry of Education and many out-of-school peer education programs provided by the Ministry of Health and civil society organisations.
The Fiji approach to prevention was described as a good example of “Combination Prevention”. Programs have often linked provision of information in community settings with chances for community members to receive condoms, meet people living with HIV, and talk about behaviour change with peer educators or community leaders. For those wanting more time to think about whether their own behaviours place them at risk, prevention provided referrals to clinics, which provide counselling, testing or treatment services. The review noted that there was an appropriate balance between focused prevention for vulnerable groups and more general programs for the whole community.
There has been an increasing focus on prevention of mother to child transmission (PMTCT) with the provision of HIV testing to pregnant women attending antenatal clinics (ANCs). The collaboration between the Ministry of Health and Pacific Counselling and Social Services (PCSS), an NGO specialising in counselling and social support, to provide this service at ANCs ensures that the HIV test is accompanied by pre- and post-test counselling and informed consent. All HIV+ women receive anti-retroviral prophylaxis as do the new-born infants.
Continuum of treatment, care and support
Antiretroviral therapy (ART) has been available, free of charge, for people living with HIV (PLHIV) in Fiji since 2004. Antiretroviral drugs were initially provided through a Global Fund project. Since 2008, the government of Fiji has assumed the responsibility of providing ARVs for all those in need of treatment. Three Hub centres, one in each of the three divisions of the country provide ART for PLHIV, HIV testing STI management, and reproductive health services to the public.
The Fiji Network of People Living With HIV (FJN+) is an important part of the continuum of treatment care and support. The network provides peer support and assists its members to maintain their health by remaining on ART. Most importantly, FJN+ has played a prominent role working to reduce stigma and discrimination against PLHIV. People living with HIV are invited to be part of many community awareness outreach initiatives and community events. The very close collaboration between many partners means that people living with HIV are now very visible in all public components of the national response and available for immediate involvement in support of people newly diagnosed with HIV.
Coordination and Governance
The National Advisory Committee on AIDS (NACA) was the peak body responsible for coordinating the national HIV response. The effectiveness of NACA varied significantly over the period of
2011, it was clear that NACA was largely irrelevant to many of the partners involved in the HIV response. There was however, a clear need for national coordination because there was no national monitoring or even reporting mechanism established, and most projects reported only to their own organizations or to donors. Even projects with extensive monitoring did not feed information or lessons learned to any national monitoring or coordination group. This meant that information was not used for ongoing planning and revision of the national response.
The Fiji HIV/AIDS Decree
In January 2011, the Fiji HIV/AIDS Decree 20112 was enacted, culminating a process that began in 2004. The Decree outlines a human rights framework for the response to the HIV epidemic from this point on. It also legislates for the formation of a new multisectoral HIV/AIDS Board that will be responsible for coordinating the national HIV response. For the first time in the history of the HIV response in Fiji, there will be a full-time Chief Executive Officer, answering to the Board, responsible for managing coordination
Resources
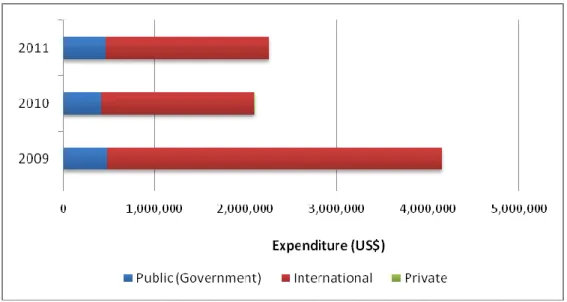
Government of Fiji expenditure on the national HIV response in 2010 and 2011 constituted approximately 20% of the total expenditure of US$2.1 million and US$2.5 million respectively. Funding from international sources, mostly, the Australian and New Zealand government and the United Nations Agencies, made up the bulk of the expenditure. In 2009, the Government of Fiji’s contribution to the national AIDS expenditure was about US$480,000, slightly more than was provided in the subsequent two years. However the government’s funding was 10% of the total expenditure of over US$4.1 million in 2009. Since 2009, the HIV expenditure has halved, with all the reduction being from the funding provided by International sources. The very high dependence of the national HIV response on funding from international sources is of great concern because it is not clear that the government can fill the gap if and when the international funding ends.
Indica Nu mer Den omin % Nu mer Den omin %
1.1 Percentage of young women and men aged 15 – 24 who both
correctly identify ways of
preventing the sexual transmission of HIV and who reject major
misconceptions about HIV
transmission
N/A N/A N/A N/A N/A N/A No data collection exercise was conducted for
this indicator in 2010/2011. The most recent survey of young people’s knowledge about HIV prevention was the 2008SGS which included GAPR-consistent questions on this indicator but was not a DHS style national household survey covering youth as part of the general population. Fiji’s first national DHS is scheduled to take place in 2012 1.2 Percentage of young women and
men who have sexual intercourse before the age of 15
N/A N/A N/A N/A N/A N/A No data collection exercise was conducted for
this indicator in 2010/2011. As reported in Fiji’s 2010 UNGASS Report, the 2008 SGS included questions consistent with this indicator but not consistent with the DHS-style measurement recommended in the Guidelines. Data for Indicator 1.2 are not available from other sources.
1.3 Percentage of adults aged 15-49 who have sexual intercourse with more than one partner in the past 12 months
N/A N/A N/A N/A N/A N/A No data collection exercise was conducted for
this indicator in 2010/2011. As reported in Fiji’s 2010 UNGASS Report, 2008 SGS included consistent questions on this indicator, but did not conduct DHS-style national household survey covering general population. The 2008 SGS focused on specific populations such as ANC women,
Indica
to
r # Indicator Sub-population
2010 2011 Remarks Nu mer ator Den omin ator % Nu mer ator Den omin ator %
STI Clinic attendees, tertiary students, seafarers and uniformed services. The percentages of respondents who reported sexual intercourse with more than one partner in the last 12 months were as follows: ANC women (15-49): 5%
STI Male (15 – 49) : 62% STI Female (15 – 49): 20%
Tertiary Students Male (15 – 24): 33% Tertiary Students Female (15 – 24) :6% Seafarers (20 – 49): 32%
Uniformed Services (20 – 49): 31% 1.4 Percentage of adults aged 15-49
who had more than sexual partner in the past 12 months who report the use of a condom during their last sexual intercourse
N/A N/A N/A N/A N/A N/A No data collection exercise was conducted for
this indicator in 2010/2011. As reported in Fiji’s 2010 UNGASS Report, 2008 SGS included consistent questions on this indicator, but did not conduct DHS-style national household survey covering general population. The 2008 SGS focused on specific populations such as ANC women, STI Clinic attendees, tertiary students, seafarers and uniformed services. The percentages of respondents who reported sexual intercourse with more than one partner in the last 12 months who report the use of a condom in their last sexual intercourse were as follows:
ANC women (15-49): 5% STI Male (15 – 49): 10% STI Female (15 – 49): 38%
Tertiary Students Male (15 – 24): 47% Tertiary Students Female (15 – 24): 13% Seafarers (20 – 49): 28%
Uniformed Services (20 – 49): 30%
1.5 Percentage of women and men
aged 15-49 who received an HIV test in the past 12 months and know their results
N/A N/A N/A N/A N/A N/A No data collection exercise was conducted for
this indicator in 2010/2011. Data on Indicator 1.5 that consistent with GAPR 2012 Guidelines are not available from any source. 1.6 Percentage of young people aged
15-24 who are living with HIV
4 8744 0.05% 3 10804 0.03% There is no HIVsentinel surveillance of
women attending antenatal clinics in Fiji. However the denominator could be calculated from program data. Over 95% of pregnant women in Fiji attend antenatal care at least
once during their pregnancy. The
implementation of the PPTCT policy of HIV tests for all pregnant women is fully decentralised, reaching over 90% of pregnant women. The data from the five largest ANCs supported by PCSS is disaggregated by age, so the % of pregnant women in the 15 – 24 age group tested for HIV is calculated at 48%. This percentage was applied to the total number of women tested to calculate the denominator for both 2010 and 2011.
1.7 Percentage of sex workers reached with HIV prevention programmes
N/A N/A N/A N/A N/A N/A No data collection exercise was conducted for
this indicator in 2010/2011. Data on Indicator 1.7 that consistent with GAPR 2012 Guidelines are not available from any source.
Indica
to
r # Indicator Sub-population
2010 2011 Remarks Nu mer ator Den omin ator % Nu mer ator Den omin ator %
An IBBS of sex workers is in progress.
1.8 Percentage of sex workers
reporting the use of condoms with their most recent client
N/A N/A N/A N/A N/A N/A See comments for 1.7 above
1.9 Percentage of sex workers who have received an HIV test in the past 12 months and know their results
N/A N/A N/A N/A N/A N/A See comments for 1.7 above
1.10 Percentage of sex workers who are living with HIV
N/A N/A N/A N/A N/A N/A See comments for 1.7 above
1.11 Percentage of men-who-have-
sex-with-men reached with HIV
prevention programmes.
The source of the data for this indicator is the draft report of the 2011 Integrated behavioural survey of transgender and men who have sex men in Suva and Lautoka conducted by MENFiji3 The report is not complete and all indicators have not been calculated.
A 2011 report by AIDS Task Force of Fiji
(ATFF) of a community-based study
exploring male-to-male sex, gender identity and HIV transmission in Fiji, calculated that the percentage of MSM and transgender who knew where to get and HIV test and have been given condoms in the past 6 months was 40.1% (N=201)4.
a. Knew where to get an HIV Test N/A N/A N/A 450 464 97%
b. Had been given condoms in last 6 months
N/A N/A N/A 315 464 67.8%
c. Knew where to get and HIV test and had been given condoms
1.12 Percentage men reporting the use of a condom the last time thy had anal sex with a male partner
N/A N/A N/A 178 353 50.5% The source of the data for this indicator is the
draft report of the 2011 Integrated behavioural survey of transgender and men who have sex men in Suva and Lautoka conducted by MENFiji.
1.13 Percentage of men who have sex with men that have received an HIV test in the past 12 months and who know their results
N/A N/A N/A 71 464 15.3% The source of the data for this indicator is the
draft report of the 2011 Integrated behavioural survey of transgender and men who have sex men in Suva and Lautoka conducted by MENFiji.
1.14 Percentage of men who have sex with men who are living with HIV
N/A N/A N/A 2 438 0.5% The source of the data for this indicator is the
draft report of the 2011 Integrated behavioural survey of transgender and men who have sex men in Suva and Lautoka conducted by MENFiji.
2.1 Number of syringes distributed per person who injects drugs per year by needle and syringe programmes
N/A N/A N/A N/A N/A N/A Little is known about injecting drug use in
Fiji and so far injecting drug use has not been a significant factor in Fiji's epidemic, with only one case reported to have resulted from injecting drug use. SGS 2008 included questions on injecting drug use and very few respondents (15 out of 1629) reported injecting drug use in the past 12 months. A maximum of 2 respondents from the respective surveyed populations (STI clinic attendees, ANC attendees, Seafarers, Police and Military) reported the practice of
Indica
to
r # Indicator Sub-population
2010 2011 Remarks Nu mer ator Den omin ator % Nu mer ator Den omin ator %
injection drug use in the past 12 months. However, nine tertiary students (out of 543) reported that they had injected drugs in the past 12 months.4
2.2 Percentage of people who inject drugs who report the use of a condom at last sexual intercourse
N/A N/A N/A N/A N/A N/A See 2.1 above
2.3 Percentage of people who inject drugs who reported using sterile injecting equipment the last time they injected
N/A N/A N/A N/A N/A N/A See 2.1 above
2.4 Percentage of people who inject drugs that have received an HIV test in the past 12 months and know their results
N/A N/A N/A N/A N/A N/A See 2.1 above
2.5 Percentage of people who inject drugs who are living with HIV
N/A N/A N/A N/A N/A N/A See 2.1 above
3.1 Percentage of HIV-positive
pregnant women who receive anti-retrovirals to reduce the risk of mother-to-child transmission
8 10 80% 11 N/A N/A Denominator calculated by multiplying the
HIV prevalence in pregnant women
(calculated at 0.04% in 2010 and 0.05% in 2011) by the total number of pregnancies in a year. The number of pregnancies in 2011 is not yet available, so Indicator 3.1 for 2011 cannot be calculated.
3.2 Percentage of infants born to
HIV-positive women receiving a
virological test for HIV within 2 months of birth
N/A N/A N/A 15 16 93.8% The Denominator includes women with
indeterminate HIV test results, but had been
put on ARV prophylaxis while the
confirmation of test result was undertaken. 3.3 Estimated percentage of child HIV
infections from HIV-positive women delivering in the past 12 months
N/A N/A N/A N/A N/A N/A There was no consensus among stake holders
on the output from Spectrum; it was therefore decided not use the spectrum estimates.
4.1 Percentage of eligible adults and children currently receiving antiretroviral therapy
Male 27 N/A N/A 40 N/A N/A Numerator is annual aggregation of data from
three Hub centres and tertiary hospitals providing ART to eligible adults and children. Three patients, one male and two females withdrew from treatment.
See 3.3 above
Female 31 N/A N/A 34 N/A N/A
<15 1 N/A N/A 2 N/A N/A
>15 57 N/A N/A 72 N/A N/A
Total 58 N/A N/A 74 N/A N/A
Indica
to
r # Indicator Sub-population
2010 2011 Remarks Nu mer ator Den omin ator % Nu mer ator Den omin ator %
with HIV known to be on treatment 12 months after initiation of antiretroviral therapy
Access 2011 Report
2011 Data is collected from ART registers of three Hub centres and divisional hospitals providing ART to adults and children. One female patient discontinued treatment, one male patient was lost to follow-up and another male patient died.
Female 26 N/A N/A 7 8 87.5%
<15 0 N/A N/A 0 0 0
>15 51 N/A N/A 12 16 75%
Total 51 52 98% 12 16 75%
5.1 Percentage of estimated
HIV-positive incident TB cases that received treatment for both TB and HIV
Male 4 N/A N/A Source of 2010 data is Fiji’s Universal
Access 2011 Report. Sex disaggregation is not provided.
The numerator for 2011 is the Ministry of Health TB registry. The GAPR guidelines advises that the Denominator is obtained from the WHO website. The most recent estimate of incident TB in HIV+ people in Fiji is for 2010 and is given as <10. Therefore the denominator cannot be determined for 2011.
Female 0 N/A N/A
Total 3 3 100% 4 N/A N/A
spending by categories and financing sources
(Government) USD
national HIV response in 2010 and 2011 constituted approximately 20% of the total expenditure of US$2.1 million and US$2.5
million respectively. Funding from
international sources, mostly, the Australian and New Zealand government and the United Nations Agencies, made up the bulk of the expenditure. In 2009, the Government of Fiji’s contribution to the national AIDS expenditure was about US$480,000, slightly more than was provided in the subsequent two years. However the government’s funding was 10% of the total expenditure of over US$4.1 million in 2009. Since 2009, the HIV expenditure has halved, with all the reduction being from the funding provided by International sources International (USD) 1,677,396 2,100,661 79.8% 1,787,610 2,255,211 79.2% Private (USD) 3,661 2,100,661 0.2% 0 2,255,211 Total (USD) 2,100,661 2,100,661 100% 2,255,211 2,255,211 100%
7.1 National Commitments and Policy Instrument
Government 42 70 60% The overall assessment given by government
of the national HIV response of 60% is lower than the 69% achieved for the 2010 UNGASS Report. Comparing the ratings for the different sections of the NCPI reveals that the low ratings given for the ‘Orphans and Vulnerable Children’ and the Monitoring and Evaluation’ Sections had the most impact in reducing the overall rating for the national response by government. This is a more accurate assessment of the status of the response than the 2010 UNGASS report
Indica
to
r # Indicator Sub-population
2010 2011 Remarks Nu mer ator Den omin ator % Nu mer ator Den omin ator %
which gave a rating of 1 for OVC, although the situation is exactly the same as it was two years ago i.e there is no planned response for OVC affected by HIV because to date there have been very few of them and the extended family is still able to cope with looking after them. With regards to the assessment of the M & E systems, again the assessment provided in this reporting period is more accurate and backed by the review of the NSP undertaken in 2010, which found the national M & E system to be rudimentary. All other areas of the national response were rated highly by the government.
Civil Society 36 50 72% The rating given by civil society for the
national response has improved every year for the last four reporting periods, from a low of 18% in 2006 to 72% for 2011. In many ways this high rating is reflection of the strong partnership that exists between civil society and government for implementing the national HIV response. There is a recognition among CSOs that they have equal status in decision making and that the work they do is regarded as a crucial part of the response. There is an increased level of trust and an atmosphere of all pulling together for the
common good. 7.2 Proportion of ever-married or
partnered women aged 15-49 who experienced physical or sexual violence from a male intimate partner in the past 12 months
N/A N/A N/A N/A N/A N/A There is no data available for this indicator
from the recommended method of
measurement, population based survey, at this time. A survey of violence against women in Fiji has been conducted, but the results are not yet available. However information from a variety of sources indicate that domestic violence is widespread in Fiji. Figures from the Fiji Women’s Crisis Centre show that 80% of women have witnessed some form of violence in the home; 66% have been physically abused by partners and nearly half repeatedly abused. 26% of women have been beaten while pregnant; 48% of married women have been force into sex by their husbands; and 13% of women have been raped.5
7.3 Current school attendance among orphans and non-orphans (10-14 years old, primary school age, secondary school age
N/A N/A N/A N/A N/A N/A There is no data available for this indicator.
7.4 Proportion of the poorest
households who received external economic support in the last 3 months
II.
Overview of the AIDS epidemic
Much of the information for this section is sourced from the recently completed Fiji National Strategic Plan 2012 – 2017, supplemented by Fiji Islands Health System Review, Health Systems in Transition, Vol 1, No. 1 2011 and the Australia - Fiji Health Sector Support Project 2011 – 2015 Design Document (November 2010)
Fiji socio-economic context
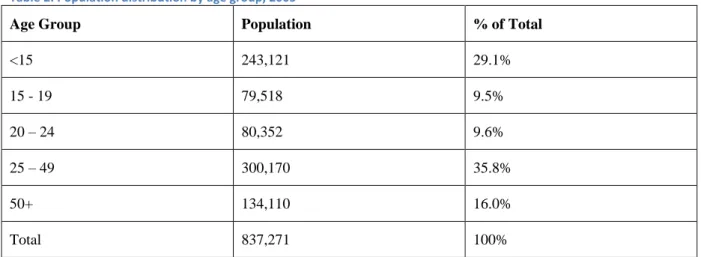
Fiji Islands is a lower middle-income country, with a population of 837,271 at the 2007 census. Table 2 shows the 2005 population distribution by age group:
Table 2: Population distribution by age group, 2005
Age Group Population % of Total
<15 243,121 29.1% 15 - 19 79,518 9.5% 20 – 24 80,352 9.6% 25 – 49 300,170 35.8% 50+ 134,110 16.0% Total 837,271 100%
Source: The Fiji Islands Health System Review, page 12
Fiji is a multi-cultural and multi-religious country made up of indigenous iTaukei Fijians (56.8%), Indo-Fijians (37.4%) and other minorities, including Caucasian and Chinese. iTaukei Indo-Fijians are predominantly of Christian faith and Indo-Fijians of Hindu and Muslim faith. The rural and urban populations comprise 49% and 51% respectively, making Fiji the most urbanised Pacific Island country.6
The Fiji economy is one of the most developed in the South Pacific. The main income generators are tourism, minerals, fish resources and remittances. The principal imports are mineral fuels, machinery and transport equipment, as well as an increase in food imports. The economic context is summarized in the draft UN Development Assessment Framework (UNDAF) country assessment Desk Review of 2011, from which the details of the rest of this section were extracted.7
Poverty and inequalities are key human development challenges. It is estimated that 34.3% of the population live below the basic needs poverty line (2003). Since 2008 real incomes of the poor have fallen sharply, bringing more households into poverty. The growth rate of GDP per person employed has fallen from a high in 1990 of 15% to -1.1% in 2008. The employment to population ratio has stayed steady from 2003 – 2008 at 56.4%. Fiji is one of six countries in the region that is “slightly off track” and/or demonstrating “mixed progress” towards the achievement of the Millennium Development Goals. Donor aid to Fiji was only 1.8% of Gross National Income in 2008.
Fiji has officially achieved universal primary education (96.7% in 2008) and has a high literacy rate of 99.5% amongst 15 – 24 year olds. However, in 2008 there was a 13.9% drop out rate of students between years one and five, which indicates that many children are leaving school without having learnt to read and write to a functional level. In both access and achievement, gender parity has been achieved in the basic education system, although there is increasing imbalance in the number of boys who are dropping out as compared to their female counterparts.
Village/community health workers,
Nursing stations
Health centres
Sub-divisional hospitals and
Divisional and specialized hospitals.
This framework was established some 40 years ago to provide health access to all, and has continued to serve the people of Fiji very well.
The main clinical services are provided through a network of 16 Sub-divisional Hospitals and 3 Divisional Hospitals located in Suva, Lautoka and Labasa that provide a comprehensive range of services. They also serve as teaching hospitals for nursing and medical students. There are 5 subdivisions in Central, 4 in Eastern, 6 in Western and 4 in Northern Divisions.
The Colonial War Memorial Hospital (CWM) in Suva serves as the Divisional Hospital for Central and Eastern Divisions, and also serves as the National Referral Hospital. It is supported by specialist hospitals that include the national St. Giles Psychiatric Hospital, the P.J. Twomey Hospital for tuberculosis and leprosy and the Tamavua Rehabilitation Hospital for specialist rehabilitation services.
Public health services are provided through the 16 Sub-divisional hospitals (SDH) and the 77 Health Centres (HC) and 101 Nursing Stations (NS). A health centre is point for a number of nursing stations within a designated SDH supervised medical area. A HC is managed by a Medical Officer or Nurse Practitioner plus 1 or 2 nurses. A NS is generally staffed by one nurse who conducts outreach visits to communities in a designated nursing area. In addition, Community Nursing Stations are facilities that fully operate and function as a nursing station except that they are built and funded by the community themselves on approved based on adherence to the minimum standards of a government station8.
The MoH has provided basic training to community members to create a cadre of Village Health Workers (VHW) in rural villages and Community Health Workers (CHW) in urban areas. Patients may first see a VHW/CHW or enter the public health service system directly by being visited at home by a nurse or by going to a NS, HC or SDH. They may then be referred to higher-level health facilities as appropriate. All consultations, laboratory and radiological investigations and admissions are free tothe public attending public health facilities, except for some treatments in dental services and where they choose to be admitted to the paying wards.
A small private sector includes one private hospital in Suva that provides a range of specialized services, several day clinics and 110 private general practitioners located in the urban centres of the two main islands Viti Levu and Vanua Levu.
There is also a wide and increasing range of health services, including antenatal and postnatal care provided privately through some 120 private practitioners, a private hospital and a range of NGOs. The major NGOs working in health in Fiji include the Fiji Reproductive Health Association, the Fiji Red Cross, Medical Services Pacific, and the Fiji Network of People Living with HIV.
Maternal health care is one of the core areas of the primary health care and is usually offered at all levels of the health system.
There are 37 antenatal health care facilities around the country. Services provided include information and education, health promotion, screening and interventions for women of reproductive age to reduce risk factors that may affect future pregnancies. Women are urged to seek antenatal care early in their pregnancies at the nearest health facility providing it, although there is a high incidence of late presentation for antenatal checks. The percentage of births attended by skilled personnel has remained consistently above 98% and is currently estimated to be 98.8%. Postnatal checks are offered to mothers six weeks after delivery and family planning services are available at the maternity units, health centres and nursing stations.
Fiji made considerable progress in improving its key MDG health indicators in the 1990s. During that period, life expectancy, maternal and infant mortality improved significantly, with maternal mortality ratios (MMR) improving from 156.5 (per 100,000 live births) in 1970 to 53.0 in 1980, to 41 in 1990 and to 22 in 2003. However from around 2003 progress stalled and began to deteriorate, with MMR peaking at 50 in 2005 and with a current MMR of 31.7 in 2008, well above the 2015 MDG target of 10.3.9
As Fiji transitions to an upper-middle income country, non-communicable diseases (NCD) are becoming an increasingly important cause of mortality and morbidity. By 2007, around 82% of deaths in Fiji were due to NCDs, 10% to communicable diseases and another 8% to other causes10. High prevalence rates of diabetes, cardiovascular disease, cancer and hypertension are attributed to lifestyle changes, poor diet, smoking and changing patterns in physical activity, and continuing nutritional problems particularly in school children and women. Diabetes now affects over 18% of the population11 and together with hypertension is a significant risk factor for coronary and vascular disease. Importantly, diabetes itself also carries a very significant morbidity.
Challenges in the Fiji health system are largely related to staffing and human resources shortages, inadequately equipped facilities and ineffective coordination and management of programs and services. Lack of action aimed at priorities emanating from research contributes to inadequate evidence-based programming and poorly informed policy formulation.
The expenditure of the Ministry of Health as a percentage of GDP was 2.87% at 2008, and the broader Government expenditure was 35.19% of GDP. In this context, health expenditure is between 9-11 percent of Government expenditure each year.
HIV salient statistics
Although Fiji is estimated to have low HIV prevalence, the number of people diagnosed with HIV is increasing every year. A graph of annual newly diagnosed HIV infections and the cumulative number of infections is shown in Figure 1. A cumulative total of 420 confirmed HIV cases were reported in Fiji between January 1989 and December 2011 by the Fiji Centre for Communicable Diseases Control (Figure 1), though it remains unclear how many of these are still alive. This way of presenting the HIV data informs about the history of the epidemic, but does not reveal much about what to expect in the future.
Figure 2 presents the expectation of the future of HIV epidemic (up to 2020), using the annual observed cases (blue line). The annual number of diagnosed cases was turned into rates using the UN population data and projections for Fiji. A fit of the second order polynomial function (R2 = 0.87) to the observed rates from 1989 to 2011 was produced (red solid line). The rates were extrapolated to 2020 and the expected cases calculated using UN population projections for Fiji. Figure 2 shows that the HIV epidemic is still in the exponential growth phase and is not showing any sign of levelling off. By 2020, the expected number of diagnosed infections will be 104. At a time when the number of new infections in many parts of the world is either decreasing or stable, the prospect of an exponentially rising epidemic is of great concern.
Source: Fiji Ministry of Health, December 2011, Fiji Centre for Communicable Disease Control
Figure 2: Projection of annual HIV infections to 2020
For all the HIV infections notified to the Ministry of Health, heterosexual transmission was reported for 91% of cases. However, community groups informing development of 2012 - 2015 strategic plan noted that the severe stigmatisation of sex work and of sex between men may mean that it is almost certain that people are under-reporting their involvement in these behaviours. Male-to-male sex accounts for 3% of reported infections; 7% of reported infections are from mother to child transmission (Figure 3).
Figure 3: Cumulative HIV Infections - Mode of Transmission
Source: Fiji Ministry of Health, December 2011, Fiji Centre for Communicable Disease Control
The HIV epidemic is disproportionately affecting young people. Together the 20-29 and the 30-39 age groups account for over 77% of all the infections reported to date (Figure 4). The majority of HIV infections (82%) have been among indigenous Fijians (ITaukei), whilst Indo-Fijians constitute 13% of reported cases.
Figure 4: Cumulative HIV infections - Disaggregated by Age
Source: Fiji Ministry of Health, December 2011, Fiji Centre for Communicable Disease Control
Slightly more (53%) of the people infected with HIV have been male and 47% female. An analysis of the annual number of reported infections shows an increasing trend of the proportion of infections detected in females relative to males. In 2003, 58% of HIV cases were male versus 42% female; in 2006, equal numbers of infections were reported in males and females. In 2009, the male to female
tested. HIV Testing of pregnant women as part of prevention of parent to child transmission (PPTCT) program means females are over represented in the total number of people receiving HIV tests. Unfortunately the HIV test data obtained from the laboratories in the course of preparing this report are not disaggregated by sex or age so it is not possible to analyse the male and female breakdown of HIV tests to determine a possible explanation for the increasing ratio of female to male infections. Figure 5: Cumulative HIV Infections - Disaggregated by Sex
Source: Fiji Ministry of Health, December 2011, Centre for Communicable Disease Control
Sexually Transmitted Infections (STIs)
In contrast to the low HIV prevalence existing in the country, a survey of pregnant women attending antenatal clinics in 2004 found that 29% were infected with Chlamydia, 1.7 % with gonorrhoea and 2.6% with syphilis.12Among younger women (<25 years), the Chlamydia prevalence was even higher at 34%. In 2008, another survey of pregnant women found levels of Chlamydia (26.8%), gonorrhoea (2.2%) and syphilis (2.7%) infection similar to the 2004 study. Once again, young pregnant women under 25 years had a much higher prevalence of 37.5%.
These studies indicate that Chlamydia is hyper-endemic in the sexually active population in Fiji, with one-third of sexually active males and females potentially infected. Most will be unaware that they are infected because the infections will be asymptomatic and can only be diagnosed by laboratory testing. Chlamydia testing has only recently become available in Fiji and the tests are only conducted at the Mataika House Reference Laboratory in Suva. Most people do not have access to laboratory diagnosis of chlamydia.
Figure 6 shows that the chlamydia prevalence in Fiji is very high compared with many other countries, and similar to reports from a nearby country with an expanding HIV epidemic, Papua New Guinea (Figure 6). The high prevalence in young people indicates that they are sexually active with
more than one partner, and sexual networks are dense enough to enable transmission of STIs amongst young heterosexuals. The data points to widespread risky sexual behaviour. This means that if HIV was introduced in larger case numbers, for example if there was a sudden influx of people infected with HIV after visiting high prevalence areas of nearby countries, then HIV could spread rapidly throughout Fiji.
Figure 6: Comparison of Chlamydia prevalence in pregnant women in Fiji with prevalence in 7 countries
Sources: STI Epidemiological Update PICTs 2009. HIV & STI Surveillance, SPC July 2010 & Fiji Ministry of Health, 2008 SGS Report.
The need for further epidemiological research
The fact that case reports of HIV amongst sex workers and men who have sex with men are low indicates that the HIV epidemic is not expanding through the groups who are most usually considered to be key affected populations. However, more needs to be known. Integrated Biological and Behavioural Surveillance amongst sex workers,which is scheduled to start in mid 2012, to shed more light on the potential of a concentrated epidemic amongst sex workers. Similar research was conducted amongst men who have sex with men in Fiji in 2011, and the tentative results of this indicate that this group is not yet experiencing a concentrated epidemic.13Two HIV infections were detected in 438 study participants, giving a national HIV prevalence of 0.5% among MSM. While this is higher than the calculated HIV prevalence of 0.05% among pregnant women attending antenatal clinics, the numbers are very small to afford any certainty about the calculations.
There are very few reports of injecting drug use amongst people in Fiji, so this is also unlikely to be a driver of an expanded epidemic.
In summary, there is no baseline indicator at present for either the prevalence or incidence of HIV amongst any specific population or the whole population. When prevalence is low, as is indicated by the small numbers of cases detected through current HIV testing strategies, it is difficult and would prove to be very expensive to conduct surveillance through population wide random samples. Hence, the continuation of sentinel surveillance through antenatal clinics, and occasional surveillance amongst groups likely to be key affected populations, will continue. However, this means that assumptions have to be made about which people are likely to be most affected, where to place prevention resources, and what level of concern to have about the likelihood of an expanding HIV epidemic.
Nonetheless, it is clear that the HIV epidemic is present in Fiji. This has severe consequences for the people infected, for their partners and newborn babies, and for their families and communities who are affected by the presence of HIV and by other people’s reactions to it.
Reproductive Health Research Centre (PacS-RHRC) and the University of New South Wales, resulting in the published report, “Risky Business”, in 2009.14 Integrated Biological and Behavioural Surveillance amongst sex workers will be conducted in 2012, supported by UNAIDS.
The “Risky Business” research found that all sex workers from Suva, Lautoka, Nadi and Labasa had decided for themselves to become sex workers and none had been forced or sold against their will. Clients of sex workers were mostly males and were from all ethnic groups in Fiji; were foreign and local; and also came from all professional backgrounds. The sex workers were ‘reasonably informed’ about HIV as a result of various awareness workshops conducted by NGOs, peer educators and schools. Sex workers used condoms, though not all of them were consistent condom users.
The research found two distinct groups of workers. One group reported a professional approach to sex work. They were mostly using condoms, negotiated condom use, educated clients about HIV and condom use, and also cited their right to protect themselves. The second group reported a more casual approach to sex work: they said they ‘went with the flow’, were also seen as ‘amateurs’ and had ‘sex for fun’. This second group’s actions resulted in higher risks of HIV transmission. However, the research also found that when clients preferred not to use condoms, sex workers offered other services such as oral sex, masturbation or non-penetrative sex, and charged more.
Most sex workers had used sexual health clinics for STI or HIV tests, but said they would prefer that the same services to be made available through their support organisations or from community clinics: past experiences indicated that those clinics were more ‘friendly and welcoming places’. Many sex workers wanting to be assured of confidentiality used the services of private doctors more than the public health facilities. The research found that public services could be improved through provision of transport, evening sessions, use of mobile clinics, provision of childcare facilities and availability of drop in centres.
Sex workers working from the streets, especially transgender sex workers, were more likely to experience harassment and abuse from men, street kids and the police. Transgender sex workers experienced violence and sexual abuse from heterosexual men. All sex workers were likely to experience being robbed or being driven out of town and village boundaries where they worked. This research established that resistance to condom use comes from male clients, not from sex workers themselves. It demonstrated that there is a need to work with male clients of sex workers, to promote condom use and to address attitudes to masculinity. These attitudes undermine realistic and effective perceptions, ideas and solutions about HIV transmission between men who have sex with men and heterosexual males. Peers of sex workers and experienced sex workers were reported as being important facilitators of condom use, HIV risk education, testing and treatment service information and support for attendance at health services.
The situations for men and transgender people who have sex with men were explored through two research projects which were completed in 2011. One was conducted by the AIDS Task Force of Fiji, supported by UNDP, and published as “Secret lives, other voices… a community based study exploring male to male sex, gender identity and HIV transmission risk in Fiji”. The other was an Integrated Biological and Behavioural Surveillance project amongst men who have sex with men. This
1
was conducted by MEN-Fiji and PacS-RHRC, and the results were announced but not published at the time of developing this strategic plan.
The research of the AIDS Task Force of Fiji was supported by UNDP.15 Respondents reported a diversity of sexual and gender identities and gender expressions: straight, bisexual, gay and transgender were terms that people used to describe themselves. Many had lives that are integrated with the broader Fiji community and do not want to develop a separate “gay” community, though they do want a stronger sense of community with each other. Many had sex with women as well as men (48.1% had ever done this), thus indicating the need to ensure HIV transmission remains low within this group as a strategy to keep HIV incidence low within the whole community. The majority were in regular relationships but 84% reported one or more casual sexual partners within the previous six months. Anal sex was common (98.1% had engaged in this in the previous six months) and, while condom use was common it was not universal and condoms were not used in all encounters. Alcohol and drug use were not associated with decisions on whether to use condoms. Many men and transgender people who have sex with men reported severe experiences with stigma and discrimination, including being talked about by others, suffering verbal abuse and very high levels of physical abuse: 30.3% had been physically hurt in the last six months. Rates of HIV testing were very low, with only 10.5% having had an HIV test and been back to find the results in the last 12 months. The report made clear that negative experiences of health services which did not understand their lives or needs were barriers to both seeking health services and returning to them. The experiences of people living with HIV were explored through research by FJN+. This included development of a baseline Stigma Index in 2010, which outlines the experiences of people living with HIV in Fiji. This identified barriers to people joining the network and barriers to people accessing other health services.
Research on the experiences of HIV positive women was reported by the Pacific Islands AIDS Foundation (PIAF) in 2011.16
This found two areas in which HIV positive women’s experiences are different to those of other women or those of HIV positive men.
First, women generally assume more responsibility of home-based care for those who are infected and affected, especially for those who are sick or dying as a result of HIV&AIDS, along with the orphans. Girls are taken out of school (rather than their brothers) to care for family members who are HIV positive. While positive men are usually cared for by their partners, mothers, sisters and daughters, women who are either widowed by AIDS or who are positive themselves are often isolated and excluded, in many situations having no property rights which can result in them being thrown out of their home.
Second, HIV positive women are more likely to experience gender-based violence, struggle to access treatment and basic health services due to the competing priority to provide basic needs, such as food, for their families, and due to the costs associated with travel to access treatment. Most testing for HIV happens in antenatal clinics resulting in women often being the first person in a relationship or family to find out their status, as a result women are often blamed for bringing HIV into relationships and experience violence from their partner, family and community as a result. The existence or fear of violence impacts on women’s decision to disclose their status and seek treatment. In many cases, positive women face stigma and exclusion, which is aggravated by their lack of rights.
Because many Fijians are not in the usually described “key populations”, research was also conducted by UNDP to provide better understanding of relationships and HIV risk in 2011.17 This explored marriages, de facto marriages and other relationships amongst 74 participants from six population groups: health workers, university students, religious leaders, taxi-cab drivers, lesbian, gay and transgender persons, and people in sex work. Five of the 74 were HIV positive. This research found that respondents did not have good understanding of HIV and STI risks with regular intimate partners, did not use condoms consistently, and had poor skills in identifying their own levels of risk.
and some believed that testing is itself a method of prevention. Knowledge of STIs, including causes, names and symptoms, was minimal. Frank discussion rarely took place between partners about sex, condoms, desire, or STI and HIV transmission. This research indicates that most people “externalise risk”, meaning that they consider risk of HIV and STIs occurs only for other people, particularly for sex workers. The report recommends that prevention programs and health services increase efforts to help people to understand that intimacy carries risks, even with people who are well known.
The National Food and Nutrition Centre of the Ministry of Health will undertake an Assessment of Nutritional Status and Dietary Intake of people living with HIV, in collaboration with FJN+ and PIAF, in the final months of 2010.
National HIV Legislation – The HIV/AIDS Decree 2011
There had not been a legal framework for the Fiji national HIV response until The Fiji HIV/AIDS Decree was gazetted by the Government in February 2011. The Decree was developed over seven years and outlines a human rights framework for the response to the HIV epidemic from this point on. The HIV/AIDS Decree has been acknowledged both locally and internationally as one of the most progressive HIV laws in the world.17 The UNAIDS Fiji country review18 presents a succinct summary of the key aspects of the 45-section Decree as follows: The Decree aims to safeguard the privacy and rights of persons infected or affected by HIV and AIDS, by:18
Ensuring the confidentiality of personal information;
Creating an environment where persons are encouraged to access voluntary testing, counselling, and support services;
Empowering an affected person to seek redress from professional bodies and the courts if their rights have been violated; and
Promoting the need for everyone to be personally responsible for their own health and that of others through a duty of care
The Government of Fiji lifted its restrictions on entry, stay or residence based on HIV status in August 2011 and it was officially announced by the President of Fiji at the 10th International Congress on AIDS in Asia and the Pacific, which was held in South Korea.19
The HIV/Decree also legislates for the formation of a new multi-sectoral HIV/AIDS Board, which will be the body that reviews and adopts the 2012 - 2015 national strategic plan.19
The HIV/AIDS Decree provides a legal and political environment for implementation of the 2012 – 2015 strategic plan in ways which ensure that “recognized universal human rights standards” are adopted, “To protect all such rights including the highest possible standard of physical and mental health including the availability and accessibility of HIV prevention and HIV/AIDS treatment, care and support for all persons regardless of age, gender, gender orientation or sexual orientation”. The HIV/AIDS Decree provides that any policies issued by the HIV/AIDS Board will have the force of law, and that any person who contravenes the policies commits an offence. The Decree indicates in the clearest possible terms a political will to adopt a law based on the International Guidelines.
National Strategic Plan
The period covered by the GAPR 2012 was the final two years of the implementation of the five-year 2007 – 2011 NHSP. The NHSP had five priority areas with the following objectives:
Priority Area 1- Prevention: to reduce the risk of HIV transmission among identified vulnerable and marginalized populations and aimed at young people, vulnerable group, marginalised group, general community, and work places.
Priority Area 2 - Clinical management of HIV/AIDS: to provide services for VCCT (voluntary confidential counselling and testing) and comprehensive, cost effective, accessible, and sustainable HIV care and treatment services to eligible PLHIV.
Priority Area 3 - Continuum of care for people living with or affected by HIV: overlapped with priority area 2, with additional objectives to address stigma-related issues, to promote empowerment, and to strengthen community based programmes.
Priority Area 4 - Research, surveillance, and Monitoring and Evaluation; and Coordination and good governance.
Priority Area 5 - Coordination and good governanceaimed to ensure that national responses to HIV and AIDS were effectively coordinated and appropriate legislation and policies were in place to support HIV and AIDS management, in line with the principles of good governance, respect for human rights, and protection of the public.20
The NHSP described strategies and activities for each Priority Area and included costing for all activities. It also included a monitoring and evaluation plan with defined indicators and a data collection plan.
A review of the implementation of the NHSP 2007 – 2011 was conducted in 2011. The findings will be described in the next section of this report – the national response to the AIDS Epidemic. An important finding from discussions with a number of partners was that, few, if any of the organisations involved in the HIV response used the NHSP to guide their work. The civil society organisations were usually working in their area of expertise, eg counselling or peer education for young people. If their work happened to overlap with an aspect of the NHSP, that was fine. Secondly there was no coordination or monitoring of the work being done by civil society sector and no effort to relate it to what is expressed in the NHSP.
A new National Strategic Plan was developed in 2011 for the period 2012 - 2015, informed by the findings from the review of the 2007 – 2011 NHSP. This NSP will put into practice the intentions of the HIV/AIDS Decree. This will ensure that the whole population is aware of the importance of responding to the HIV epidemic, and of doing so in ways that adhere to the human rights and governance framework outlined in the Decree.
National HIV coordination mechanism
Until the end of 2011, the National Advisory Committee on AIDS (NACA) was responsible for coordinating the national HIV response. NACA was established in 1987, two years before the first HIV infection was detected in the country. With no epidemic to respond to, NACA was, understandably, not very active. Over the years there have been periods of inaction and periods when it functioned very well. NACA was chaired by the Minister of Health, who reports to the Cabinet. The membership of NACA has also varied significantly over the years. Initially, NACA was inclusive, with a membership consisting of all the partners involved in the national HIV response. Then the membership was streamlined and only two CSOs, selected by the Minister of Health, remained members. This alienated many of the former members of the organisation.
The functioning of NACA depended to a large extent on the Ministry of Health. The interest in, and time allocated to the HIV response, fluctuated, due to the burden of programs and responsibilities
committees to play a coordination role.
The enactment of the HIV Decree in February 2011 meant that HIV/AIDS Board, when established would replace NACA. The ten member HIV/AIDS Board has been established by mid 2011. Two members of the Board represent CSOs, and one of the CSO representatives is a persons living with HIV. The Board now has responsibility for the national HIV response, and has met twice.
Monitoring and evaluation framework
There is a monitoring and evaluation framework for the 2007 – 2011 NHSP, but like the rest of the document, it was never used. Ministry of Health monitors some aspects of the health sector response to HIV through the surveillance system established for the HIV program, such as the number of pregnant women tested for HIV, the number of people on ART, etc. However there is no central database. This means that the data is almost never analysed to identify trends or understand some aspect of the epidemic.
MOH is only one of the many partners of the HIV response. While many projects implemented by other partners are monitored and evaluated, and some organisations conduct thorough monitoring of their own projects, there is no central monitoring of the national response. Ironically, reports are often made to donors, including to the Secretariat of the Pacific Community (SPC), but these are not requested by the National Advisory Committee on AIDS or the Ministry of Health, because there are no staff designated to collate this monitoring information.
This includes a lack of monitoring of expenditure. The financial tables and graphs included in the Review of the NHSP 2007 – 2011 had to be developed specifically within this Review. It is noted that the Ministry of Health has limited monitoring capacity for any diseases, and it would make sense for monitoring of HIV and STI projects to be part of a general improvement in national monitoring capacity. Needless to say, without adequate central monitoring, there is also no central use of monitoring or evaluation information to inform development of policies or programs.
National funding of HIV and AIDS prevention, treatment and care and support
services
The total expenditure of the AIDS program from all sources for the years 2009 to 2011 is shown in Figure 7 below. The expenditures for 2010 and 2011 were US$2.1 million and US$2.25 million respectively. The expenditure for 2009 was twice the expenditures for 2010 and 2011. The contribution from the Fiji government averaged about US$450,000 a year and represented about 20% of the total expenditure for 2010 and 2011. The funding provided by development partners has roughly halved from 2009 to 2010.
The proportions of funding utilised for the different program categories are shown in Figure 8. Prevention had the largest share of the available resources, with 29%, followed by program management with 22%.
Figure 7: Total AIDS Expenditure (209 - 2011) disaggregated by funding source
Figure 8: Proportions of AIDS expenditure per program category
III.
National response to the AIDS epidemic
This section of the report draws on the review of the 2007 – 2011 NHSP which was conducted in September 2010, supported by UNAIDS.
Prevention is the top priority in the Fiji national HIV response and is allocated the lion’s share of the funding available for the response (see Figure 8 above). Since the inception of the 2007 – 2011 NHSP, there has been a great expansion of prevention activities, as well as improvements in methods used and collaboration between prevention partners.
The Fiji approach to prevention is a good example of what UNAIDS describes as “Combination Prevention”21,22. This means that prevention programs “deploy a blend of biomedical, behavioural,