Changes of bivalent chromatin
coincide with increased expression
of developmental genes in cancer
Stephan H. Bernhart
1,2, Helene Kretzmer
1,2, Lesca M. Holdt
3, Frank Jühling
1,2,4,5,
Ole Ammerpohl
6, Anke K. Bergmann
6,7, Bernd H. Northoff
3, Gero Doose
1,2, Reiner Siebert
6,8,
Peter F. Stadler
1,2,9,10,11,12& Steve Hoffmann
1,2,9Bivalent (poised or paused) chromatin comprises activating and repressing histone modifications at the same location. This combination of epigenetic marks at promoter or enhancer regions keeps genes expressed at low levels but poised for rapid activation. Typically, DNA at bivalent promoters is only lowly methylated in normal cells, but frequently shows elevated methylation levels in cancer samples. Here, we developed a universal classifier built from chromatin data that can identify cancer samples solely from hypermethylation of bivalent chromatin. Tested on over 7,000 DNA methylation data sets from several cancer types, it reaches an AUC of 0.92. Although higher levels of DNA methylation are often associated with transcriptional silencing, counter-intuitive positive statistical dependencies between DNA methylation and expression levels have been recently reported for two cancer types. Here, we re-analyze combined expression and DNA methylation data sets, comprising over 5,000 samples, and demonstrate that the conjunction of hypermethylation of bivalent chromatin and up-regulation of the corresponding genes is a general phenomenon in cancer. This up-regulation affects many developmental genes and transcription factors, including dozens of homeobox genes and other genes implicated in cancer. Thus, we reason that the disturbance of bivalent chromatin may be intimately linked to tumorigenesis.
In recent years, a considerable amount of money and work has been spent to study cancer using modern high throughput sequencing experiments. However, especially when not only considering genomic, but also transcrip-tomic or epigenomic data, the evaluation and integration of the data is often missing. We here integrate thousands of DNA methylation and gene expression experiments from the International Cancer Genome Consortium1
(ICGC) and The Cancer Genome Atlas (TCGA)2 with chromatin state segmentations from the NIH Roadmap
Epigenomics Project3 to assess the impact of bivalent chromatin in cancer.
Bivalent promoters and enhancers are abundant chromatin states in both, stem cells and differentiated cells4.
They are characterized by the simultaneous enrichment of activating (e.g. Histone H3 lysine 4 monomethyl-ation [H3K4me1] or trimethylmonomethyl-ation [H3K4me3]) and repressing (e.g. H3K27me3) chromatin modificmonomethyl-ations5.
While the associated genes are repressed, bivalent promoters are pre-loaded with poised polymerase II (Pol II) to prepare genes for rapid activation4,6,7. Bivalent chromatin is frequently found within the promoter regions of
developmentally important genes8,9. These regions have been suggested to “safeguard differentiation”5, and their
malfunction might have a profound impact on the cell.
1Leipzig University, Chair of Bioinformatics, Leipzig, 04107, Germany. 2Leipzig University, Transcriptome
Bioinformatics Group - Interdisciplinary Center for Bioinformatics, Leipzig, 04107, Germany. 3
Ludwig-Maximilians-University, Institute of Laboratory Medicine, Munich, 81377, Germany. 4Inserm, U1110 - Institut de Recherche sur les
Maladies Virales et Hépatiques, Strasbourg, 67000, France. 5Université de Strasbourg, Strasbourg, 67000, France. 6Christian Albrechts University & University Hospital Schleswig-Holstein - Campus Kiel, Institute of Human Genetics,
Kiel, 24105, Germany. 7Christian Albrechts University Kiel & University Hospital Schleswig-Holstein - Campus Kiel,
Department of Pediatrics, Kiel, 24105, Germany. 8Ulm University & Ulm University Medical Center, Institute for
Human Genetics, Ulm, 89081, Germany. 9Leipzig University, LIFE - Leipzig Research Center for Civilization Diseases,
Leipzig, 04107, Germany. 10University of Vienna, Department of Theoretical Chemistry, Vienna, 1090, Austria. 11
Max-Planck-Institute for Mathematics in Sciences, Leipzig, 04103, Germany. 12Santa Fe Institute, Santa Fe, NM 87501,
USA. Correspondence and requests for materials should be addressed to S.H. (email: steve@bioinf.uni-leipzig.de) Received: 01 June 2016
accepted: 27 October 2016
Published: 23 November 2016
While DNA at bivalent promoters carries low levels of methylation in normal cells3,10, it was reported to be
hypermethylated in cancer11–15. Accordingly, we showed in a recent study on the genome wide DNA methylation
in two different sub-types of malignant lymphoma and normal controls, that the mean DNA methylation change at bivalent promoters of lymphoma samples is up to three times higher than in other chromatin state segments16.
Unexpectedly, the majority of genes controlled by such hypermethylated bivalent promoters simultaneously showed increased expression levels in lymphoma samples. An up-regulation of genes controlled by bivalent pro-moters was recently shown in colorectal cancers17. However, it was reported that hypermethylation led to the
continued repression of genes. Several other publications describe a continued repression of genes controlled by bivalent promoters via hypermethylation, suggesting that a loss of flexibility in gene expression contributes to tumorigenesis15,18,19. The vast amount of publicly available data allowed us to investigate whether the positive
statistical dependence, or more informally positive correlation, of DNA methylation and gene expression is a common feature of different cancer types, or whether it is a lymphoma-specific phenomenon. Furthermore, we analyzed which types of genes are affected by this phenomenon.
Results
Distribution of bivalent chromatin in human cells.
Chromatin state segmentations are maps iden-tifying genomic intervals with distinct functional chromatin states, defined by characteristic combinations of histone modifications20. We analyzed 127 publicly available human chromatin state segmentations generatedby NIH Roadmap (Supplementary Table S1) and 7 additional cancer cell line chromatin state segmentations (BLUEPRINT consortium21). We generated the chromatin state segmentations for the BLUEPRINT cell lines
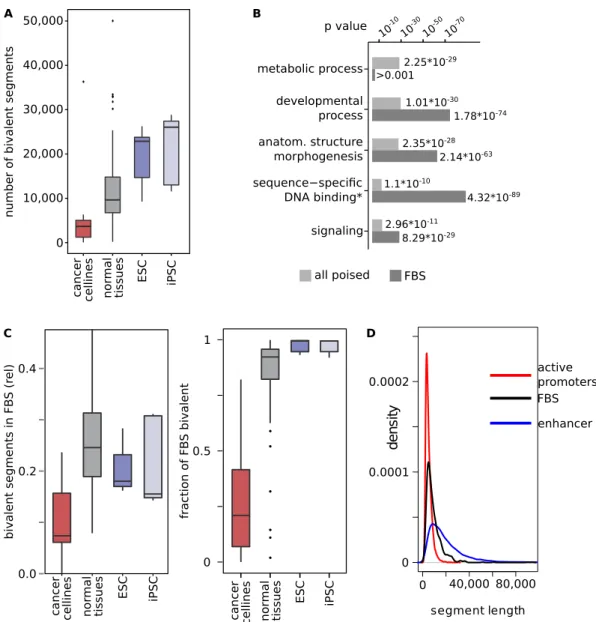
using the same method used by Roadmap. We confirmed that bivalent segments, i.e. bivalent promoters and bivalent enhancers, are present in all analyzed tissues. However, the total numbers differed strongly (Fig. 1A). As expected, embryonic stem cells (ESC) and induced pluripotent stem cells (iPSC) contained about twice as many bivalent segments on average compared to other tissues. Cancer cell lines, on the other hand, had the smallest number of bivalent segments. Differences of the same magnitude could not be observed for other chromatin state segments (see Supplementary Fig. S1A). In part, the usage of more heterogeneous tissue samples (as opposed to the homogeneous cancer cell lines) might explain this phenomenon. However, 60 of 109 of the differentiated tissue chromatin state segmentations were created using either cultured cells, cell lines or sorted blood cells that do not show the heterogeneity of tissue samples. Restricting the analysis to the 122 non-cancer chromatin state segmentations, and intersecting them with the Gencode v19 gene annotation22, we confirmed that genes
associ-ated with bivalent chromatin, i.e. genes with bivalent chromatin in their promoter regions or gene bodies, have a highly significant enrichment of the gene ontology (GO)-terms related to transcriptional activity and develop-mental processes, but also, e.g., to metabolic processes (see Fig. 1B, Supplementary Table S2).
Frequently bivalent segments.
To compare different cancer types, we were interested in genomic regions that have bivalent marks in the majority of cell types. We thus merged all non-cancer chromatin state segmen-tations of the NIH Roadmap, and identified 918 genomic regions that were bivalent in more than 80% (i.e. at least 98, frequently bivalent segments, FBSs) of normal cells. On average, 25% of the bivalent regions within a single data set overlapped FBSs (Fig. 1C). Recent publications used segments bivalent in ESC to study bivalent marks11,13,23–25. Since ESCs and iPSCs have a much higher number of bivalent segments than differentiated cells,FBS are designed to have a higher stability: a median of 87% of FBSs are overlapping bivalent segments in chro-matin state segmentations of differentiated cells. In contrast, only 49% of a set of ESC derived bivalent segments overlap bivalent segments in differentiated cells (Supplementary Fig. S1B). However, all FBSs overlap a bivalent region in at least one ESC. The 80% requirement makes FBSs relatively robust against single erroneous segmen-tations. In the mean, FBSs span 9,300 nucleotides, which puts them between similarly defined active promoter (mean length = 5,000 nt) and enhancer (mean length = 20,000 nt) segments (Fig. 1D). Some FBSs spanning gene clusters such as the HOXA, HOXB and HOXC clusters, are up to 93,000 nt long. Among genes associated with FBSs (1,406 FBS genes), the enrichments of GO-terms related to transcriptional activity, developmental processes, and signaling were even stronger than among all bivalent segment genes. (cf. Fig. 1B, Supplementary Table S2).
Chromatin bivalency is largely lost in cancer cell lines.
In contrast to normal cells, bivalent segments in cancer cell lines showed a strong difference in number as well as their genomic locations. Cancer cell lines had fewer bivalent segments than all other chromatin types. Conversely, only an average of 28% of FBSs are bivalent in cancer cell lines, compared to 87% in normal cells (Fig. 1C), suggesting a disruption of chromatin bivalency in cancer cell lines. The strong enrichment of ESC-defined bivalent promoters that was shown for cancer associated promoters in fresh gastric cancer tissue26 supports this finding, since changing the state of bivalent promotersimplies a loss of H3K4me3, and thus of bivalency.
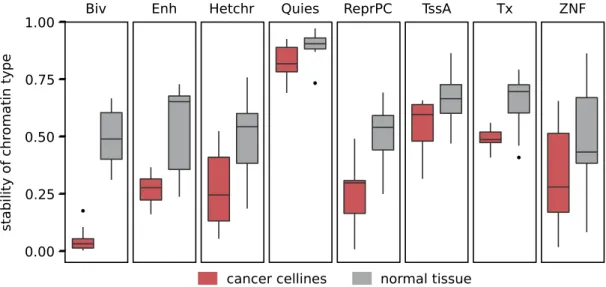
To analyze whether the loss of bivalent chromatin in cancer cell lines only reflects a general restructuring of the chromatin, we investigated the stability of chromatin types between related cell types. To this end, we paired the 11 segmentations of cancer cell lines with segmentations of their tissues of origin (subsequently called cancer cases). As a control, we created 11 pairs of closely related normal cells (subsequently called normal cases). As expected, the stability of most chromatin types was smaller in cancer cases than in the normal cases. However, the stability of bivalent chromatin in cancer cases was clearly the lowest when compared to all other states (Wilcoxon
p< 10−4, Fig. 2). Likewise, bivalent chromatin showed a bigger difference in stability between cancer cases and
normal cases than any other chromatin type (z-score 2.27). Recently, Hahn et al. described a “high instabil-ity or variabilinstabil-ity of bivalent promoters in colorectal cancer”17. Additionally, less detailed ChIP-Seq experiments
on other fresh cancer tissue21,26,27 show that bivalent segments are less well conserved than active or repressed
segments (Supplementary Fig. S2). In summary, these findings suggest that tumorigenesis is accompanied by a systematic disruption of bivalent chromatin marks in cancer.
Hypermethylation of bivalent chromatin in bisulfite sequencing data.
As DNA at bivalent chro-matin is usually very lowly methylated, we suspected that the hypermethylation of bivalent chrochro-matin in normal cells is accompanied by the loss of bivalency. A previous report on the correlation of hypermethylation with the loss of cancer related promoters in fresh gastric cancer26, is in line with this assumption. To further test thishypothesis, we compared the DNA methylation changes of chromatin state segments that lost their bivalent state in cancer cell lines to those that stayed bivalent or were only bivalent in cancer cell lines. This test included cell lines for five different types of cancer. In all data sets, hypermethylation of regions that lost their bivalency was sig-nificantly stronger (p< 10−9) than for stably bivalent regions, indicating that hypermethylation might indeed be
associated with the loss of bivalency. On average, new bivalent regions did not show hypermethylation (Fig. 3A). Figure 1. Bivalent chromatin segments in normal and cancer tissues. (A) Cancer cell lines show less bivalent regions than other types of cells. Number of bivalent chromatin segments in cancer cell lines (red), normal tissues or cells (grey), embryonic stem cells (ESC, blue) and induced pluripotent stem cells (iPSC, light blue). Stem cells on average have the highest number of bivalent segments, while cancer cell lines have low numbers of bivalent segments. (B) GO-term enrichment for genes associated to bivalent chromatin segments. Light grey: genes associated to any bivalent segment; Dark grey: Genes associated to a frequently bivalent segment (FBS genes). The enrichment of metabolic process genes is lost in FBSs, while the FBS genes are stronger enriched in the GO-terms developmental processes, anatomical structure morphogenesis, (*) sequence-specific DNA binding RNA polymerase II transcription factor activity and signaling. (C) FBSs well reflect normal bivalent chromatin states. Left: Fraction of bivalent chromatin segments that are part of a FBS in cancer cell lines (red), normal tissues or cells (grey), ESC (blue) and iPSC (light blue). On average, cancer cells are depleted in bivalent chromatin overlapping FBSs. Right: Fraction of FBSs that are bivalent in cancer cell lines (red), normal tissues or cells (grey), ESC (blue) and iPSC (light blue). FBSs are infrequently bivalent in cancer cell lines compared to normal cells. (D) Length distribution of FBSs (black) and segments based on active promoters (red) and enhancers (blue).
We re-analyzed the whole genome bisulfite sequencing (WGBS) data sets of Burkitt Lymphoma (BL) and Follicular Lymphoma (FL)16 to confirm genome wide hypermethylation of bivalent chromatin segments. Using
a chromatin state segmentation of fresh primary B cells, we confirmed bivalent chromatin hypermethylation in lymphomas as compared to germinal center B cells. This was in contrast to the genome-wide loss of DNA meth-ylation in BL (mean = − 0.06) and FL (mean = − 0.04) (Fig. 3B). Similar results were found for the WGBS data of acute lymphoblastic leukemia (ALL)28 and Medulloblastoma29 (Supplementary Fig. S3). Furthermore, in all but
one case (Group 4 Medulloblastoma), bivalent states show the strongest hypermethylation of all chromatin states. About a third of all FBSs are longer than 10,000 nucleotides, while bivalent regions in single chromatin state segmentations are much shorter, with less than 5% longer than 2,000 nt. We investigated whether the hyper-methylation in cancer spans entire FBSs or is restricted to the shorter sub-segments that are bivalent in the cells of origin. Our analysis revealed that individual cell specific bivalent regions are frequently embedded in larger regions that are hypermethylated in cancer. In contrast, FBSs appear to better capture the entire regions that undergo hypermethylation. This is indicated by a sharp decrease of methylation level to the background level at the borders of FBSs (Fig. 3C, Supplementary Fig. S4), irrespective of the size of the FBSs. Thus, FBSs describe the borders of the regions of hypermethylation better than single bivalent regions do.
Bivalent chromatin DNA methylation as a universal cancer marker.
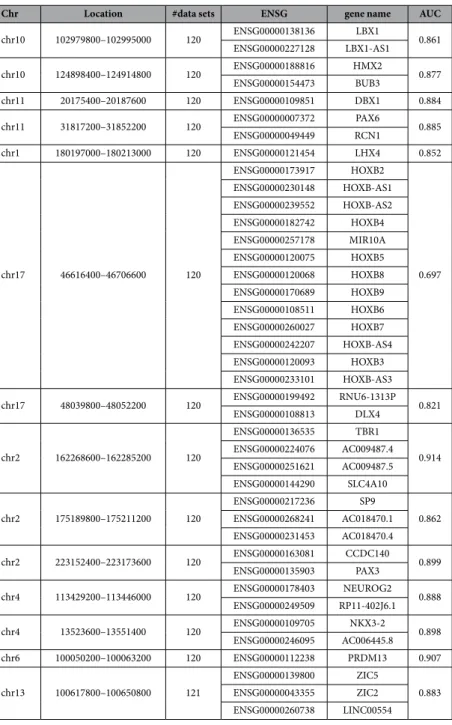
If the hypermethylation of biva-lent segments and loss of bivalency was indeed a common phenomenon in cancer, it should be possible to distin-guish cancer samples from normal tissue solely based on the DNA methylation levels of FBSs. To test this hypothesis, we considered the average relative DNA methylation level (see Methods) of the CpGs in the 14 FBSs that were biva-lent in almost all (at least 120 of the 122) normal tissue segmentations in the Roadmap data set (Table 1). Note, that this approach works without a previous training step as is often used for DNA methylation classifiers.Evaluating 450 k methylation array data from 6,347 cancers and 1,361 controls from various tissues (Supplementary Table S3), we found that the relative DNA methylation of these segments separated cancer and normal samples with high sensitivity and specificity (AUC = 0.926; Fig. 3D). Despite the high heterogeneity of cancer types and the relatively small number of 1,163 CpGs, their relative DNA methylation level provided a general and robust predictor of cancer (Table 2). Smaller subsets of the FBSs also identify cancer samples with consistently high AUC values (Supplementary Fig. S5, single FBS AUC in Table 1). In line with our results, pre-vious attempts to classify individual cancers based on CpG methylation showed enrichment of bivalent genes in predictive areas24,25.
Our classifier overlapped with 24 protein coding genes, including 14 homeobox genes among which are seven HOX genes, two PAX genes (PAX3 and PAX6), LBX1, and DBX1. Additionally, it contained nine other genes involved in developmental processes, e.g. TBR1, ZIC2 and ZIC5. Many of these genes were frequently up-regulated in the ICGC cancer data (Supplementary Fig. S6).
To disentangle the impact exerted by bivalent enhancers and promoters, we repeated the classification with the most frequently bivalent promoters and enhancers, separately. These classifiers showed comparable perfor-mances, providing evidence that hypermethylation in cancer is a general phenomenon of bivalent chromatin, and is not restricted to promoters or enhancers (Fig. 3D). For all three classifiers, the lowest sensitivities and specifici-ties were observed for renal carcinomas, stomach adenocarcinoma, and thyroid carcinoma, with an AUC ≥ 0.73. Figure 2. Cancer cell lines lose bivalent chromatin. Comparison of stability of chromatin state segments between related normal cells (grey) and cancer cell lines and their cells of origin (red). Stability described as relative number of nucleotides of the respective chromatin type where type is the same in both cells. Bivalent segments (Biv) are the least stable chromatin state segments in cancer cell lines, while they show average stability in related normal cells. Biv: Bivalent chromatin, Enh: Enhancer, Hetchr: Heterochromatin, Quies: Quiescent, TssA: Active promoter, Tx: Transcribed, ZNF: Zinc-finger/insulator, ReprPC: Polycomb repressed.
16 types of cancer could be classified with high sensitivities and specificities (AUC > 0.9), of which 13, including lung and rectum carcinomas, even showed AUC > 0.95 (Table 2).
Additionally, we attempted to determine the tumor cell content expected to be necessary to predict cancer with this method. The estimated tumor cell content necessary for 95% true positive and 5% false negative rate varied from 27% in pancreas adenocarcinoma (PAAD) to about 77% in breast carcinoma (Supplementary Fig. S7, Supplementary Table S4). Correlations of descriptor methylation with tumor stage and grade were weak. We found a positive correlation to tumor stage (i.e. higher methylation in higher stages) in three cancer types (Kidney Renal Clear Cell Carcinoma (KIRC), Kidney Renal Papillary Cell Carcinoma and Head and Neck Thyroid Carcinoma), and negative correlation in Colon Adenocarcinoma. Histological tumor grades were available for seven cancer types. We found a positive correlation with grade in KIRC and PAAD (Supplementary Fig. S8, Figure 3. Hypermethylation of bivalent chromatin in cancer tissues. (A) Loss of bivalency is associated to hypermethylation. DNA methylation change of bivalent segments in relation to their stability. DNA methylation change for fresh cancer (left) and cancer cell lines (right) is shown for all elements in the cells of origin. Violet: chromatin bivalent in cancer and cell of origin, blue: chromatin no longer bivalent in cancer, grey: chromatin bivalent in cancer but not in cell of origin. (B) Bivalent chromatin regions show highest hypermethylation. DNA methylation difference for the 15 Roadmap chromatin states in BL. Bivalent states (grey box) show the strongest hypermethylation. (C) FBS regions are hypermethylated along their whole length. DNA methylation difference in BL at (grey marked area) and around FBSs, shown for FBSs > 10,000 nt (black), FBSs < 10,000 nt (blue), FBS sub-segments bivalent in primary B cells (red) and segments bivalent in primary B cells but not overlapping FBS (brown). (D) Methylation of bivalent regions is a good descriptor of cancer. ROC curve using relative descriptor methylation of FBSs (orange), bivalent enhancer (black), bivalent promoters (green), polycomb repressed regions without FBS (ocher) and ESC derived classifier (blue).
Supplementary Table S5). Nevertheless, correlations of the relative descriptor methylation with the tumor cell content were considerably higher (Supplementary Fig. S8A).
Hypermethylation and up-regulation of genes as a global phenomenon in cancer.
To test whether the association of bivalent segment hypermethylation with increased expression at the corresponding gene loci is a ubiquitous phenomenon in cancer, we evaluated expression using 5,545 RNA-Seq data sets and DNA methylation rates from 6,246 450 k arrays of 19 types of cancer and their respective controls published by ICGC and TCGA (Table 3). As some (9 of 19) cancers lack a chromatin state segmentation for their tissues of origin, we used FBSs for our analysis (we recall that on average, 87% of FBSs are bivalent in a chromatin state segmentation of a normal cell).We first investigated genes associated to FBSs (FBS genes) that were significantly differentially expressed. This analysis revealed a large degree of positive dependence between increased expression of FBS genes and increased DNA methylation: 15 of 19 cancers showed a significant up-regulation (mean log2 fold change: 0.94) and hypermethylation (mean change 0.07) in more than 40% of the FBS genes. To eliminate a possible bias due to the low baseline expression level of most FBS genes, we repeated the same analysis using only the subset of lowly
Chr Location #data sets ENSG gene name AUC
chr10 102979800–102995000 120 ENSG00000138136 LBX1 0.861 ENSG00000227128 LBX1-AS1 chr10 124898400–124914800 120 ENSG00000188816 HMX2 0.877 ENSG00000154473 BUB3 chr11 20175400–20187600 120 ENSG00000109851 DBX1 0.884 chr11 31817200–31852200 120 ENSG00000007372 PAX6 0.885 ENSG00000049449 RCN1 chr1 180197000–180213000 120 ENSG00000121454 LHX4 0.852 chr17 46616400–46706600 120 ENSG00000173917 HOXB2 0.697 ENSG00000230148 HOXB-AS1 ENSG00000239552 HOXB-AS2 ENSG00000182742 HOXB4 ENSG00000257178 MIR10A ENSG00000120075 HOXB5 ENSG00000120068 HOXB8 ENSG00000170689 HOXB9 ENSG00000108511 HOXB6 ENSG00000260027 HOXB7 ENSG00000242207 HOXB-AS4 ENSG00000120093 HOXB3 ENSG00000233101 HOXB-AS3 chr17 48039800–48052200 120 ENSG00000199492 RNU6-1313P 0.821 ENSG00000108813 DLX4 chr2 162268600–162285200 120 ENSG00000136535 TBR1 0.914 ENSG00000224076 AC009487.4 ENSG00000251621 AC009487.5 ENSG00000144290 SLC4A10 chr2 175189800–175211200 120 ENSG00000217236 SP9 0.862 ENSG00000268241 AC018470.1 ENSG00000231453 AC018470.4 chr2 223152400–223173600 120 ENSG00000163081 CCDC140 0.899 ENSG00000135903 PAX3 chr4 113429200–113446000 120 ENSG00000178403 NEUROG2 0.888 ENSG00000249509 RP11-402J6.1 chr4 13523600–13551400 120 ENSG00000109705 NKX3-2 0.898 ENSG00000246095 AC006445.8 chr6 100050200–100063200 120 ENSG00000112238 PRDM13 0.907 chr13 100617800–100650800 121 ENSG00000139800 ZIC5 0.883 ENSG00000043355 ZIC2 ENSG00000260738 LINC00554
Table 1. FBS classifier regions and genes associated. Location, number of contributing data sets, genes associated to the FBS classifier set and AUC when segment is used alone as a classifier.
Project AUC bivalent promoter AUC bivalent enhancer AUC FBS BL 0.928 0.883 0.9 BLCA-US 0.948 0.967 0.97 BRCA-US 0.925 0.958 0.963 CESC-US 1 1 1 COAD-US 0.982 0.984 0.979 ESCA 0.994 0.983 0.994 FL 0.945 0.923 0.921 HNSC-US 0.985 0.991 0.991 KIRC-US 0.987 0.847 0.944 KIRP-US 0.728 0.83 0.828 LIHC-US 0.92 0.904 0.92 LUAD-US 0.994 0.998 0.999 LUSC-US 0.995 0.995 0.998 PAAD-US 0.971 0.956 0.964 PRAD-US 0.893 0.911 0.909 READ-US 0.998 0.995 0.987 SKCM-US 0.965 0.968 0.978 STAD-US 0.824 0.73 0.794 THCA-US 0.875 0.867 0.885 UCEC-US 0.972 0.981 0.976 median 0.968 0.9625 0.967
Table 2. AUC of classifiers for the different ICGC and TCGA data sets.
Project Meth. t Meth. n Exp. t Exp. n Cancer name
BL 32 16 18 5 Burkitt’s Lymphoma
BLCA-US 198 19 405 19 Bladder Urothelial Cancer
BRCA-US 662 96 766 88 Breast Cancer
CESC-US 124 3 296 3 Cervical Squamous Cell Carcinoma
CLLE-ES 58 0 — — Chronic Lymphocytic Leukemia
COAD-US 271 37 282 41 Colon Adenocarcinoma
ESCA 174 13 173 10 Esophagus Cancer
FL 26 16 46 5 Follicular Lymphoma
GBM-US 59 0 — — Brain Glioblastoma Multiforme
HNSC-US 376 50 261 31 Head and Neck Squamous Cell Carcinoma
KIRC-US 285 158 472 68 Kidney Renal Clear Cell Carcinoma
KIRP-US 132 44 289 32 Kidney Renal Papillary Cell Carcinoma
LAML-US 170 0 — — Acute Myeloid Leukemia
LGG-US 297 0 — — Brain Lower Grade Glioma
LIHC-US 140 44 16 9 Liver Hepatocellular Carcinoma
LUAD-US 395 28 124 37 Lung Adenocarcinoma
LUSC-US 277 42 224 17 Lung Squamous Cell Carcinoma
OV-AU 116 0 — — Ovarian Cancer
PAAD-US 69 2 483 4 Pancreas Adenocarcinoma
PAEN-AU 34 0 — — Pancreatic Cancer Endocrine neoplasms
PRAD-US 198 46 483 51 Prostate Adenocarcinoma
READ-US 94 7 91 10 Rectum Adenocarcinoma
SKCM-US 332 2 104 1 Skin Cutaneous Melanoma
STAD-US 245 2 — — Gastric Adenocarcinoma
THCA-US 494 53 500 57 Head and Neck Thyroid Carcinoma
UCEC-US 364 34 329 5 Uterine Corpus Endometrial Carcinoma
total 5622 696 5362 488
Table 3. Number of ICGC and TCGA data sets used. Meth. t: number of tumor 450 k methylation arrays used. Meth.n: number of control 450 k methylation arrays used. Exp. t: Number of tumor RNA-Seq data sets used. Exp. n: number of control RNA-Seq data sets used.
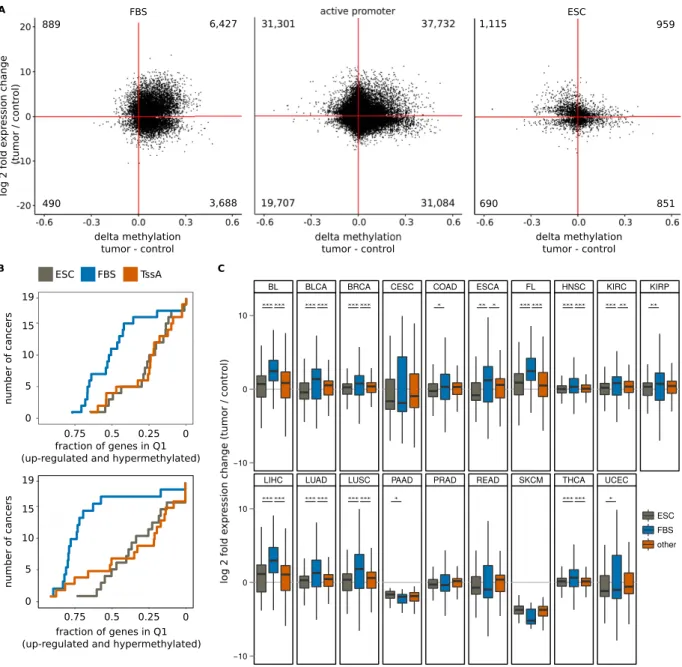
expressed FBS genes to a background of lowly expressed genes. For these lowly expressed background genes, the same statistical problems as for lowly expressed FBS genes apply, eliminating possible biases caused by the low baseline expression. Again, in 17 of the 19 cancer data sets, lowly expressed FBS genes were mostly hypermethyl-ated and significantly up-regulhypermethyl-ated (Fig. 4A,B, Supplementary Fig. S9). Compared to genes associhypermethyl-ated to genomic regions that are bivalent only in embryonic stem cells, FBS genes again showed a higher proportion of hypermeth-ylated and significantly up-regulated genes in all but two cancer types.
Figure 4. Up-regulation of bivalent chromatin genes in cancer tissues. (A) Scatter plots of DNA methylation change versus expression change for significantly differentially expressed FBS genes (left) and controls: active promoter background (center) and chromatin bivalent in ESC exclusively (right). (B) Cumulative plot of the number of cancers and gene/promoter pairs in quadrant one (Q1, hypermethylation and up-regulation) as the fraction of FBS genes (blue), ESC genes (grey) and background (red). Top: Only significantly differentially expressed genes are considered. Bottom: Only lowly and differentially expressed genes are considered. (C) Box-plot showing the expression change of FBS genes (blue), genes bivalent in ESC (grey) and other genes (red). Significance (Wilcoxon) of comparisons: ***p< 2.2 × 10⁻⁹, **p< 10−3, *p< 0.05. BL: Burkitt’s Lymphoma,
BLCA: Bladder Urothelial Cancer, BRCA: Breast Cancer, CESC: Cervical Squamous Cell Carcinoma, COAD: Colon Adenocarcinoma, ESCA: Esophagus Cancer, FL: Follicular Lymphoma, HNSC: Head and Neck Squamous Cell Carcinoma, KIRC: Kidney Renal Clear Cell Carcinoma, KIRP: Kidney Renal Papillary Cell Carcinoma, LIHC: Liver Hepatocellular Carcinoma, LUAD: Lung Adenocarcinoma, LUSC: Lung Squamous Cell Carcinoma, PAAD: Pancreas Adenocarcinoma, PRAD: Prostate Adenocarcinoma, READ: Rectum Adenocarcinoma, SKCM: Skin Cutaneous Melanoma, THCA: Head and Neck Thyroid Carcinoma, UCEC: Uterine Corpus Endometrial Carcinoma.
Many RNA-Seq experiments showed a bias towards up-regulation of genes in cancer. To compensate for this effect, we compared the expression changes of FBS genes to all genes. In 11 of 19 cancers, the up-regulation of FBS genes was significantly stronger than that of the background, while none showed significantly weaker up-regulation (Fig. 4C). When restricting the analysis to lowly expressed genes, the number of cancer types showing significantly stronger up-regulation of FBS genes increased to 16. Comparisons to the genes bivalent in ESC did closely resemble these results.
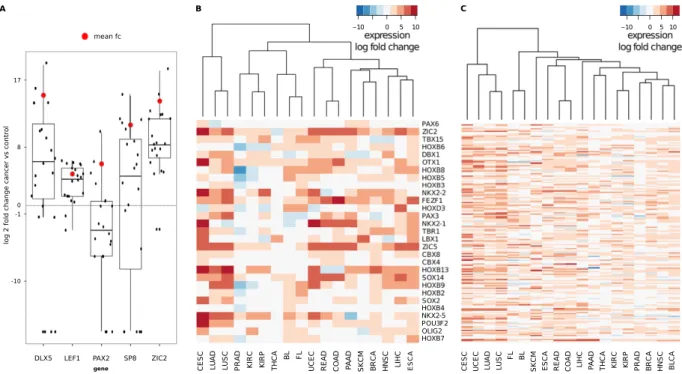
Verification of FBS-gene up-regulation. To verify the up-regulation of FBS genes, we chose five genes to per-form qPCR on 20 samples of primary hepatocellular carcinoma (HCC) and corresponding normal liver tissue (Fig. 5A). Comparable to the RNA-Seq results for all FBS genes, this small subset showed considerable variabil-ity among samples. However, again reflecting the behavior of FBS gene expression in most cancers, we found a median increase of expression for four of the five genes. Focusing on the only exception, PAX2, we found that 12 samples showed down-regulation, two even a total loss of expression. In contrast, six showed signifi-cant up-regulation, three even a more than ten-fold increase of expression. Taken together, these results were in accordance with the overall picture we found for all FBS genes: most genes are up-regulated, albeit showing a high variability in expression values. Genes that showed overall down-regulation usually showed up-regulation in some samples. Accordingly, FBS gene up-regulation is not an artifact introduced by next generation sequencing, but a genuine biological effect that can be verified using alternative techniques.
Analysis of up-regulated genes.
To analyze which types of genes were mostly affected by up-regulation, we chose the 172 FBS genes that were significantly up-regulated in more than 50% of all cancers we studied. The requirement of significant differential expression in at least 10 cancer data sets was chosen to minimize the effect of possible expression outliers. We compared these up-regulated genes to the 68 FBS genes that showed a significant down-regulation in more than half of the cancer data sets (Supplementary Table S6). Even against a background of all FBS genes, the up-regulated genes are enriched with the GO terms for homeobox domains (n= 37, 1.6 fold enrichment) as well as in genes for transcription regulation (n= 55, 1.3 fold enrichment) and developmental proteins (n= 45, 1.3 fold enrichment). In contrast, down-regulated genes showed a depletion of homeobox containing genes (n= 2, 0.22 fold enrichment), developmental genes (n= 7, 0.5 fold enrichment) and transcription regulation genes (n= 15, 0.87 fold enrichment).Figure 5. Expression of FBS genes. (A) Combined scatter and boxplots of expression differences in qPCR experiments for DLX5, LEF1, PAX2, SP8 and ZIC2 genes for 20 HCC cancer samples against normal liver tissue. The red dots show the log of the mean fold change, which is positive for all cancer experiments. (B) Heatmap of the expression log2 fold changes of selected FBS genes. Unsupervised clustering reveals expression similarities of FBS genes in related tissues. BL: Burkitt’s Lymphoma, BLCA: Bladder Urothelial Cancer, BRCA: Breast Cancer, CESC: Cervical Squamous Cell Carcinoma, COAD: Colon Adenocarcinoma, ESCA: Esophagus Cancer, FL: Follicular Lymphoma, HNSC: Head and Neck Squamous Cell Carcinoma, KIRC: Kidney Renal Clear Cell Carcinoma, KIRP: Kidney Renal Papillary Cell Carcinoma, LIHC: Liver Hepatocellular Carcinoma, LUAD: Lung Adenocarcinoma, LUSC: Lung Squamous Cell Carcinoma, PAAD: Pancreas Adenocarcinoma, PRAD: Prostate Adenocarcinoma, READ: Rectum Adenocarcinoma, SKCM: Skin Cutaneous Melanoma, THCA: Head and Neck Thyroid Carcinoma, UCEC: Uterine Corpus Endometrial Carcinoma. (C) Heatmap of expression changes for all FBS genes significantly up-regulated in more than 50% of the cancer data sets.
Unsupervised clustering of the expression fold changes of the FBS genes for all 19 cancer entities revealed similarities between cancers that originate from similar organs, such as lung squamous cell carcinoma (LUSC) and lung adenocarcinoma (LUAD) or rectum and colon adenocarcinoma (READ and COAD) (Fig. 5B,C). For the former pair, we observed a high expression of HOXC13, while the latter pair showed an up-regulation of SOX14. In addition, several members of the NKX homeobox family were frequently up-regulated. In particular, the cervix carcinoma produced high levels of NKX2-1, NKX2-2 and NKX2-5.
As homeobox genes have been shown to play an important role in both, oncogenesis and tumor suppression30,
we further investigated the up-regulated genes of this gene family. In our analysis, HOXB13, previously associated with ovarian31 and breast carcinoma32,33, was strongly up-regulated in lung, skin, breast and gynecologic
malig-nancies. OTX1, which has been connected to colon carcinogenesis and to non-hodgkin lymphoma34, was most
strongly up-regulated in cervical carcinoma, but also very strongly in READ and COAD.
READ and COAD also transcribed increased amounts of the forebrain embryonic zinc finger protein 1 (FEZF1), which has been implicated in the development of gastric cancers35. Among the highly up-regulated
genes, TBX15 showed the strongest hypermethylation across all cancer entities (median = 0.228). In the con-text of prostate carcinoma, the hypermethylation of TBX15 (as well as HOXD3) have been associated, via a positive correlation with ERG expression, to the histone deacetylase HDAC1, and a global epigenetic repro-gramming36,37. Interestingly, two polycomb-group genes, i.e., CBX4 and CBX8, are among the genes that show
significant up-regulation and hypermethylation in many cancer types. CBX8 has been connected to leukemogen-esis38, while CBX4 potentiates angiogenesis in hepatocellular carcinoma39. Naturally, the extent of differential
expression of the 172 genes comprising the set of frequently up-regulated FBS genes varies from cancer to cancer (Supplementary Table S7). However, 17 of the single cancer types, also had an enrichment of homeobox genes in the significantly up-regulated FBS genes. The two exceptions, PAAD and Skin Cutaneous Melanoma (SKCM), show very little significantly differentially expressed genes, due to the small number of control experiments.
Evidence for lower expression of FBS genes in cell lines.
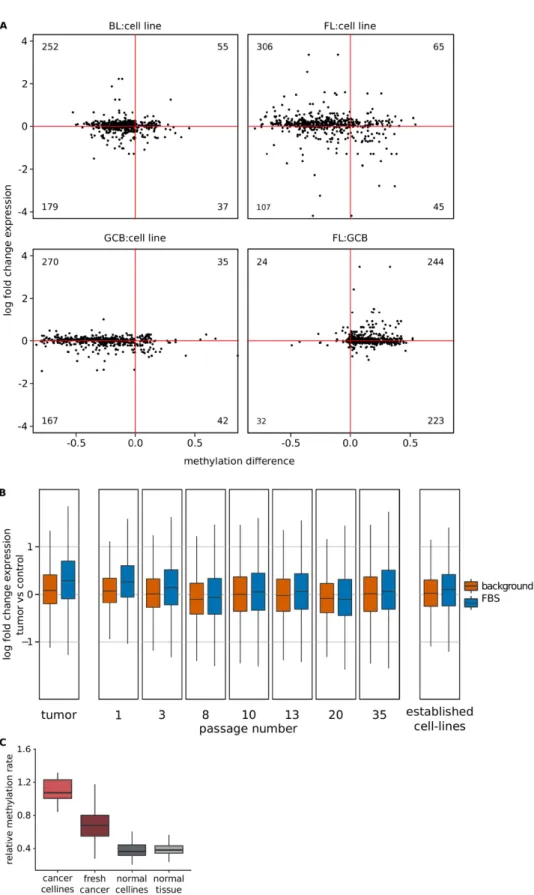
Earlier cell line based studies of hypermeth-ylation in bivalent regions did not report an up-regulation of associated genes15. To investigate this discrepancy,we compared DNA methylation16 and gene expression40–43 of lymphoma cell lines to fresh cancer tissue and
normal control cells. Indeed, our comparison revealed a hypermethylation of bivalent regions accompanied by a down-regulation of associated genes in the cell lines when compared to fresh cancer tissues (Fig. 6A). Our re-analysis of expression data of a glioblastoma cell line freshly generated by Lee et al.44 indicated that FBS genes
are gradually silenced with each passage. After a couple of passages, FBS genes show an expression profile close to that in control cells and other established cell lines (Fig. 6B). We could confirm the repression of FBS genes in independent data from cervix carcinoma cell lines45 and also found a small but significant (p< 0.008) reduction
of FBS gene expression in freshly generated cell lines from lung carcinoma metastasis46 (Supplementary Fig. S10).
We also investigated whether the relative classifier CpG methylation of cell lines is different to the one of primary tissues. Cancer cell lines (but not normal cell lines) showed a significantly higher relative descriptor CpG methyl-ation than fresh cancer tissues (p< 10−13, Fig. 6C).
Discussion
In an attempt to reconcile our seemingly controversial findings we recall that (i) hypermethylation of bivalent elements is a frequent event in fresh cancer tissues. Our data indicates that (ii) this effect is even more pronounced in several cancer cell lines and that chromatin bivalency is frequently lost in cancer cell lines. While we see (iii) an up-regulation of associated genes in fresh cancers, (iv) their repression seems to be largely intact in the cell lines. We propose that the hypermethylation, the up-regulation, and the loss of bivalent chromatin might have a common cause, namely a genome wide malfunction of poising. Such a malfunction would lead to a deregula-tion of genes silenced by pausing, and a genome-wide “activaderegula-tion” of poised Pol IIs followed by a transient gene expression. Subsequently, promoter DNA methylation, loss of activating chromatin marks and other causes could gradually re-silence some genes, while other genes acquire sufficient gene body DNA methylation, recruit an alternative promoter or remain active due to other reasons. This would lead to a signal mixture of both, elevated expression and DNA methylation, in fresh cancer tissues. The fact that cancer cell lines show a significantly higher DNA methylation and an intact repression might suggest that these cell lines have largely managed to re-establish the silencing via DNA methylation. In fact, our results are compatible with a quick repression of FBS genes occur-ring duoccur-ring the creation of cell lines. Alternatively, cell lines might simply represent a less heterogeneous subset of the tumor cells, which would explain the lower number of up-regulated genes. However, this does not explain the overall gain in bivalent segment DNA methylation. Although our data indicates that bivalent marks are frequently lost in cancer, we could not determine a rule to predict the fate of bivalent elements in neoplastic diseases, and we have no data on the chain of events that leads to this loss. However, the process of transcription itself can lead to an exchange of histone H3/H4 tetramers47, which might facilitate the loss of the chromatin marks necessary for
bivalency.
The mechanism that would lead to the activation of the Pol II also remains speculative. One possible trigger for the activation of poised Pol II is the proto-oncogene MYC. MYC is frequently over-expressed in cancer48, and
facilitates Pol II pause release by recruiting the positive transcription elongation factor (P-TEFb), a pause release factor, to the paused Pol II49. Therefore, MYC has been predicted to cause expression of formerly bivalent genes in
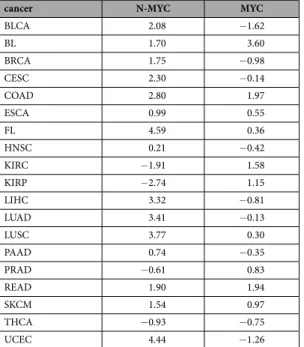
cancer49. However, the up-regulation bivalent genes is not limited to cancers over-expressing MYC (Table 4). The
DNA hypermethylation observed may be explained by the enrichment of two DNA methyltransferases (DNMT1 and DNMT3b) surrounding bivalent promoters in cancer cell lines50. It is tempting to speculate that DNA
meth-ylation at formerly bivalent chromatin is a backup to re-enforce repression in case of a disruption of poising, emphasizing the importance of keeping the respective genes under tight control.
Figure 6. Expression and DNA methylation of cancer cell lines. (A) DNA methylation and expression changes of FBSs in BL cell lines against BL fresh tissues (top left), KARPAS-422 against FL fresh tissues (top right), lymphoma cell lines against normal germinal center B-cells (bottom left) and germinal center B-cells against FL fresh tissues. Changes are shown relative to the cell lines. The number of pairs in each quadrant is shown. (B) Expression change of FBS genes (blue) and other genes against normal cells in glioblastoma fresh tissue (left) and in cancer cell lines after a number of passages. At the right, the value for commonly used cell lines is shown. (C) Relative methylation of classifier FBSs in cancer cell lines, fresh cancer tissue, normal cell lines and normal tissue.
The tight control on the epigenetic level coincides with selective pressures on the genomic level. The epige-netic Roadmap project showed that bivalent chromatin tends to be enriched in non-exonic conserved elements (GERP)51 compared to its respective active chromatin counterpart3. This is another hint for the functional
impor-tance of bivalent chromatin. A change of chromatin state is essential for hypermethylation, since the presence of H3K4me3 would still protect the DNA from methylation.
Bivalent chromatin is known to play an important role in normal tissue development, but also seems to be crucial for keeping cells in their differentiated states. The enrichment of FBS associated homeobox genes (21.5% of 172) is indicative of this function. Homeobox genes such as the HOX family have been implicated to play an important role in both, oncogenesis and tumor suppression30. Abate-Shen described that homeobox genes exert
their oncogenic effect via a strong over-expression or a temporospatially different expression pattern52.
Here, we show that the aberrant expression of developmental genes that are effectively no longer under the control of bivalent chromatin is present in various cancer types. In principle, such a runaway expression could lead to a de-differentiation of cells, much like the over-expression of the four Yamanaka factors used to generate induced pluripotent stem cells53. As an example, three out of four transcription factors (SOX2, POU3F2, and
OLIG2) recently shown to be able to reprogram differentiated Glioblastoma cells to stem-like tumor-propagating cells54 are associated to a FBS. The three bivalent segments corresponding to these genes showed
hypermethyl-ation across all cancer types (median DNA methylhypermethyl-ation difference 0.13, 0.09 and 0.09, respectively), while their expression showed a median log2 fold change of 1.7, 1.8 and 1.2, respectively. The association of FBS genes to HDAC1 and SOX2 opens the question whether the disturbance of bivalent gene regulation could cause wide-spread epigenetic reprogramming. Such an epigenetic reprogramming has been suggested as a route how epi-genetic alterations can contribute to tumorigenesis, by “compromising cellular differentiation pathways and facilitating the emergence of tumorigenic cells”55.
It has been shown that cancer risk factors, such as smoking or age, are correlated with the hypermethyla-tion of CpGs at bivalent regions24. For dysplasia cells, however, also an age independent component was shown.
Furthermore, the BL investigated here are pediatric cancers (median age 11 years), while the FL are mostly geri-atric (median age 62 years). The fact that we see only little difference regarding bivalent chromatin DNA methyl-ation and expression indicates that non age-related causes contribute to this effect.
Elucidating the molecular mechanisms behind this loss of the bivalent state has the potential to reveal novel preventive approaches against cancer. In the short term, measuring the DNA methylation of a small set of loci corresponding to frequently bivalent chromatin could provide a cost-effective and efficient universal cancer descriptor for diagnostic purposes. This test might be used globally to classify virtually all cancer types despite their cells of origin. The identification of frequently bivalent segments for special tissues can result in descriptors for sensitive and selective clinical diagnosis in types of cancer where other molecular descriptors are not yet available. Since bivalent marks are usually inferred from independent ChIP-Seq experiments, it cannot be ruled out that several bivalent marks annotated by the Roadmap Epigenomics project are artificial juxtapositions of H3K4me and H3K27me3 histone modifications. ChIP-reChIP experiments8,56 will help to improve the
annota-tion of bivalent promoters and other chromatin state segments in the future.
Methods
Data Acquisition.
We downloaded 127 15-state chromatin state segmentation annotations from the NIH Roadmap Epigenomics Project, including 16 chromatin state segmentations generated from ENCODE data.cancer N-MYC MYC
BLCA 2.08 − 1.62 BL 1.70 3.60 BRCA 1.75 − 0.98 CESC 2.30 − 0.14 COAD 2.80 1.97 ESCA 0.99 0.55 FL 4.59 0.36 HNSC 0.21 − 0.42 KIRC − 1.91 1.58 KIRP − 2.74 1.15 LIHC 3.32 − 0.81 LUAD 3.41 − 0.13 LUSC 3.77 0.30 PAAD 0.74 − 0.35 PRAD − 0.61 0.83 READ 1.90 1.94 SKCM 1.54 0.97 THCA − 0.93 − 0.75 UCEC 4.44 − 1.26
(http://egg2.wustl.edu/roadmap/data/byFileType/chromhmmSegmentations/ChmmModels/coreMarks/ jointModel/final/, all “15_coreMarks_mnemonics.bed.gz” files).
Normal and cancer RNAseq data were retrieved from TCGA. The RNAseq data comprised a total of 559 normal and 7,667 cancer data sets. BL, FL and GC-B data was published in ref. 16. The 450 k methylation data are taken from ICGC release 161, TCGA, ENCODE57 and GEO58. The BL, FL, GC-B and BLUEPRINT data were
published in ref. 16. This resulted in a total of 7,870 450 k cancer and 1,691 450 k normal cell data sets. Both, 450 k and RNAseq data for normal and cancerous tissue were available for 18 ICGC and one TCGA data set. A detailed list of accession numbers and IDs can be found in Supplementary Table S3.
Chromatin state segmentations. Bivalent segments were retrieved from 122 normal cell chromatin state segmen-tations from Roadmap. bedtools59 was used to merge their bivalent enhancer and bivalent promoter intervals,
counting the number of distinct cell (or tissue) types that had contributed to each segment (using the count_dis-tinct option of bedtools merge).
For the additional cancer cell line data, we used ChIP-Seq data (H3K27me3, H3K36me3, H3K4me1, H3K4me3 and H3K9me3) generated in the framework of the BLUEPRINT consortium16 that is publicly available
for seven different blood cancer cell lines (BL2, DG-75, JVM2, Karpas-422, SU-DHL5, U-266, Z-138). To gen-erate chromatin state segmentations for these seven BLUEPRINT cell lines that are comparable to the Roadmap segmentation, we downloaded Roadmap’s 15 state HMM model and used ChromHMM60 with this model to
generate chromatin state segmentations out of the ChIP-Seq data files. Again, bedtools was used to gain merged bivalent chromatin state segmentations from bivalent enhancer and bivalent promoter segments.
Frequently bivalent segments and associated genes.
Frequently bivalent segments (FBSs) were required to be supported by a bivalent segment from more than 80%, i.e. at least 98, of the 122 Roadmap normal cell chromatin state segmentations. For comparisons, we defined a similar set of bivalent intervals soley based on ESCs to investigate whether FBS better capture bivalent segments in differentiated tissue or cells. To obtain this control set, we used all segments that were bivalent in at least 7 out of the 8 ESC chromatin state segmentations. A second control set to compare GO-term enrichments was obtained by merging intervals that are bivalent in at least three ESC, but in less than 12 normal cell chromatin state segmentations.For the active promoter set, we first merged the active promoter segments from all 122 normal chromatin state segmentations using bedtools. Afterwards, all segments overlapping with FBSs were discarded.
For comparison of length distributions, we also generated data sets derived from merged active promoter and promoter flanking regions (“TssA”, “TssAflnk”) as well as from genic and normal enhancers (“Enh”, “EnhG”) in the same way used for bivalent chromatin segments. We defined genes that are associated to a chromatin segment as all genes where either the gene body or the promoter region overlapped the respective chromatin state segment. To get these genes, we used bedtools to intersect the respective segments with the Gencode v19 gene annotation. A region of 1,500 nt upstream was added to each gene annotation to capture the promoter regions.
For enrichment analysis of genes in GO-terms, KEGG pathways, and other descriptors we used GOrilla61,
DAVID62 and string-DB63. In case of enrichment analysis with DAVID, we reported the Benjamini-Hochberg
corrected p-values. Where not stated otherwise, all Gencode v19 genes were used as a background.
Stability of bivalent segments in cancer.
To assess the fate of bivalent segments in cancer, we first grouped related types of the 15 chromatin state segments together to create chromatin categories: “Bivalent” (Bivalent promoter, bivalent enhancer, flanking bivalent), “Promoter” (Active promoter, Flanking active pro-moter), “Transcribed” (Flanking transcribed, weakly transcribed, transcribed), “Enhancer” (Both types of Enhancer segmentation), “Polycomb repressed” (Polycomb repressed, weakly polycomb repressed), “ZNF”, “Quiescent” and “Heterochromatin”. We computed the stability of these chromatin categories in 11 cancer cell lines with respect to normal cells of origin, and compared them to nine pairs of related normal cells.To assess the stability of each chromatin category, we used bedtools to intersect the chromatin state segmenta-tions for every pair and determined the fraction of nucleotides that did not change categories relative to the nor-mal segmentation. The pairs for cancer data sets and cells of origin were: Liver - HepG2; NHLF - A549; “Primary B from cord blood” - K562; “Primary T CD8+ naive cells from peripheral blood” - Dnd41 and “Primary B from peripheral blood” - BL2, DG75, JVM, KARPAS-422, SU-DHL, U266 and Z-138, respectively. For normal controls we used “Brain Cingulate Gyrus” - “Brain hippocampus Middle”; “Duodendum Mucosa” - “Colonic Mucosa”; “Fetal intestine large” - “Fetal intestine small”; “Fetal Muscle leg” - “Fetal Muscle Trunk”; HUES48 - HUES64; iPS20b - iPS18; “Primary T CD8+ naive” - “Primary T CD8+ memory”; “Primary hematopoietic stem cells G-CSF mobilized, Male” - “Primary hematopoietic stem cells G-CSF mobilized, Female”; “H9 Derived Neuronal Progenitor” - “H9 Derived Neuron cultured cells”; “hESC derived CD184+ Endoderm Cultured Cells” - “hESC derived CD56+ Ectoderm Cultured Cells”; “Foreskin Melanocyte Primary Cells skin 01”-“Foreskin Fibroblast Primary Cells skin01”.
For analysis of fresh cancer tissue, we downloaded ChIP-Seq peak files from BLUEPRINT (Blood), gastric tissue26 and breast cancer27 experiments.
For Blueprint data, we downloaded 5 ChIP-Seq broadpeak files (H3K4me3, H3K4me1, H3K9me3, H3K27me3 and H3K36me3) for four fresh cancers – two Acute Myeloid Leukaemia (AML) and two Multiple Myelome (MML) – as well as for naive B cells as controls. The peak files were segmented using the Roadmap 15 states model and lifted from hg38 to hg19 using the liftover tool of the UCSC genome browser. Stability was computed as described above.
Fresh tissue breast cancer ChIP-Seqs for H3K27me3 and H3K4me3 were downloaded from GEO (GEO:GSE40867). The peak files for the 9 patient samples were intersected with each other using bedtools to find bivalent domains. These bivalent domains and the peak files were intersected with the Roadmap segmentation
for Breast-Myoepithelial cells, and stability was computed as before, with H3K4me3 used as “Promoter”, biva-lent as “Bivabiva-lent” and H3K27me3 as “Polycomb repressed”. Gastric cancer data was downloaded from GEO (GEO:GSE51776) and fresh cancer was compared to the corresponding normal controls. Here, H3K4me1 was used as enhancer, H3K4me3 as promoter, H3K27 as repressed and the intersection of H3K4me1 or H3K4me3 with K27 methylation as bivalent enhancer and promoter, respectively. Stability was computed as described above.
Methylation values from 450 K arrays and WGBS data sets.
We first computed mean CpG-wise methylation rates for each tumor and its respective normal control by averaging over all 450 k-Array β-values of the respective group. Subsequently, we computed CpG-wise methylation differences by subtracting the mean methylation level of the control from the mean methylation level of the tumor. The resulting DNA methylation differences were intersected with the respective chromatin state segmentations using bigWigAverageOverBed of the UCSC tools64, and averaged within the segments. Segments that contained less than 3 covered CpGs (i.e.CpGs with methylation data) were discarded. Mean DNA methylation differences per chromatin state segment WGBS were calculated using bedtools merge. These mean methylation differences were analyzed using R.
We used the methylation differences described in Kretzmer et al.16 for BL, FL and GC-B data sets and
inter-sected the DNA methylation differences with the chromatin state segmentation of “Primary B cells from periph-eral blood”. The ALL data were taken from the GEO data set (GEO:GSE56601). We averaged the “ETV6-ALL difference from preB” and the “HD-ALL difference from preB” from this data set to calculate the DNA methyla-tion differences. The averaged distances where then intersected with the “Primary B cells from cord blood” chro-matin state segmentation using bigWigAverageOverBed, discarding segments with less than three covered CpGs. We used wiggletools65 to average the DNA methylation rates of the Medulloblastoma data set (ICGC:PBCA-DE)
for the four distinct cancer groups Group3, Group4, SHH and WNT, and the control set. We also used wiggletools to compute the mean DNA methylation differences, which we intersected with the “Brain Substantia Nigra” chro-matin state segmentation using bigWigAverageOverBed, again discarding segments with less than three covered CpGs.
For the analysis of the DNA methylation differences along the FBSs, we partitioned the FBSs segments by size, resulting in a group of FBSs below 10 k nt length and one above 10 k length. For comparison, we used bivalent regions of cell of origin chromatin state segmentations, split into those that did overlap an FBS and those that did not. Each single segment was extended by 100% of its length to the left and right and split into 300 sub-segments, each spanning 1% of the segment’s length. The mean DNA methylation difference for every sub-segment was computed using bigWigAverageOverBed. We averaged the mean DNA methylation for every sub-segment, discarding sub-segments without DNA methylation data. The data was plotted using R’s smooth function with standard parameters.
DNA methylation changes of bivalent segments in cancer data.
To investigate methylation changes in cancer, the Roadmap chromatin state segmentations of cancer cell lines, cancer fresh tissues and related nor-mal tissues (A549:IMR90, K562:Primary B from cord blood, HepG2:Liver, BL:Primary B from periph blood, FL:Primary B from periph blood) were intersected. The segments were classified as “stable” when both, nor-mal and cancer cell line, showed bivalent chromatin (bivalent enhancer, bivalent promoter or flanking bivalent), “lost” where only the chromatin state segmentation of the normal cell was bivalent, and “new” where only cancer showed bivalent chromatin. For DNA methylation analyses, WGBS (IMR90 and liver) and reduced representa-tion bisulfite sequencing (RRBS) data (A549, K562, Primary B from cord blood and HepG2) from Roadmap were downloaded. For comparability, WGBS data sets were restricted to those CpGs that were present in the RRBS data sets. DNA methylation changes were computed using CpGs that had valid entries in both data sets, normal and cancer. The DNA methylation differences were analyzed using bigWigAverageOverBed and R.DNA methylation classifier.
For the methylation based classifier we used those FBSs that had contribu-tions from least 120 Roadmap single chromatin state segmentation data sets, i.e. 14 FBSs in total. Those FBSs cover 1,163 CpGs on 450 k arrays. Bivalent enhancer and bivalent promoter classifiers were constructed anal-ogously by first merging only the bivalent enhancer or promoter segments, respectively, and then choosing the segments with most contributors. The classifier based only on bivalent promoters had nine segments supported by more than 97 chromatin state segmentations, corresponding to 322 CpGs on the 450 k array. The classifier based on bivalent enhancers consisted of 12 segments (more than 115 chromatin state segmentations) and corre-sponded to 706 CpGs on the 450 k array.DNA methylation rates were computed using UCSC tools for ICGC data, converted to bigwig files and then analyzed using bigWigAverageOverBed and in-house perl tools for GEO and ENCODE array data. Classifier segments that covered less than three CpGs were discarded. We used the average of the group mean β -values of the segments to compute overall mean segment DNA methylation rates. Data sets with DNA methylation infor-mation for less than 3 segments were discarded. About 6,090 cancer and 1,300 control data sets met these criteria. For a classification of samples into cancer and healthy tissue, the relative CpG methylation in bivalent segments with respect to the mean methylation over all CpGs covered in the respective array, i.e. a methylation fold-change in bivalent segments, was used.
For comparison, the analysis was repeated using a data set comprising segments that are bivalent in all ESC and iPSC, but in less than three other more differentiated cells. This data set comprised 47 segments, but only six segments (= 66 CpGs) were represented by more than two CpGs on the 450 k arrays. Therefore, we dropped this criteria and used all 92 CpGs present in any of the 47 segments for classification. In addition, the analysis was repeated on a data set for merged polycomb repressed (ReprPC) segments from which we subtracted all overlaps with a FBS using bedtools (212 CpGs).
“Receiver operator characteristics” (ROC) curves were plotted using R, “area under these curves” (AUCs) were computed using R’s AUC package66. Finally, we generated all 16,396 possible subsets of the 14 original classifier
FBSs and compared their classification performance to the original classifier. A classifier based on only three FBSs performed best, reaching an AUC of slightly above 0.935.
Tumor cell content. We used infiniumpurify67 to predict tumor cell contents from the 450 k arrays. We only
pre-dicted tumor cell content for tumors where the descriptors were already provided by the infiniumpurify package. This analysis included the following cancer data sets: BLCA, BRCA, CESC, COAD, HNSC, KIRC, KIRP, LIHC, LUAD, LUSC, PAAD, SKCM, THCA and UCEC. We mapped tumor cell content information on relative descrip-tor methylation information and used R’s lm function to fit a linear model to the data points of every tumor separately. For every tumor where a linear model could be fitted, we determined at which purity value the lower bound of a 90% confidence interval prediction intersected the 5% false negative threshold. This value is given in Supplementary Table S4. Plots were constructed using R’s ggplot2 package.
Tumor stages and grades. We downloaded clinical metadata from TCGA and extracted pathologic stage and histologic grade information. To obtain sufficient power, several sub-stages needed to be merged. E.g. Stage Ia, Stage Ib and Stage Ic were summarized with Stage I. We mapped this information to the tumor cell content and relative descriptor methylation information. Correlations were computed between the relative descriptor methyl-ation divided by tumor cell content and the tumor stages or grades using R’s cor.test function. For this, we mapped stages and grades to natural numbers: Stage I or G1 to 1, Stage II or G2 to 2, Stage III or G3 to 3 and Stage IV or G4 to 4. We discarded all other stages and grades. Plots were constructed using R’s ggplot2 package.
Expression values.
For RNA-Seq data from TCGA, we used raw gene read counts and edgeR68 with defaultparameters to compute fold changes and significance of expression differences (Supplementary Fig. S11). For array-based expression (GEO), we used logarithmic values, and all probes of a gene were averaged. The log expression values for each gene were averaged over the cancer and control groups, and the log2 fold change was computed.
Heatmaps of expression log fold changes generated from edgeR (Fig. 5) were generated using R’s heatmap.2 function with default parameters. Unsupervised clustering was performed by heatmap.2 using hclust in default settings.
QPCR analysis.
Ethics. Liver tissue samples were obtained from the Human Tissue and Cell Research (HTCR) Foundation69, which includes the informed patient's consent from all subjects. Experimental procedureswere performed in accordance with the European Union-compliant ethical and legal framework of the Human Tissue and Cell Research (HTCR) Foundation. This framework has also been approved by the ethics commission of the Faculty of Medicine in the University of Munich and the Bavarian State Medical Association.
RNA isolation and qPCR transcript quantification. RNA from twenty paired samples of primary hepatocellular carcinoma (HCC) and corresponding noncancerous liver tissues (HTCR foundation, ref. 69) was isolated using the RNeasy Mini Kit (Qiagen) according to the manufacturer’s instructions. 2 μg RNA was reverse transcribed according to published protocols70. Quantitative RT-PCR of distal-less homeobox 5 (DLX5), lymphoid enhancer
binding factor 1 (LEF1), paired box 2 (PAX2), sp8 transcription factor (SP8) and zic family member 2 (ZIC2) was performed in quadruplicates using primers and probes from the human Universal ProbeLibrary (UPL. Roche) with AmpliTaq Gold (Thermo Fisher) (Supplementary Table S8). Gene expression changes were calculated using the Δ Ct method as described previously71.
DNA methylation vs. expression analysis of ICGC/TCGA data.
To integrate changes in DNA meth-ylation and changes in gene expression, the average DNA methmeth-ylation differences for the FBS genes were plotted against the edgeR-derived log2 fold change expression of the associated genes. We used the active promoter set as described above and its associated genes as a background (Transcription start site active, TssA), as well as a data set that contained genes that overlapped with genomic regions that contained bivalent chromatin from at most 10 chromatin state segmentations, of which at least 3 were from embryonic stem cells. Subsets of genes signifi-cantly differentially expressed were computed by edgeR. Lowly expressed genes were defined as having a negative logCPM for the normal cells, computed by edgeR. In addition, the change in DNA methylation vs. change in expression was plotted for each cancer separately (Supplementary Fig. S7), again using bivalent ESC and active promoter genes as backgrounds.Cell lines.
For lymphoma cell line analysis (Fig. 6A), we plotted expression vs. DNA methylation changes for BL, FL and GC-B data from ref. 16 in contrast to lymphoma cell lines (GEO access IDS in Supplementary Table S3). The mean values of BL-2 and DG75 cell lines were compared to BL, values of the diffuse large B-cell lymphoma cell line KARPAS-422 (cell line with typical BCL2 t(14;18) (q32;q21) translocation) was compared to FL values, and the mean values of BL-2, DG75 and KARPAS-422 were compared to GC-B. bigWigAverageOverBed was used to compute mean DNA methylation differences for the pairs stated above at merged bivalent chromatin state segments of “Primary B cells from peripheral blood”.To compare expression changes of FBS and non-FBS genes (Fig. 6B) during the first passages of glioblastoma cell line generation, array based expression data (GEO:GSE4536) was re-analyzed. Average expression values for fresh tumor tissue, commonly used cell lines (T98, U87, U118, U138, U251, U373, U387), and newly generated cell lines at every available passage in both growing conditions (NBE, serum) seperately were calculated.
Furthermore, the expression changes of FBS genes were compared to the changes of non FBS associated genes for two types of lung tumor cell lines (GSE25251) as well as for the cervix data set (GSE9750). Box-plots of the log2 fold changes for the genes were generated using R’s ggplot. P-values were computed using R’s wilcox.test function.
Statistical dependence and correlation.
By statistical dependence we refer to the situation where the differential expression of a gene (first variable X) is not statistically independent from differential DNA methylation of the bivalent segment (second variable Y). Specifically, this association is positive if P(X> x,Y> y) ≥ P(X> x) P(Y> y) is satisfied. Thus, the positive correlation of two random variables is formally a special case of the positive dependence. However, in everyday language, statistical dependence is often referred to as correlation.
References
1. International Cancer Genome Consortium. International network of cancer genome projects. Nature464, 993–998 (2010). 2. Cancer Genome Atlas Research Network. Comprehensive genomic characterization defines human glioblastoma genes and core
pathways. Nature455, 1061–1068 (2008).
3. Roadmap Epigenomics Consortium et al. Integrative analysis of 111 reference human epigenomes. Nature518, 317–330, doi: 10.1038/nature14248 (2015).
4. Mikkelsen, T. S. et al. Genome-wide maps of chromatin state in pluripotent and lineage-committed cells. Nature448, 553–560 (2007).
5. Voigt, P., Tee, W.-W. & Reinberg, D. A double take on bivalent promoters. Genes & development27, 1318–1338 (2013).
6. Margaritis, T. & Holstege, F. C. P. Poised RNA polymerase II gives pause for thought. Cell133, 581–584, doi: 10.1016/j. cell.2008.04.027 (2008).
7. Gaertner, B. et al. Poised RNA polymerase II changes over developmental time and prepares genes for future expression. Cell reports
2, 1670–1683 (2012).
8. Bernstein, B. E. et al. A bivalent chromatin structure marks key developmental genes in embryonic stem cells. Cell125, 315–326 (2006).
9. Lesch, B. J., Dokshin, G. A., Young, R. A., McCarrey, J. R. & Page, D. C. A set of genes critical to development is epigenetically poised in mouse germ cells from fetal stages through completion of meiosis. Proceedings of the National Academy of Sciences of the United States of America110, 16061–16066 (2013).
10. Meissner, A. et al. Genome-scale DNA methylation maps of pluripotent and differentiated cells. Nature454, 766–770 (2008). 11. Hinoue, T. et al. Genome-scale analysis of aberrant DNA methylation in colorectal cancer. Genome research22, 271–282 (2012). 12. Gal-Yam, E. N. et al. Frequent switching of polycomb repressive marks and DNA hypermethylation in the PC3 prostate cancer cell
line. Proceedings of the National Academy of Sciences of the United States of America105, 12979–12984 (2008).
13. Ohm, J. E. et al. A stem cell-like chromatin pattern may predispose tumor suppressor genes to DNA hypermethylation and heritable silencing. Nature genetics39, 237–242 (2007).
14. Rodriguez, J. et al. Bivalent domains enforce transcriptional memory of DNA methylated genes in cancer cells. Proceedings of the National Academy of Sciences of the United States of America105, 19809–19814 (2008).
15. Easwaran, H. et al. A DNA hypermethylation module for the stem/progenitor cell signature of cancer. Genome Res. 22, 837–849 (2012).
16. Kretzmer, H. et al. DNA methylome analysis in burkitt and follicular lymphomas identifies differentially methylated regions linked to somatic mutation and transcriptional control. Nature genetics47, 1316–1325 (2015).
17. Hahn, M. A. et al. Loss of the polycomb mark from bivalent promoters leads to activation of cancer-promoting genes in colorectal tumors. Cancer research74, 3617–3629, doi: 10.1158/0008-5472.CAN-13-3147 (2014).
18. Widschwendter, M. et al. Epigenetic stem cell signature in cancer. Nature genetics39, 157–158 (2007).
19. Nejman, D. et al. Molecular rules governing de novo methylation in cancer. Cancer research74, 1475–1483 (2014).
20. Hon, G. et al. ChromaSig: a probabilistic approach to finding common chromatin signatures in the human genome. Plos computational biology4 (2008).
21. Adams, D. et al. BLUEPRINT to decode the epigenetic signature written in blood. Nature biotechnology30, 224–226, doi: 10.1038/ nbt.2153 (2012).
22. Harrow, J. et al. Gencode: the reference human genome annotation for the encode project. Genome research22, 1760–1774 (2012). 23. Charlton, J. et al. Comparative methylome analysis identifies new tumour subtypes and biomarkers for transformation of
nephrogenic rests into wilms tumour. Genome medicine7, 11 (2015).
24. Teschendorff, A. E. et al. Correlation of smoking-associated DNA methylation changes in buccal cells with DNA methylation changes in epithelial cancer. JAMA oncology1, 476–485, doi: 10.1001/jamaoncol.2015.1053 (2015).
25. Bartlett, T. E. et al. Corruption of the intra-gene DNA methylation architecture is a hallmark of cancer. Plos one8, doi: 10.1371/ journal.pone.0068285 (2013).
26. Muratani, M. et al. Nanoscale chromatin profiling of gastric adenocarcinoma reveals cancer-associated cryptic promoters and somatically acquired regulatory elements. Nature communications5, doi: 10.1038/ncomms5361 (2014).
27. Nevedomskaya, E., Wessels, L. & Zwart, W. Genome-wide epigenetic profiling of breast cancer tumors treated with aromatase inhibitors. Genomics data2, 195–198 (2014).
28. Lee, S.-T. et al. Epigenetic remodeling in B-cell acute lymphoblastic leukemia occurs in two tracks and employs embryonic stem cell-like signatures. Nucleic acids research43, 2590–2602 (2015).
29. Hovestadt, V. et al. Decoding the regulatory landscape of medulloblastoma using DNA methylation sequencing. Nature510,
537–541, doi: 10.1038/nature13268 (2014).
30. Shah, N. & Sukumar, S. The hox genes and their roles in oncogenesis. Nature reviews. Cancer10, 361–371, doi: 10.1038/nrc2826 (2010).
31. Miao, J. et al. HOXB13 promotes ovarian cancer progression. Proceedings of the National Academy of Sciences of the United States of America104, 17093–17098 (2007).
32. Wang, Z. et al. The prognostic biomarkers HOXB13, IL17BR, and CHDH are regulated by estrogen in breast cancer. Clinical cancer research: an official journal of the American Association for Cancer Research13, 6327–6334, doi: 10.1158/1078-0432.CCR-07-0310 (2007).
33. Jerevall, P.-L. et al. Exploring the two-gene ratio in breast cancer–independent roles for HOXB13 and IL17BR in prediction of clinical outcome. Breast cancer research and treatment107, 225–234, doi: 10.1007/s10549-007-9541-8 (2008).
34. Yu, K. et al. OTX1 promotes colorectal cancer progression through epithelial-mesenchymal transition. Biochemical and biophysical research communications444, 1–5 (2014).
35. Song, I.-S. et al. Human ZNF312b promotes the progression of gastric cancer by transcriptional activation of the k-ras gene. Cancer research69, 3131–3139 (2009).