Durham E-Theses
Structural Dissonance in Galaxy Decomposition: The
red sequence and evolutionary pathways in the Coma
Cluster
HEAD, JACOB,THOMAS,CHRISTOPHER
How to cite:
HEAD, JACOB,THOMAS,CHRISTOPHER (2014) Structural Dissonance in Galaxy Decomposition: The red sequence and evolutionary pathways in the Coma Cluster, Durham theses, Durham University. Available at Durham E-Theses Online: http://etheses.dur.ac.uk/10867/
Use policy
The full-text may be used and/or reproduced, and given to third parties in any format or medium, without prior permission or charge, for personal research or study, educational, or not-for-prot purposes provided that:
• a full bibliographic reference is made to the original source
• alinkis made to the metadata record in Durham E-Theses
• the full-text is not changed in any way
The full-text must not be sold in any format or medium without the formal permission of the copyright holders. Please consult thefull Durham E-Theses policyfor further details.
Academic Support Oce, Durham University, University Oce, Old Elvet, Durham DH1 3HP e-mail: [email protected] Tel: +44 0191 334 6107
http://etheses.dur.ac.uk
Structural Dissonance in Galaxy Decomposition:
The red sequence and evolutionary pathways in the
Coma Cluster
Jacob Thomas Christopher George Head
A thesis submitted to Durham University in accordance with the regulations for admittance to the Degree of
Doctor of Philosophy
Department of Physics
Durham University
United Kingdom
2014
Abstract
The structural and photometric properties of ‘red-and-dead’ early-type galaxies provide vi-tal clues about the evolutionary pathway which lead to their formation. Here, I use deep Canada-France-Hawaii Telescope image data to explore the multi-component internal struc-tures of red sequence galaxies in the Coma cluster, with a particular focus on disk-dominated early-type galaxies (i.e. S0s). Galaxies are investigated across a wide range of luminosities
(−17> Mg>−22) and cluster-centric radii (0< rcluster<1.3 r200). I present the 2D struc-tural decomposition ofu, g, iimaging viaGALFIT. Rigorous filtering is applied to ensure that the measured best-fit models are the most meaningful descriptions of their galaxy’s underly-ing stellar structures.
A sample of Coma cluster members (N = 200) was identified as well described by an ‘archetypal’S0 structure (central bulge + outer disk). Internal bulge and/or disk colour
gradients were implemented by allowing component sizes to vary between bands. Such gradients are required for30%of archetypalS0galaxies. Bulges are characterised byn ∼2 profiles with half-light radii,Re∼1kpc, remaining consistent in size for all but the brightest
galaxies (Mg < −20.5). S0disks are brighter (at fixed size, or smaller at fixed luminosity)
than those of star-forming spirals. Similar colour-magnitude relations are found for both bulges and disks. The global red sequence forS0s in Coma hence results from a combination
of both component trends. The average bulge−disk colour difference is0.09±0.01mag in g −i, and 0.16± 0.01 mag in u−g. Using simple stellar population models, bulges are either ∼ 2-3× older, or ∼ 2× more metal-rich than disks. The trend towards bluer globalS0colours observed further from Coma’s core is driven by a significant correlation of
disk colour with cluster-centric radius. An equivalent trend is detected in bulge colours at a marginal significance level. An environment-mediated mechanism of disk fading is favoured as the dominant factor inS0formation.
The decomposition analysis was then extended to encompass a wider range of structural models. This revealed a large sample of reliably-fit, symmetric multi-component galaxies in Coma (N = 478). 42±3%of Coma cluster galaxies (N = 201) are best described by a 3(+) component structure. In addition, 11% of galaxies (N = 52) feature a break in their outer profiles, indicating truncated or anti-truncated disks. Beyond the break radius, truncated disks are consistent in structure with untruncated disks, disfavouring a formation mecha-nism via physical truncation of exponential disks. The sizes/luminosities of bulges in anti-truncated galaxies correlate strongly with galaxy luminosity, indicating a bulge-enhancement formation mechanism for anti-truncated disks. Both types of broken disk are found over-whelmingly (>70%) in barred galaxies, suggesting that galaxy bar play an important role in formation of such structures. The wide variety of galaxy structures detected in Coma high-lights the na¨ıvet´e of the simple ‘bulge + disk’ or ‘single spheroid’ morphological paradigm for early-type galaxies.
Contents
Abstract i
List of Figures vii
List of Tables xiii
Acknowledgements xv
Declaration xvi
1 Introduction 1
1.1 Early-Type Galaxies and the Red Sequence . . . 1
1.2 Mechanisms for Quenching . . . 6
1.2.1 Disk Fading . . . 9
Ram Pressure/Viscous Stripping . . . 10
Strangulation . . . 11 1.2.2 Bulge Enhancement . . . 13 Mergers . . . 14 Harassment . . . 16 AGN Feedback . . . 17 1.2.3 Secular Processes . . . 18 1.2.4 Pre-Processing . . . 20
1.3 Stellar Populations and Scaling Relations . . . 22
1.4 The S´ersic Profile . . . 23
2 Data and Initial Sample 31
2.1 Introduction . . . 31
2.2 Observations and Initial Reduction Pipeline . . . 31
2.3 Coma Sample Selection . . . 34
2.4 Input Analysis Data . . . 37
2.4.1 Data images . . . 37
2.4.2 Noise maps . . . 37
2.4.3 PSF characterisation . . . 40
2.4.4 Photometric zero point corrections . . . 40
2.4.5 Conversion to rest-frame photometry . . . 40
2.5 Chapter Summary . . . 43
3 Bulge-disk Decomposition Techniques 45 3.1 Introduction . . . 45
3.2 Decomposition Routine -
AGONII
. . . 453.3 Fit parameter uncertainty . . . 49
3.4 Bayesian Model Selection . . . 51
3.5 Sample Filtering . . . 55
3.5.1 Badly-fit galaxies . . . 55
3.5.2 Single component galaxies . . . 56
3.5.3 Surface brightness profiles . . . 56
3.5.4 Blue core galaxies . . . 58
3.5.5 Flagged sample . . . 58
3.5.6 Overview of sample filtering . . . 60
3.6 Filtering Results . . . 60
3.6.1 Morphological fractions . . . 65
3.6.2 Summary of filtering samples . . . 66
3.7 Multi-band Fitting . . . 67
3.7.1 Fixed Multi-band Fitting . . . 67
3.7.2 Component Gradients . . . 68
4 Comparison with Studies of Independent Imaging Data 73
4.1 Introduction . . . 73
4.2 SDSS . . . 74
4.2.1 SDSS
AGONII
. . . 754.2.2 Comparison with Simard et al. (2011; S11) . . . 82
4.2.3 Comparison with Meert et al. (2014) . . . 88
4.3 Hubble Space Telescope . . . 91
4.4 Chapter Summary . . . 94
5 The Structural Properties of ComaS0s 97 5.1 Introduction . . . 97
5.2 Structural Fitting Results . . . 98
5.2.1 Parameter Distributions . . . 98
5.2.2 Trends with galaxy luminosity/mass . . . 101
5.2.3 Structural trends with environment . . . 106
5.2.4 Fingerprints of quenching in the structural parameters ofS0s . . . . 109
5.3 Summary . . . 112
6 Photometric Component Properties 114 6.1 Introduction . . . 114
6.2 Colour-magnitude trends . . . 115
6.2.1 Fixed multi-band fitting . . . 115
6.2.2 Models with Internal Gradients . . . 118
6.2.3 Stellar population properties . . . 123
6.3 Variation with Environment . . . 126
6.3.1 Cluster colour-radial results . . . 126
6.3.2 Environmental Quenching . . . 131
6.4 Variation with Morphology . . . 133
6.4.1 Dressler (1980a) Morphologies . . . 134
6.4.2 Galaxy Zoo Morphology . . . 136
6.6 Conclusions and Chapter Summary . . . 141
7 Multi-component Fitting, and Deviations from the Exponential Disk Profile 143 7.1 Introduction . . . 143
7.2 Methodology . . . 144
7.2.1 1D Break Parameterisation . . . 144
7.2.2 2D Broken Disk Model . . . 145
7.2.3 Processing Differences from
AGONII
. . . 147Extended Profile Typing . . . 148
Filtering . . . 151
7.3 Overview of Results . . . 154
7.3.1 Best-fit Models . . . 154
7.3.2 Filtering Results . . . 164
7.3.3 Freeman Disk Type Fractions . . . 167
7.4 Conclusions and Chapter Summary . . . 168
8 The Structural Properties of Multi-component Galaxies 171 8.1 Introduction . . . 171
8.2 Multi-S´ersic Systems . . . 173
8.3 Barred/Unbarred Broken Disk Systems . . . 175
8.4 Freeman Type I, II, and III disks . . . 179
8.4.1 Central component properties . . . 181
8.4.2 Disk Properties . . . 183
8.4.3 Component fractions (C/T) . . . 188
8.5 Disk break formation scenarios . . . 192
8.6 Conclusions and Chapter Summary . . . 194
9 Summary and Conclusions 197 9.1 Chapter Summaries . . . 198
9.2 Future Directions and Concluding Remarks . . . 203
List of Figures
1.1 The Hubble sequence of galaxy morphologies, illustrating the structures of early-type galaxies and barred/unbarred spirals. . . 2 1.2 Cartoon of the global colour-magnitude diagram for galaxies highlighting
the blue cloud, red sequence, and green valley. . . 3 1.3 Cartoon of the ATLAS3Dcomb illustrating the evolution of morphology from
spiral toS0via an anemic spiral stage. . . 5
1.4 The morphology fractions of elliptical, lenticular, and spiral galaxies as a function of local environment density. . . 7 1.5 Plot of S´ersic profile intensity as a function of radius for models with
differ-ent S´ersic index. . . 24 1.6 Cartoon surface brightness plots for S´ersic + disk systems of each Allen type
(Allen et al., 2006). . . 26 1.7 Cartoon surface brightness plots for bulge + disk systems of each Erwin outer
disk type. . . 27 2.1 Plot of the RA and Dec of the CFHT Coma field of view, and the resulting
galaxy sample used for analysis. . . 33 2.2 Colour-magnitude diagram for the Coma cluster, using total galaxy
magni-tudes from SDSS (DR9). . . 35 2.3 Exampleu, g, iimage frames for galaxies with median, and first and third
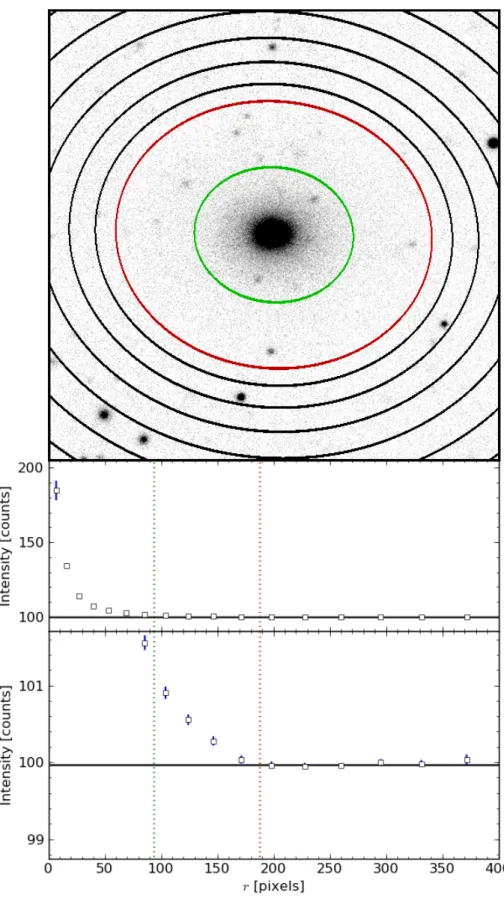
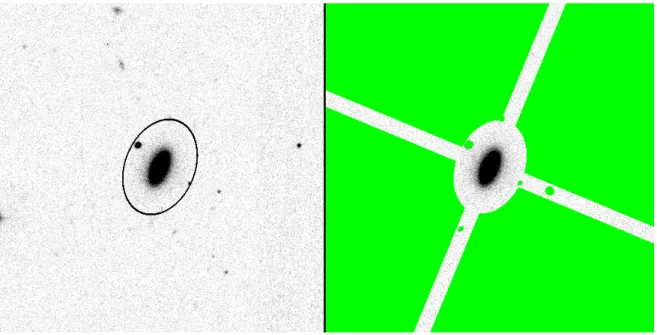
quartile S/N. . . 36 2.4 Example of sky determination. . . 38 2.5 Example of image masking for SDSS DR8 ObjID 1237665427553321062. 39
2.6 The point spread function FWHM as measured from stars in each MegaCam field plotted against field-centric radius. . . 41 2.7 The correction to the MegaCam photometric zeropoints plotted against
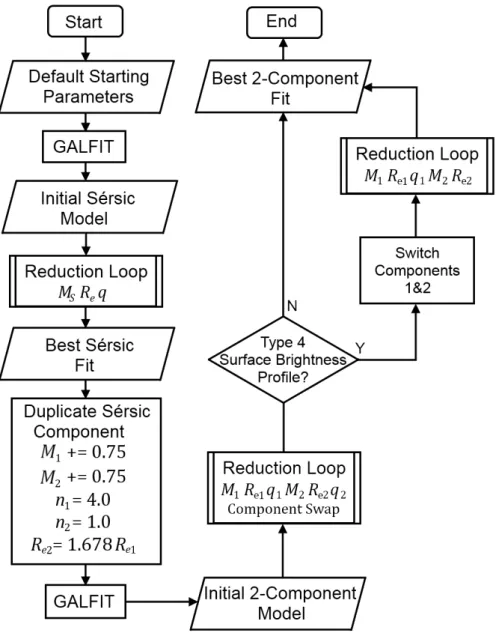
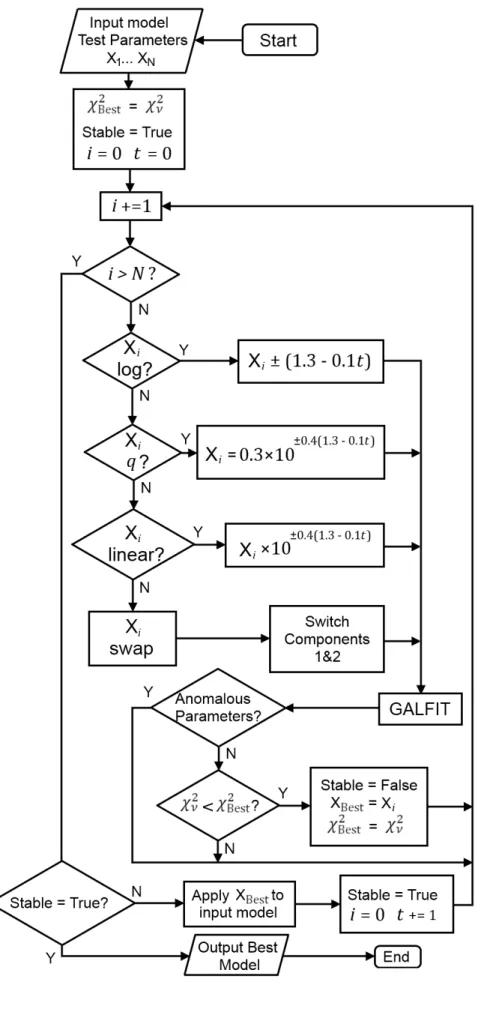
field-centric radius for galaxies within each MegaCam field. . . 42 3.1 Flow chart: Overall fitting process for 1- and 2-component model fitting. . . 46 3.2 Flow chart: Reduction loop for a specified series of model parameters to be
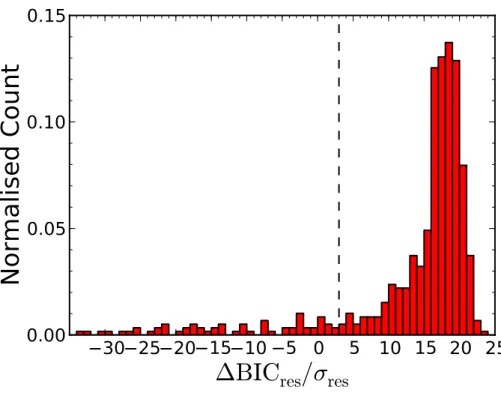
varied. . . 47 3.3 Distribution of∆BICres (for comparison between S´ersic-only and S´ersic +
disk models) normalised to the total Coma sample size. . . 51 3.4 1D surface brightness profiles and galaxy thumbnails for example galaxies
with differing BICres, BICpix, and visual classification results. . . 54 3.5 The measuredg −icolour separation of two component model fits plotted
against the axis ratio of the disk component. . . 57 3.6 Flow chart: Sample filtering following S´ersic + exponential fitting. . . 59 3.7 Venn diagram describing the main filtering samples and sub-samples for
galaxies best fit by S´ersic + disk or S´ersic-only models. . . 61 3.8 Example thumbnail images of galaxies illustrating the filter subsamples. . . 62 3.9 Example (gband) thumbnail and radial colour data for a ‘blue core’ galaxy. 63 3.10 The measured modelg−icolours plotted against their absolute totalgband
magnitudes. . . 64 3.11 Example thumbnail images for example galaxies illustrating the D80
mor-phological types. . . 66 3.12 Colour profiles for models of a typical galaxy with different internal colour
gradients as measured in elliptical annuli. . . 69 4.1 Plot comparing the total apparent magnitudes measured from MegaCam and
SDSS imaging of Coma cluster galaxies, and histograms of the resulting magnitude distributions. . . 76 4.2 Plot comparing the 2-component model bulge and disk magnitudes measured
from MegaCam and SDSS imaging of Coma cluster galaxies, and histograms of the resulting colour distributions. . . 77
4.3 Plot comparing Coma cluster galaxy bulge fractions (B/T) measured from MegaCam and SDSS imaging, and histograms of the resulting B/T distribu-tions. . . 78 4.4 Plots comparing Coma cluster galaxy and bulge S´ersic index (n) measured
from MegaCam and SDSS imaging, and histograms of the resultingn distri-butions. . . 79 4.5 Plots comparing Coma cluster galaxy, bulge, and disk effective half-light
radii (Re) measured from MegaCam and SDSS imaging, and histograms of
the resulting size distributions. . . 80 4.6 Plots comparing Coma cluster galaxy total, and component apparent
mag-nitudes as measured in the present work and from Simard et al. (2011), and histograms of the resulting magnitude distributions. . . 83 4.7 Plot comparing Coma cluster galaxy bulge fraction (B/T) as measured in the
present work and from Simard et al. (2011), and histograms of the resulting B/T distributions. . . 84 4.8 Plots comparing Coma cluster galaxy and bulge S´ersic indices (n) as
mea-sured in the present work and from Simard et al. (2011), and histograms of the resultingndistributions. . . 85 4.9 Plots comparing Coma cluster galaxy, bulge, and disk effective half-light
radii (Re) as measured in the present work and from Simard et al. (2011),
and histograms of the resulting size distributions. . . 86 4.10 Plots comparing the Coma cluster galaxy r band magnitudes from Meert
et al. (2014) with magnitudes derived from the MegaCamgband magnitudes measured in the present work, and histograms of the resulting magnitude distributions. . . 89 4.11 Plot comparing Coma cluster galaxy bulge fraction (B/T) as measured from
Meert et al. (2014) and derived fromgband photometry in the present work, and histograms of the resulting B/T distributions. . . 90
4.12 Plot comparing the Coma cluster galaxyi band magnitudes as measured in the present work from MegaCam imaging and HST F814W magnitudes from Weinzirl et al. (2014), and histograms of the resulting magnitude distributions. 92 4.13 Plot comparing the Coma cluster galaxy S´ersic indices (n) as measured in the
present work and from Weinzirl et al. (2014), and histograms of the resulting magnitude distributions. . . 93 4.14 Plot comparing the Coma cluster galaxy effective half-light radii (Re) as
measured in the present work and from Weinzirl et al. (2014), and histograms of the resulting size distributions. . . 94 5.1 Structural parameter distribution histograms forgband galaxy models. . . . 99 5.2 Galaxy bulge fraction (B/T) fromg band galaxy models plotted against
ab-solute (bulge + disk) magnitudes. . . 102 5.3 Bulge S´ersic indicies (n) fromgband galaxy models plotted against absolute
(bulge + disk) magnitudes. . . 102 5.4 Bulge and disk effective half-light radii (Re) from g band galaxy models
plotted against absolute (bulge + disk) magnitudes. . . 103 5.5 The size-luminosity relation (Re,Dvs. absolute bulge + disk magnitude) for
the disks ofS0s and star forming spirals. . . 104
5.6 The size-luminosity relation (Re,Dvs. absolute disk magnitude) for the disks
ofS0s and star forming spirals. . . 105
5.7 Disk component axis ratio (qD) from g band galaxy models plotted against absolute (bulge + disk) magnitudes. . . 105 5.8 Bulge S´ersic indices (n) fromg band galaxy models plotted against galaxy
cluster-centric radius. . . 107 5.9 Disk component axis ratio (qD) from g band galaxy models plotted against
galaxy cluster-centric radius. . . 107 5.10 Bulge and disk effective half-light radii (Re) from g band galaxy models
plotted against galaxy cluster-centric radius. . . 108 5.11 Galaxy bulge fraction (B/T) fromgband galaxy models plotted against galaxy
6.1 Colour-magnitude diagrams for fixed multi-band structure. . . 116
6.2 Colour-component magnitude diagrams for fixed multi-band structure. . . . 117
6.3 Colour-colour diagrams of analysis sample bulges and disks. . . 119
6.4 Colour-magnitude diagrams for models with internal colour gradients. . . . 121
6.5 Colour-component magnitude diagrams for models with internal colour gra-dients. . . 122
6.6 Colour-magnitude and colour-separation diagrams for galaxies in inner and outer cluster samples. . . 127
6.7 Colour-radius diagrams and residuals displaying the bulge and disk g − i colours plotted against the projected separation between the galaxy and the Coma cluster centre. . . 128
6.8 Colour-radius diagrams and residuals displaying the bulge and disku −g colours plotted against the projected separation between the galaxy and the Coma cluster centre. . . 129
6.9 Colour-cluster radius plots for bulge, total galaxy, and disk g −r colours from the present work, S11, and T14. . . 139
7.1 Cartoon of the broken disk profile, indicating surface brightnesses of the inner and outer disks. . . 146
7.2 Illustration of multi-component fitting model dependencies. . . 149
7.3 Cartoon of example 3-component surface brightness profiles types. . . 150
7.4 Flow chart: Multi-component fitting model selection and filtering. . . 152
7.5 Surface brightness profiles, residuals, and galaxy thumbnails for an example S galaxy. . . 155
7.6 Surface brightness profiles, residuals, and galaxy thumbnails for an example BD galaxy. . . 156
7.7 Surface brightness profiles, residuals, and galaxy thumbnails for an example BS galaxy. . . 157
7.8 Surface brightness profiles, residuals, and galaxy thumbnails for an example BDd galaxy. . . 158
7.9 Surface brightness profiles, residuals, and galaxy thumbnails for an example BDD galaxy. . . 159 7.10 Surface brightness profiles, residuals, and galaxy thumbnails for an example
BSD galaxy. . . 160 7.11 Surface brightness profiles, residuals, and galaxy thumbnails for an example
BSS galaxy. . . 161 7.12 Surface brightness profiles, residuals, and galaxy thumbnails for an example
BSDd galaxy. . . 162 7.13 Histogram of best-fit model type fractions for the initial and filtered samples. 163 7.14 Histogram of best-fit model type fractions for 2-component and multi-component
decomposition. . . 163 7.15 Histograms of outer disk type fractions for barred/unbarred galaxies, and
cluster inner/intermediate/outskirts galaxies. . . 167 8.1 Histograms of inner/outer S´ersic structure n in single, double, and triple
S´ersic galaxies. . . 173 8.2 Structural parameters for the bulges and bars of broken disk model galaxies
as a function of total model magnitude. . . 177 8.3 Structural parameters for the inner/outer disks of broken disk model galaxies
as a function of total model magnitude. . . 178 8.4 Bulge and bar S´ersic indices as a function of total model magnitude for
galaxies with Type I, II, and III disks. . . 180 8.5 Bulge and bar effective half-light radii as a function of total model magnitude
for galaxies with Type I, II, and III disks. . . 182 8.6 Inner/outer disk effective half-light radii as a function of total model
magni-tude for Type I, II, and III disks. . . 184 8.7 Break radius for galaxies with Type II and III disks as a function of the total
model magnitude. . . 185 8.8 Bulge and disk fractions as a function of total model magnitude for galaxies
with Type I, II, and III disks. . . 187 8.9 ‘Additional’ component light fractions for average Type I, II, or III galaxies. 190
List of Tables
2.1 The maxima and minima in RA and Dec for the nine Coma CFHT fields in degrees. . . 32 3.1 The initial fitting parameters used for a one component (S´ersic) galaxy model. 48 3.2 The fitting constraints for a two component (S´ersic bulge + exponential disk)
galaxy model. . . 49 3.3 Definition of the equations determined for the random scatter and systematic
offsets in parameter values for pure S´ersic, S´ersic bulge, and exponential disk components. . . 50 3.4 The samples (and subsamples) of galaxies resulting from applying the logical
filter to the fitting results. . . 63 3.5 The number of unstable, 1-component, and 2-component galaxies (of each
Allen types) separated by Dressler (1980a) morphological classification. . . 65 6.1 Median galaxy magnitudes, bulge fractions, and colour values for bulges and
disks, and their corresponding colour-magnitude and colour-cluster radius trend slopes. . . 132 6.2 Median galaxy magnitudes, bulge fractions, and component colours, colour
separations, and colour trend slopes for D80 elliptical andS0galaxies. . . . 135
6.3 Median galaxy magnitudes, bulge fractions, and component colours, colour separations, and colour trend slopes for GZ spiral and elliptical galaxies. . . 136 7.1 The model component types used during multi-component decomposition
7.2 The multi-component models used during decomposition analysis, includ-ing the number of independent structural components, and number of free
parameters. . . 149
7.3 The distribution of model types resulting from multi-component fitting. . . 164
8.1 The median structural parameter values for multi-S´ersic model galaxies. . . 172
8.2 Table of best-fit trend slopes for component luminosity fraction varying with increased total luminosity. . . 188
8.3 Table of fractional component luminosity changes with increased total lumi-nosity. . . 188
A.1 Structuralgband S´ersic and S´ersic + exponential model fitting results. . . . 207
A.2 uandiband S´ersic + exponential model fitting results. . . 208
A.3 Column headings for Table A.1. . . 209
A.4 Column headings for Table A.2. . . 210
A.5 Filtering sample/subsample codes for Table A.1. . . 211
A.6 Structuraliband multi-component model fitting results. . . 212
A.7 Column headings of Table A.6. . . 213
Acknowledgements
I would like to thank John Lucey for his help and guidance over the years: You were never afraid to make me feel like an idiot, but were polite enough not to call me one. I owe my success to you. I am also very grateful to Russell Smith for his patient (unofficial) co-supervision, and Alan Lotts for keeping the IT network running smoothly. Apologies to Alan and the Pan-STARRS consortium for crashing panstarrs-a withAGONIIthat one time.
Big thanks to everyone in the physics department, particularly my R311 officemates (past and present), my graduating cohort, and Lynne, whose steady supply of tea has kept me functioning for the last four years. Thanks also to the unofficial astro-badminton group who have somehow managed to keep me fit (and somewhat competent at the sport).
I would also like to thank my family for setting me on this long and winding path, and the friends I’ve met along the way. Finally and most importantly, unending thanks to Em for her support, reassurance, and sympathetic ear. I honestly don’t think I could have made it this far without youý
Declaration
The work described in this thesis was undertaken between October 2010 and September 2014 while the author was a postgraduate student supervised by Dr. John Lucey at the Department of Physics, Durham University. This work has not been submitted for any other degree at this (or any other) university.
Chapters 2 - 6 of this thesis are based on work previously published as Head J. T. C. G., Lucey J. R., Hudson M. J., Smith R. J., 2014, MNRAS, 440, 1690.
This work is based on observations obtained with MegaPrime/MegaCam, a joint project of CFHT and CEA/DAPNIA, at the Canada-France-Hawaii Telescope (CFHT) which is operated by the National Research Council (NRC) of Canada, the Institute National des Sciences de l’Univers of the Centre National de la Recherche Scientifique of France, and the University of Hawaii. This work is based in part on data products produced at TER-APIX with the expert assistance of Partick Hudelot and Yannick Mellier. Observational data used in this paper are available from the CFHT archive http://www3.cadc-ccda.hia-iha.nrc-cnrc.gc.ca/cfht/cfht.html
This work uses data from SDSS-III. Funding for SDSS-III has been provided by the Alfred P. Sloan Foundation, the Participating Institutions, the National Science Founda-tion, and the U.S. Department of Energy Office of Science. The SDSS-III web site is http://www.sdss3.org/.
SDSS-III is managed by the Astrophysical Research Consortium for the Participating Institutions of the SDSS-III Collaboration including the University of Arizona, the Brazilian Participation Group, Brookhaven National Laboratory, Carnegie Mellon University, Univer-sity of Florida, the French Participation Group, the German Participation Group, Harvard University, the Instituto de Astrofisica de Canarias, the Michigan State/Notre Dame/JINA Participation Group, Johns Hopkins University, Lawrence Berkeley National Laboratory,
Max Planck Institute for Astrophysics, Max Planck Institute for Extraterrestrial Physics, New Mexico State University, New York University, Ohio State University, Pennsylvania State University, University of Portsmouth, Princeton University, the Spanish Participation Group, University of Tokyo, University of Utah, Vanderbilt University, University of Vir-ginia, University of Washington, and Yale University.
Statement of Copyright
The copyright of this thesis rests with the author. No quotation from it should be pub-lished without the author’s prior written consent and information derived from it should be acknowledged.
Chapter 1
Introduction
1.1
Early-Type Galaxies and the Red Sequence
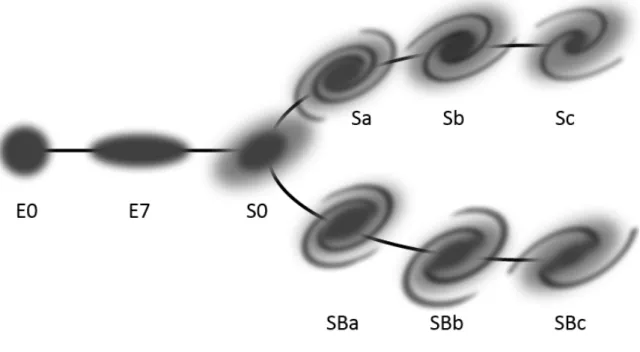
Galaxy morphologies are categorised as either ‘early’ or ‘late’ type based on their location on the Hubble sequence (Hubble, 1926; Figure 1.1). Early-type galaxies (ETGs) comprise elliptical and lenticular morphologies, while late type galaxies are primarily spirals. The gi-ant elliptical morphology is traditionally considered to encompass a single spheroid of stars following dynamically hot orbits (i.e. randomised, rather than coplanar). This observed structure can be spherical (‘E0’), but becomes increasingly flattened along the Hubble
se-quence (‘E1’-‘E7’, where the number corresponds to10(1−q)for the galaxy minor/major axis ratio,q). An equivalent spheroidal ‘bulge’ is present in spiral galaxies. Galaxies of this type also possess a flat, rotating disk, and the characteristic pattern of spiral arms for which the morphology is named. Along the Hubble sequence (‘Sa’-‘Sd’), galaxies become bluer
(Roberts & Haynes, 1994), their bulges decrease in luminosity (relative to the spiral/disk; Simien & de Vaucouleurs, 1986), and their spiral arms become less tightly-wound. Interme-diate to these two morphologies, lenticular (‘S0’) galaxies possess both a spheroidal bulge,
and a smooth disk devoid of any spiral features. S0bulges are larger (Dressler, 1980b), and
brighter (relative to their disks) thanSabulges (Simien & de Vaucouleurs, 1986). Both spiral
andS0 galaxies can also possess a stellar bar (designated as ‘SB0’ or ‘SBa’-‘SBc’), which
distinguishes the two parallel sequences of spiral morphologies.
Hubble’s ‘early’/‘late’ notation is frequently (mis)interpreted as the assumption of a particular sequence of galaxy evolution: elliptical galaxies grow stellar disks around their
Figure 1.1: The Hubble sequence of galaxy morphologies (also known as the ‘Hubble tuning fork’), illustrating the structures of early-type galaxies (En,S0) and barred/unbarred spirals. spheroids (formingS0s), which would then unwind into spiral arms and brighten over time
relative to the bulges. However, this nomenclature was intended to reflect the increase in observed morphological complexity across the Hubble sequence (similar to the ‘early’ and ‘late’ typing of stellar spectra), rather than to carry any serious temporal connotations (see footnotes in Hubble, 1926). Indeed, recent analyses of stellar populations reveal that late-type galaxies have significant ongoing star formation, and hence posses young stellar popu-lations. Conversely, ETGs are mostly old and quiescent (typical specific star formation rate
< 1/(3tH) M yr−1, where tH is the Hubble time; e.g. Damen et al., 2009). Thus, the
arrow of time points from right to left on the Hubble sequenceon average (Figure 1.1; i.e.
‘early-types’ evolve from ‘late-types’), rather than left to right.
The evolution of late-type galaxies to early-type morphologies is illustrated photomet-rically by the colour-magnitude diagram (Fig. 1.2). Late-type spirals occupy a broad (i.e. high scatter) parameter space with bluer average galaxy colours (the ‘blue cloud’). This in-dicates the presence of massive, but short-lived stars in the galaxy (i.e. a younger stellar population), and hence ongoing star formation. Conversely, ETGs are significantly redder on average, and follow a tight correlation of redder colours for more luminous galaxies (the
Figure 1.2: Cartoon of the global colour-magnitude diagram for galaxies highlighting the blue cloud, red sequence, and green valley. Arrows mark the expected pathway for galax-ies experiencing various evolutionary processes: Solid black arrows: Quenching of star-forming spirals. Dotted white arrow: Passive evolution via dry mergers. Dashed blue ar-row: Temporary renewed star formation of a red sequence galaxy. Characteristic locations of various morphologies - including spiral-lenticular transitions (‘S0/a’) and dwarf ellipticals (‘dE’) - are also indicated.
‘red sequence’; Bower et al., 1992). If star formation is curtailed in a late-type galaxy (here-after ‘quenching’), its stellar populations will redden and fade with time, as its massive (O, B, and A-type) stars leave the main sequence. This causes the galaxy to transition from the blue cloud to the red sequence over a period of∼1Gyr (i.e. an A-star’s main sequence life-time) or longer if quenching is gradual. The relatively low number of objects observed with colours intermediate to the blue cloud and red sequence (the ‘green valley’) thus correspond to quenched galaxies transitioning between the two populations. However, the bright end of the red sequence contains galaxies more luminous than the brightest blue cloud galaxies. Passive evolution (and hence fading) of blue cloud galaxies is therefore insufficient to pop-ulate the entire red sequence. Instead, quenched red sequence galaxies must gain mass (and hence luminosity) passively via merger events. However, since a ‘wet’ (i.e. gas-rich) merger would fuel further star formation (and thus move the galaxy back to the blue cloud), this passive evolution must involve ‘dry’ (i.e. gasless) mergers.
The apparent morphologies of observed galaxies do not necessarily reflect their true structures. Image resolution limits the detection of fine details such as bars, inner (sub-dominant) disks, or spiral features. Likewise, the magnitude limit and dynamic range of an observation inhibits the detection (or distinction between) low surface brightness features. Furthermore, the inclination of a galaxy on the sky can mask its true shape. For example, an elongated elliptical,En, can be detected as any morphology in the rangeE0toE7depending on its observed orientation. By-eye differentiation betweenE and S0morphologies is also
difficult in cases where such galaxies are viewed face-on due to the central concentration of light in elliptical galaxies (equivalent toS0bulges). Similarly, the distinction between S0s
and the most elongated (E5-E7) elliptical galaxies may be purely an observational bias (van
den Bergh, 2009b).
Simple one/two-component profiles do not reflect the true complexity of elliptical/S0
morphologies respectively. Multi-component (2+) structures for ETGs are consistent with the predictions of photometric modeling (e.g. disks in elliptical galaxies; Rix & White, 1990), and have been detected in nearby ellipticals (Huang et al., 2013). Recent work study-ing galaxy kinematics (e.g. Emsellem et al., 2011 for anS0-dominated ETG sample) has
mo-Figure 1.3: Cartoon of the ATLAS3D comb illustrating the evolution of morphology from spiral toS0(Sa-ctoS0a-c) via an anemic spiral stage (Aa-c).
mentum, any rotating, self-gravitating system will collapse to form a coplanar disk. Hence, weak disks (and other structures) may be present in most galaxies, but imaging signal-to-noise (S/N) limits their detection.
The proposed paradigm for galaxy evolution (van den Bergh, 1976; Cappellari et al., 2011; Kormendy & Bender, 2012) places elliptical and lenticular galaxies on a continuous sequence of rotating, quiescent galaxies (Fig. 1.3). Galaxy specific angular momentum,
λR, increases in magnitude from E (‘slow rotators’, λR < 0.31
√
for apparent ellipticity,
) to S0 (‘fast rotators’, λR > 0.31
√
). Here, the S0 morphology encompasses multiple distinct classes,S0a-S0c, differing in luminosity, relative bulge dominance, and evolutionary
pathway (van den Bergh, 1990, 2009a). TheseS0subtypes are analogous to theSa-Scspiral
morphologies, suggesting evolution fromSxtoS0xvia anemic (red) spiral intermediates (Aa
-Ac, van den Bergh, 1976; Masters et al., 2010), rather than gradual evolution through each
Hubble type. This direct quenching of the spiral subtypes is equivalent to the transition to the red sequence for blue cloud galaxies with different total luminosities. Equivalently, moving right to left along the comb ‘handle’ (S0c -E) is equivalent to the passive evolution which
In this thesis, I analyse the structures and structural component photometry of ETGs on the red sequence in order to investigate the physical mechanisms which mediated their quenching and evolution. Analysis was carried out on a sample of Coma cluster-members over a broad range of clustercentric radii (and hence local environment densities), enabling investigation of the importance of the cluster environment (relative to secular processes) in galaxy evolution.
In the following sections, I first provide details of the physical mechanisms which may drive the quenching and morphological evolution with emphasis on the processes which act in the cluster environment. Secondly, I discuss trends in structural and stellar population properties relevant to ETGs. Thirdly, the properties of ETG surface brightness profiles are introduced, including a thorough discussion of the analytical profiles used to model them in a decomposition analysis. Lastly, I provide an overview of the motivation and content of subsequent chapters within this thesis.
1.2
Mechanisms for Quenching
Structural and kinematic similarities betweenS0s and spiral galaxies (van den Bergh, 1976;
Arag´on-Salamanca et al., 2006; Bekki & Couch, 2011; Rawle et al., 2013) imply a evolution-ary scenario in which spiral-like progenitors are transformed into ETGs. Such a transforma-tion would require the erasure of any prominent spiral pattern, and truncatransforma-tion of the galaxy’s star formation. Without continued star formation, the galaxy would then fade and redden as its stellar populations age. Additionally, as S0s have brighter bulges (relative to their
disks) than spiral galaxies (Dressler, 1980b), transformation must also enhance the galaxy’s bulge-to-total ratio,
B/T = fB (fB+fD)
, (1.1)
wherefBandfDare the luminosities of the bulge and disk components respectively. The
re-sulting ‘red and dead’ descendant galaxy would be bulge-dominated, with a smooth, rotating disk.
Within galaxy clusters, strong radial trends are observed in galaxy morphology such that with increasing local density (or decreasing distance from the cluster core), the fraction of
Figure 1.4: Cartoon of the morphology fractions of elliptical, lenticular, and spiral galaxies as a function of local environment density (the ‘morphology-density’ relation). Based on Figure 4 of Dressler (1980b).
spiral galaxies decreases with a proportional increase in the fraction of ETGs (Fig. 1.4; the ‘morphology-density’ relation, Dressler, 1980b; Dressler et al., 1997). Likewise, with increasing local environment density, a galaxy’s star formation rate decreases (the ‘colour-density’ relation, Balogh et al., 2000; Lewis et al., 2002; Balogh et al., 2004; Hogg et al., 2004). This builds a picture in which a galaxy is driven from late- to early-type morphology during accretion onto a cluster due to environment-mediated processes. The current posi-tion of a galaxy within a cluster is correlated with its infall time (Gao et al., 2004; Smith et al., 2012; De Lucia et al., 2012; Taranu et al., 2014) and velocity (Oman et al., 2013). Therefore, variations of galaxy structure and colour with clustercentric radius offer insight into the physical mechanisms which acted during cluster infall, precipitating morphological evolution.
The environment-mediated mechanisms proposed to drive morphological transformation can be broadly categorised as either ‘bulge enhancing’ or ‘disk fading’ depending on how the increase in B/T is achieved. In both cases, the primary cause for quenching is the removal of a galaxy’s gas reserves which fuel its star formation (Larson et al., 1980).
In a ‘bulge enhancement’ scenario, the galaxy’s cold gas is rapidly consumed in strong bursts of centrally-concentrated star formation. Additionally, driving the gas towards the galaxy’s centre may feed a supermassive black hole, quenching star formation through ac-tive galactic nucleus (AGN) feedback (Silk & Rees, 1998; Schawinski et al., 2006, 2007; Brodwin et al., 2013). Mergers (in groups or the field) and galaxy harassment (in clusters, Moore et al., 1996) are the most widely studied mechanisms of this type, both of which show the potential to formS0s (Bekki, 1998; Governato et al., 2009; Moore et al., 1998, 1999).
Stellar disks of galaxies are typically disrupted by these processes, however, requiring spe-cific environmental conditions for disk survival (Hopkins et al., 2009) or a long period of disk regrowth (Kannappan et al., 2009).
A ‘disk fading’ scenario involves either the direct stripping of cold gas from the galaxy’s disk (e.g. due to ram pressure Gunn & Gott, 1972; Quilis et al., 2000), or removal of its hot halo gas reservoir over a long period of strangulation (Larson et al., 1980; Balogh et al., 2000). These mechanisms act preferentially on gas, causing little or no disruption to the galaxy’s stellar disk. Additionally, disk fading mechanisms are triggered by interactions
be-tween a galaxy and an external medium, such as a hot intra-cluster medium (ICM). This pre-cludes disk fading in low density environments, requiring that such a transformation would have had to occur since accretion into a group (or denser) environment.
Alternatively, secular processes driven by a galaxy’s internal astrophysics may also be an important factor in the transformation of spirals to ETGs. Mechanisms of this type modify the structure and star formation of a galaxy, without the need for external causes. Instead, the galaxy’s intrinsic dynamics mediate changes to stellar orbits or internal gas reservoirs. Galaxy bars, for instance can induce strong gravitational torques, potentially causing stel-lar migration into the bulge, or triggering central starbursts (Zhang, 1998, 1999; Coelho & Gadotti, 2011). Given the strong environmental dependences of morphology and star forma-tion, secular mechanisms are unlikely to be the primary cause for ETG formation. However, secular processes may influence the variety of galaxy morphologies and structures.
In the following subsections I present the theory describing the mechanisms which may precipitateS0 (trans)formation. A particular emphasis is placed on the importance of the
cluster environment, and the morphology-density relation in general.
1.2.1
Disk Fading
Disk fading transformation mechanisms operate via the direct removal of the galactic gas supply, thus robbing the galaxy of the fuel for star formation. Affected spirals will subse-quently fade as their stellar populations age, becoming increasingly red in colour as their short-lived, massive blue stars die off. As gas-stripping mechanisms act preferentially on the weakly-bound outer regions of galaxies, the disk is faded in preference to the bulge. This outside-in galaxy fading would yield a boosted B/T relative to its progenitor.
The morphology distributions for quiescent galaxies as a function of parent halo mass (analogous to environment density) supports environment-mediated disk fading (van der Wel et al., 2010). For galaxies with massesM < 1011 M
, the high halo mass environment
ex-hibits a significant excess of disk-like galaxies relative to the low halo mass environment (see Figure 4 in van der Wel et al., 2010). However, by adding an additional population of ‘quenched’L∗ spiral galaxies to a low halo mass quiescent sample, the distributions in both
truncation of star formation in a late-type galaxy without disrupting its disk-like ‘morphol-ogy’. However, an additional population of quenched spirals is insufficient to reconcile the high and low halo mass distributions for galaxies more massive thanM = 1011 M
. This
disparity supports bimodal evolutionary pathways for high and low mass galaxies.
The detection of a significant population of fieldS0s (Dressler, 1980b) disfavours a
sim-ple disk fading scenario for S0 formation. In the field environment, the gas temperature
and density would have been insufficient for ablative gas-stripping processes to have driven morphological transformations. Furthermore, the morphology-density relations observed in regular and irregular clusters were equivalent, despite gas-stripping only acting in virialised, regular clusters. Structurally, the bulges of S0 galaxies were found to be systematically
brighter than the bulges of spiral galaxies. Assuming that late morphologies are the progen-itors forS0s, a simple disk fading mechanism cannot account for this trend. However, this
structural trend could simply be a result of observational biases associated with classifying morphology by eye. Furthermore, local ETGs could not have evolved fromlocallate-type
galaxies; rather, both local populations evolved from a primordial spiral-like progenitor pop-ulation. Thus, this structural disparity between local spirals and ETGs does not necessarily impede a disk-fading evolutionary pathway.
In the following sections, I describe two main themes of disk fading: ram pressure strip-ping due to a hot external medium, and ‘strangulation’ of a galaxy’s hot gas reservoir.
Ram Pressure/Viscous Stripping
As a spiral galaxy falls into a cluster with a hot, ionised ICM, the motion of the galaxy’s interstellar medium (ISM) past the ICM causes a build up of ram pressure (Pr) ahead of the
galaxy. This is described by the equation
Pr ≈ρev2, (1.2)
where ρe is the density external to the galaxy, and v is the galaxy’s propagation velocity
through the ICM.
For the typical ICM density of a cluster (∼103atoms m−3), ram pressure will strip all of the cold gas from a Milky Way-like galaxy within∼100Myr (Gunn & Gott, 1972; Quilis
et al., 2000). This abrupt removal of gas would lead to a rapid truncation of the star formation within the galaxy similar to the predictions for S0s based on spectroscopic observations.
The increase in pressure that the ISM would experience during stripping could also lead to a starburst in the central regions of the galaxy. Quilis et al. (2000) propose that this temporarily boosted star formation rate would explain the presence of enhanced hydrogen absorption lines inS0spectra.
There has been substantial observational evidence for ongoing, or past Ram Pressure Stripping (RPS) events in clusters and groups (e.g. Irwin et al., 1987; Vollmer et al., 2004; van der Wel et al., 2010; in Coma: Smith et al., 2010), nevertheless, the extent to which ram pressure/viscous stripping influencesS0evolution is disputed. Simulations performed
by Abadi et al. (1999) suggested that RPS would only result in a loss of∼80%of gas mass. This would represent a significant truncation, but not total removal of the disk gas. Addition-ally, Abadi et al. found that a galaxy with orbital inclination relative to their motion through a cluster would lose substantially less gas (∼50%) than those interacting with the ICM face-on. However, this result has been disputed by Quilis et al. (2000), whose simulations indi-cated total gas removal in even moderately inclined (i = 20◦
) galaxies. Additionally, they argue that a galaxy’s motion within a cluster is such that it will be appropriately inclined for stripping at some point during its orbit.
More recently, Tecce et al. (2010) have examined RPS using a hybrid of Smoothed Par-ticle Hydrodynamics (SPH) and semi-analytical methods to calculate the ram pressure ex-perienced by galactic gas. They find that ram pressure depends on both cluster virial mass and redshift, increasing by an order of magnitude betweenz = 1and 0. Including redshift-dependent RPS, the simulated fraction of gas-depleted galaxies within a cluster’s virial radius (r200) increases by∼60%relative to simulations excluding a treatment of RPS (see Fig 8 in Tecce et al., 2010). Even at the cluster outskirts (∼2r200), there remains a significant in-crease in the gas-depleted galaxy fraction with decreasing redshift, implying a significant amount of pre-processing (see Section 1.2.4) via RPS in subgroups accreted by the cluster.
Clearly, ram pressure would have a significant effect on any gas-rich spiral galaxy enter-ing a cluster’s virial radius. Until typical conditions, this can drive the abrupt star formation truncation necessary to form anS0. Nevertheless, the existence of a significant population
of field S0s (Dressler, 1980b) challenges the dominance of RPS as the major mechanism
of S0 formation. It is possible that RPS only influences galaxies that remain unquenched
prior to entering the cluster’s virial radius. Furthermore, partial, or ongoing transforma-tions could be supplemented by RPS upon entering the virial radius. This would cause a density-dependent acceleration of star formation truncation which may explain the observed morphology-density relation.
Strangulation
In a simple, closed-box model of gas evolution, a steady rate of star formation would be sufficient to consume all of the available cold gas within a few Gyr (Larson et al., 1980). Therefore, spiral galaxies require a means of replenishing their gas content from their sur-roundings (i.e. via accretion of gas-rich satellites in their halo or cooling of hot halo gas). Strangulation (Balogh et al., 2000) is a mechanism for spiral transformation based on the sweeping of gas content from a galaxy’s halo, thus starving it of the fuel for future gas ac-cretion and star formation. Although this removal of halo gas may proceed via the same physical mechanisms discussed earlier in this section, strangulation would result in a dis-tinctly different star formation history. Specifically, removal of the halo gas reservoir would cause a gradual reduction of the star formation rate, rather than a rapid truncation.
Kawata & Mulchaey (2008) demonstrated that the ram pressure in a low-mass group environment could strip hot halo gas, but would be insufficient to permanently disturb the cold galactic gas (see Figure 4 in Kawata & Mulchaey, 2008). Hence, strangulation of star formation alone should be sufficient to explain the star formation history and morpholog-ical transformation of spirals into S0s. Additionally, as strangulation can proceed even in
relatively low-mass groups, it counters the assertion of Dressler (1980b) that gas-stripping mechanisms could not drive spiral transformations due to the presence of fieldS0s.
Feldmann et al. (2010) followed the evolution of a simulated group, noting that galax-ies identified as present-dayS0s entered the group environment earlier than the spirals that
maintained star formation up to z = 0. Hence, they conclude that the group environment drives the morphological transformation intoS0s for infalling gas-rich spirals. This
halo gas driving the quenching of star formation. Nevertheless, additional RPS accelerates the removal of cold gas relative to a pure strangulation scenario (∼90±10%of galactic cold gas within∼1Gyr).
For satellite galaxies accreted into approximately equal-mass halos, quenching must be driven by processes which change colour, but not concentration (i.e. strangulation or RPS; van den Bosch et al., 2008). However, differences in colour and concentration were found to be independent of host halo mass, implying that environment-dependent mechanisms such as RPS are disfavoured. It is also noted that for galaxies with stellar mass, M? ∼109h−2
M, roughly30%of red sequence satellite galaxies were red prior to accretion into a larger
mass halo. The proportion increases to∼100%for galaxies of stellar massM? ≥ 1011h−2
M. This mass-dependence for transformation time appears to suggest a dichotomy of
trans-formation mechanisms for high and low mass galaxies. Potentially, this correlates with the observed trend that the most massive galaxies are more likely to have undergone a major merger (Robaina et al., 2010).
Weinmann et al. (2006) found that semi-analytical models implementing strangulation do not correctly reproduce the observed fraction of blue galaxies. Specifically, models produce too few blue satellite galaxies, even without a treatment of RPS further truncating their star formation. Hester (2010), however, suggests that this discrepancy can be solved by gas inflow in a galaxy’s neutral hydrogen (HI) disk, following a partial quenching event. This inflow of gas would feed star formation, prolonging the galaxy’s star forming lifetime and thus producing a higher fraction of blue galaxies at late times on average.
Overall, strangulation presents a robust picture of star formation truncation for disk galaxies entering a higher density environment. In combination with RPS, strangulation is consistent with most observed trends in colour and morphology, and appears to be the dominant mechanism for transformation of disk galaxies up to aroundM? = 109h−2 M.
Strangulation doesn’t, however, explain the evolution of those galaxies that had their star formation truncated prior to entering the group environment, nor does it account for the increased B/T ratio ofS0s relative to unquenched spirals.
1.2.2
Bulge Enhancement
In a bulge-enhancement scenario, the larger B/T for ETGs results from a build-up of mass (and hence luminosity) in galaxy bulges. Galaxy quenching in this scenario involves the rapid consumption of star-forming gas in a burst of accelerated star formation, rather than via physical expulsion of gas. These starbursts occur as a result of increased central gas density induced when disk gas loses angular momentum during a dynamic interaction, and falls towards the bulge (Barnes & Hernquist, 1991; Mihos & Hernquist, 1994). In addition, the inflow of gas to the galaxy centre can feed the Supermassive Black Hole (SMBH) expected in most giant galaxies (Magorrian et al., 1998; Ferrarese & Merritt, 2000). The resulting increase in AGN activity can cause gas to be expelled from the galaxy, causing a truncation of ongoing star formation.
The proposed initiators of bulge enhancement (interactions between galaxies, or with a cluster’s tidal field) are both more likely to occur in high density environments, hence pro-viding a potential link with the morphology-density relation. As disks are typically disrupted or destroyed by these interactions, the progenitors of a bulge-enhancementS0formation
sce-nario must be disk-like in structure. Furthermore, the interacting system must be gas-rich to fuel a starburst. Thus,S0s must evolve from disk-dominated, late-type galaxies. However,
the ages of stars inS0bulges and inner thick disks typically exceed 10 Gyr (Stewart et al.,
2008; Rawle et al., 2010). These old central stellar populations contradict arecentstarburst
formation mechanism.
A bulge enhancement scenario is supported by Christlein & Zabludoff (2004), who exam-ined trends in B/T forS0galaxies, parametrised by the Schechter parameter,M∗(Schechter,
1976), of the bulge and disk luminosity functions. A weakly negative gradient inM∗ with
increasing B/T was evident for disk components, while the equivalent gradient for bulge components was strongly negative. Using Monte Carlo analysis, Christlein & Zabludoff found that only a bulge enhancement scenario explains the observed gradients, and only for a subset of the total range of B/T values (see Figure 5 in Christlein & Zabludoff, 2004).
It is worth highlighting that the Monte Carlo models of Christlein & Zabludoff (2004) are based on the assumption that early-type galaxies share a common progenitor population with late-types. Relaxation of this assumption might improve the extent to which a disk
fading null hypothesis could account for the observed trends inM∗ for a limited B/T range. Nevertheless, their conclusions support the importance of bulge-enhancement mechanisms for the formation ofS0s.
In the following section, I address three main themes of bulge formation: galaxy mergers (in field/group environments), galaxy harassment (in clusters), and feedback from AGN.
Mergers
Galaxy mergers occur when gravitational interaction causes two (or more) galaxies to collide, and eventually coalesce. For a simple two-body merger, this process will take place over multiple orbits, during which the close proximity of the merging systems causes significant alteration to their internal orbital dynamics. Galaxy mergers are well-characterised by the mass ratio of their constituent interacting galaxies. Major mergers (mass ratios 1:1 to 4:1) represent a unification of (approximately) equal-mass galaxies, such as the eventual collision of the Milky Way with Andromeda. Conversely, minor mergers (mass ratios 5:1 to 10:1) correspond to the accretion of a satellite by the more massive primary galaxy.
Mergers result in increased B/T and bulgen (Aguerri et al., 2001), and grow the bulge
Re,B proportional to the mass growth,Mα (Naab et al., 2009; Hilz et al., 2012). For major
mergers, this results in an approximately linear growth in bulge size relative to mass growth (α= 0.8−1.0; Boylan-Kolchin et al., 2005; Hilz et al., 2012). In addition, disk structures are disrupted or destroyed by major mergers (Barnes & Hernquist, 1991; Bendo & Barnes, 2000; Bois et al., 2011), yielding a (kinematically) elliptical-like remnant (Toomre & Toomre, 1972). For minor mergers, the bulge size growth is predicted to be significantly larger (α = 2.0−2.4; van Dokkum et al., 2010; Hilz et al., 2012). However, not all simulations agree on this point; for example, Eliche-Moral et al. (2012) suggest that dry, minor mergers can provide the B/T growth necessary for S0formation while causing no significant change to
either bulge or disk scale lengths.
Minor mergers are less disk-disruptive; remnant disk structures are thickened (Quinn et al., 1993), but retain the kinematic and (radial) size properties of their progenitors (Bour-naud et al., 2005). Consequently, individual minor merger events may be insufficient to completely drive the evolution in morphology (Walker et al., 1996). Instead, multiple minor
mergers drive galaxy morphology from spiral toS0to spheroidal, and eventually to elliptical
(Bournaud et al., 2007). In this case,S0s represent true intermediates of late- and early-type
galaxies in a multi-step evolution scenario.
The gas content of the progenitor galaxies plays a large role in determining the star-formation properties of the resulting merger remnant. ‘Dry’ (dissipationless) mergers involve the interaction of gas-poor (e.g.E/S0) systems, producing a massive remnant with little or no
additional star formation. While this may explain the formation of some of the most massive ETGs (Tran et al., 2005), it does not address the issue of the origin of these quenched early-type progenitors. By contrast, ‘wet’ mergers of gas-rich galaxies, or ‘mixed’ mergers of a gas-rich object with a gas-poor system are expected to drive strong (central) starbursts in the remnant galaxy. This epoch of heightened star formation follows the inward radial migration of disk gas (due to tidally-induced asymmetries) and/or the accretion of a gas rich satellite. It has been demonstrated that the majority (∼75%) of a progenitor’s disk gas can be consumed during merger-induced starbursts, resulting in a remnant with distinct spheroid, thick disk, and thin bar structures (i.e. aSB0galaxy; Bekki, 1998).
In order to satisfy the conditions ofS0formation, a merger must be sufficiently gas-rich
to drive the bulge growth of the remnant while being of a low enough mass ratio that the disk structure of the remnant is preserved. However,N-body simulations suggest that∼95%of galaxies experience a major merger betweenz = 2and 0 (Stewart et al., 2008). Hence, the observed fraction of local disk-dominated ETGs cannot be reproduced unless mergers with mass ratios up to 5:1 do not always destroy disks. For instance, the most efficient mode of angular momentum loss for gas is due to merger-induced asymmetries in the galaxy’s internal stellar disk (Hopkins et al., 2009). Hence, galaxies with a high disk gas fraction (low mass stellar disk) or high stellar winds (driving gas to large radii) will lose very little angular momentum and thus potentially survive the merger (see Figure 1 in Hopkins et al., 2009).
SPH simulations have demonstrated the regrowth of a thin disk following a wet merger event atz = 0.8(Governato et al., 2009; e.g. their Figure 1). Disk regrowth has been iden-tified observationally within blue ETGs in modest to low density environments (Kannappan et al., 2009). The dynamics of these galaxies indicate a past (unequal-mass) merger event,
with regrowth assembling a stellar disk over the early-type remnant. This regrowth process would require abundant cold gas (either within the merger progenitors or acquired via cold flow accretion) and efficient star formation (i.e. lower mass). However, renewed star forma-tion on a scale sufficient to reform a dominant disk would move the remnant galaxy back to the blue cloud. Thus, in order to form red, quiescentS0s in this manner, it is necessary to
invoke additional gas-stripping effects (Roediger et al., 2010).
Overall, gas-rich mergers seem a likely candidate for driving the formation ofS0s from
late-type progenitors through central starburst events. Although major mergers tend to form elliptical-like remnants, the expected merger rate betweenz = 2 and the present day does not necessarily pose a problem, as disk-regrowth or survival could preserveS0morphology.
However, neither gas-poor mergers nor disk regrowth can explain the final quenching of star formation, and supplementary gas-stripping mechanisms may thus be required.
Harassment
Within virialised clusters, the relative velocities of any two galaxies is usually too large for a direct merger to occur. Even if the galaxies collided head-on, the entire interaction would be too brief for the gas to react dynamically. Due to the relatively high galaxy density within the cluster environment, however, each cluster galaxy is likely to experience many brief tidal interactions over its lifetime. The cumulative effect of these repeated encounters with other galaxies and the host cluster’s tidal field is termed ‘galaxy harassment’.
Acting on typical spiral galaxies, harassment causes heating of the stellar disk and loss of gas angular momentum to its dark matter halo (Moore et al., 1996). Similar to the effect induced by direct mergers, this will prompt funneling of gas towards the galaxy centre, where it could fuel a central starburst. Additionally, as the disk of the infalling galaxy is disturbed by the cluster’s tidal field, large ‘tails’ of stellar and gaseous matter (as observed by Haynes et al., 2007) would form. Loss of stellar matter in this manner can remove as much as 50% of a galaxy’s stars, which would account for the diffuse intracluster light (ICL) observed in clusters (Moore et al., 1998).
Harassment has a far lesser effect on a more densely concentrated system, such as a galactic core or giant elliptical galaxies. Hence, the overall influence of harassment differs
depending on the surface brightness of the target galaxy (Moore et al., 1999). Low surface brightness (LSB) galaxies - as characterised by large disk scale lengths and slowly rising rotation curves - can lose up to90%of their stellar mass to repeated tidal shocks, resulting in a dwarf elliptical remnant. High surface brightness (HSB) galaxies, however, can react adiabatically to tidal shocks. Thus, HSB galaxies will experience disk heating and thick-ening, but will otherwise remain stable to harassment (see Figure 5 in Moore et al., 1999). Dwarf galaxies are similarly stable to harassment due to their high mass concentration (Smith et al., 2010), losing only∼10%of their stellar mass in most cases. These harassed dwarfs remained disk dominated, with some gaining tidally-induced spirals.
Harassment would not be sufficient to drive thecompletemorphological transformation
of HSB galaxies. However, this process is sufficient to erase the spiral features of an in-falling galaxy within a few Gyr. Therefore, these harassed remnants are idealS0precursor
candidates, requiring an additional gas-stripping event to complete their transformation to early-type morphologies.
Harassment is a more relevant morphological transformation mechanism in the cluster environment than direct mergers. Acting on a mid-to-high surface brightness galaxy, it can cause transformation to anS0-like morphology within a few Gyr. The highest surface
bright-ness galaxies are more stable, however, requiring gas-stripping to supplement harassment.
AGN Feedback
The velocity dispersion of a galaxy’s bulge (and therefore its mass) correlates strongly with the mass of the SMBH it hosts, MBH (the ‘Magorrian relation’; Magorrian et al., 1998; Ferrarese & Merritt, 2000). Thus, the properties of the stellar bulge and SMBH are directly inter-related. As these objects differ in mass and physical size by factors of∼103 and∼108 respectively, this causal link cannot result from gravitational effects. Instead, the kinetic or radiative activity of the galactic nucleus on accretion of mass must influence the galaxy’s stellar properties.
AGN eject collimated jets of ionised matter perpendicular to the plane of their accretion disk due to interaction between black hole rotation and the magnetic field of the disk itself (Rees et al., 1982; Begelman et al., 1984; Semenov et al., 2004). These jets (supplemented
by radiation pressure from the AGN, and existing wind from supernovae) impart significant kinetic energy to the host galaxy’s ISM. If the accretion rate is sufficiently high (i.e. ‘quasar mode’), these AGN winds can cause kpc-scale outflows of gas (Springel et al., 2005; King, 2005; Di Matteo et al., 2005; Harrison et al., 2012), suppressing star formation via removal of the galaxy’s cold gas supply. While such outflows would not exist for lower accretion rates (‘Radio mode’), the transfer of kinetic energy would nevertheless cause mechanical heating of the galaxy’s cold gas reserves. This mechanism can also cause galaxy quenching by preventing gas from cooling and collapsing to form stars (Best et al., 2005, 2006; Danielson et al., 2012). Additional gas heating can result from the emission of ionising radiation or the production of energetic particles (cosmic rays etc.) by the AGN (Ferland et al., 2008, 2009). AGN activity and star formation appears to be correlated on average (e.g. Chen et al., 2013). This reflects that both processes are triggered by the same conditions (i.e. increased gas density). However, a causal connection between AGN feedback and galaxy quenching is disputed observationally: red (i.e. quenched) galaxies are not more likely to host AGN (Aird et al., 2012), while AGN-hosting galaxies do not exhibit significant deviation from expected star formation rates (Harrison et al., 2012). Further studies suggest that AGN regulate star formation via both negative (i.e. star formation suppressing) and positive (i.e. star formation triggering) feedback (Zinn et al., 2013; Karouzos et al., 2014). In this scenario, the dominant feedback mechanism in a particular galaxy depends on the properties of the AGN it hosts. However, the resulting star formation suppression would not necessarily be sufficient to fully quench a galaxy.
Feedback from AGN is of particular relevance for bulge-enhancing evolutionary mecha-nisms due to the potential for tidal interactions to feed gas to the central black hole. However, the morphological signatures of major merger events have been detected in only a minority of AGN-host galaxies (Liu et al., 2011; Kocevski et al., 2012). Such observational evidence is limited by imaging depth, with deeper data yielding significantly higher fractions of post-merger AGN (Schawinski et al., 2010; Imanishi & Saito, 2014). Furthermore, AGN fed by tidal harassment in clusters would be unlikely to host detectable morphological features (see earlier in this section).
1.2.3
Secular Processes
Galaxy evolution via secular (i.e. internal) processes provides a means of forming ETGs in environments in which most quenching mechanisms do not occur. However, the existence of strong environmental trends in colour and morphology suggest that this is not the primary evolutionary pathway. Secular mechanisms can nevertheless supplement the environment-mediated evolutionary mechanisms discussed above. In this way, the apparent discrepancies between bulge-enhancing or disk-fading processes and the observed properties of ETGs may be reconciled by invoking additional secular effects (e.g. increasing bulge size in disk-faded galaxies, or providing additional star formation truncation in post-merger starburst galaxies). Most secular processes relevant to disk-dominated late-type galaxies involve the inter-action of disk stars or gas with structural density perturbations. Galaxy bars are ellip-soidal/rectangular structures consisting of stars on elongated orbits due to orbital resonances and/or disk instabilities (see review in Sellwood & Wilkinson, 1993). As the bar pattern ro-tates, disk gas is accelerated, forming shocks. Outside the radius of corotation (where stars are at rest on average with respect to the bar), angular momentum is transferred from the bar to disk gas, potentially forming an outer stellar ring. Inside corotation, the gaslosesangular
momentum and falls towards the galaxy centre. The increased central gas density thus leads to the formation of an inner ring and/or stellar bulge1(Kormendy & Kennicutt, 2004). Cen-tral gas concentration can similarly be induced by the galaxy’s spiral pattern. However, the effect is weaker in this case due to non-incident interaction of spiral-induced shocks with the gas.
As with the bulge-enhancement mechanisms discussed in Section 1.2.2, AGN activ-ity can be fed by secularly-driven gas inflow (Knapen et al., 2000; Orban de Xivry et al., 2011). A secular AGN mode explains observations of AGN hosts without indications of previous merger events. AGN feedback can therefore provide a quenching mechanism in-dependent of local environmental conditions. This self-quenching could also supplement environment-mediated quenching to produce the observed quenching timescales (e.g. accel-erating a gradual quenching via strangulation), or age gradients (e.g. centralised quenching for disk-quenching mechanisms).
1Bulges formed via secular processes are termed ‘pseudobulges’, distinct from the ‘classical bulges’ formed
Secular interactions with galaxy structures can also directly influence disk stars. Scatter-ing due to spiral patterns can cause thickenScatter-ing/heatScatter-ing of the stellar disk (Sellwood, 2014), and explain the observation that older stars (as detected in the Solar neighbourhood) have greater velocity dispersions (Wielen, 1977). More generally, radial redistribution of disk stars due to secular processes leads to a build up of bulge stellar mass (Zhang, 1998, 1999) and production of thickened outer disks (Roˇskar et al., 2013). As these processes can lead to a change in bulge fraction without additional star formation, they are of particular rele-vance for the morphological evolution of galaxies post-quenching. Furthermore, migration of stars from their radius of formation can lead to compositional mixing (e.g. as stars formed in metal-rich regions move to metal poor regions). This may explain the radial gradients in stellar metallicity detected in ETGs (Di Matteo et al., 2013, see Section 1.3).
Galaxy bars are apparent in only ∼30% of galaxies in optical surveys of the local Universe (Masters et al., 2011), but have been detected in∼70% of Coma S0s (Lansbury et al., 2014). Orientation/inclination effects (Erwin & Debattista, 2013) and dust obscuration (Marinova & Jogee, 2007) significantly limit the detected bar fraction. Furthermore, bars are intrinsically unstable to the central mass build-up they induce (see Kormendy & Kennicutt, 2004), decaying to lens-like remnants (Kormendy, 1979). Therefore, many galaxies are ex-pected to have hosted a bar at some point sincez ∼1, even where these structures are not detected in the present day. Thus, bar-driven secular evolution is a relevant consideration for a large proportion of galaxies.
1.2.4
Pre-Processing
Within a hierarchical model of galaxy evolution, most galaxies assemble in groups prior to entering a cluster at low/intermediate redshift. ‘Pre-processing’ refers to a scenario in which galaxies within groups are subjected to local environmental effects prior to enter-ing the clusters they inhabit at z = 0. Pre-processed galaxies are subjected to incremental shift to earlier-type morphologies, and/or have their star formation rate partially truncated. Hence, these galaxies are more susceptible to environment-driven quenching when their par-ent groups par-enter a cluster potpar-ential.