THE IMPACT OF LABOR MARKET DYNAMICS ON THE RETURN
MIGRATION OF IMMIGRANTS
Govert E. Bijwaard, Christian Schluter, and Jackline Wahba*
Abstract—Using administrative panel data on the entire population of new labor immigrants to the Netherlands, we estimate the effects of individual labor market spells on immigration durations using the timing-of-events method. The model allows for correlated unobserved heterogeneity across migration, unemployment, and employment processes. We find that unem-ployment spells increase return probabilities for all immigrant groups, while reemployment spells typically delay returns.
I. Introduction
T
HE labor market performance of immigrants in the hostcountry has received ample attention in the empirical literature. Neglected, however, is the question as to what extent this labor market performance affects the decisions of migrants to return to their source country. In particular, what is the effect of adverse or positive labor market events such as the occurrence of unemployment spells and reem-ployment spells? How does the effect vary by the duration of the labor market spell? The failure of the empirical liter-ature to ask these questions, let alone to furnish convincing answers, arises from a combination of methodological chal-lenges and severe limitations of the data usually encountered in migration analysis.
We address these novel questions using a unique admin-istrative panel for the entire population of recent immi-grants to the Netherlands covering the years 1999 to 2007. These data characteristics—large size, repeated and accu-rate measurement—are fairly unique in migration analysis (exceptions are Nekby, 2006, for Sweden and Aydemir and Robinson, 2008, for Canada) and enable us to examine dura-tions reliably. The usual data situation is one of small samples, possibly subject to selectivity and attrition issues, extracted from surveys of respondents who provide recall data. These problems are particularly acute in studies of migration dura-tions since survey attrition usually confounds out-migration. By contrast, our administrative population data have no attrition. We expand on three important features of our data. First, this Dutch immigrant register is based on the legal requirement for immigrants to register with the authorities Received for publication August 16, 2011. Revision accepted for publi-cation February 12, 2013.
* Bijwaard: Netherlands Interdisciplinary Demographic Institute; Sch-luter: Aix-Marseille Université (Aix Marseille School of Economics), CNRS and EHESS, and University of Southampton; Wahba: University of Southampton.
Financial support from the NORFACE research programme on Migration in Europe–Social, Economic, Cultural and Policy Dynamics is gratefully acknowledged. We thank Statistics Netherlands, Ruben van Gaalen in par-ticular, for data support, and participants of the Norface Migration Network Conference, especially Christian Dustmann, for helpful comments. Finally, we thank our editor, Gordon Hanson, as well as our referees, whose thought-ful, detailed, and constructive criticism has helped to improve the paper considerably.
A supplemental appendix is available online at http://www.mitpress journals.org/doi/suppl/10.1162/REST_a_00389.
upon arrival.1 Several other official registers are linked by
Statistics Netherlands to this immigrant register, such as social benefits and the income register (used by the tax authorities). Sojourn times in labor market states are thus accurately recorded. Consequently, no data based on individ-ual recall have to be used. Moreover, the usindivid-ual concerns about measurement error are less acute.
A second important feature of our data is the adminis-trative report in the immigrant register (consistent with the visa status at entry) of the reason for immigration. This enables us to focus explicitly and exclusively on 94,270 labor immigrants. The reason for the immigration is usually latent in standard data sets, and different behavioral patterns of labor and nonlabor migrants would confound the empiri-cal analysis. Indeed, the other immigrant groups, such as family migrants, differ systematically from labor migrants in terms of labor market attachment, return behavior, and demographic characteristics.
Size is the third attractive feature of our data to be high-lighted here, as it allows us to stratify our analysis rather than be constrained to estimate one common model on pooled data. Such pooling is problematic since immigration laws stipulate visa requirements that differ by country of origin, and visa status in turn affects migration and labor market behaviors. We consider immigrants from sending countries in the EU15 (“old Europe”) and the new EU (the majority of whom arrived after the EU enlargement in 2004); the coun-tries outside Europe are grouped into developed (DCs) and less developed (LDCs) sending countries.
While modern duration analysis (see van den Berg, 2001, for a survey) is widely applied in labor economics, the limi-tations of survey data have prevented its widescale adoption in migration studies. The richness of our data enables us to go beyond standard modeling of migration durations and to tackle the complex task of examining jointly the migration and labor market processes using a mixed proportional haz-ards framework. In particular, we estimate the effects of the labor market dynamics on the return decision of immigrants using the “timing-of-events” method (Abbring & van den Berg, 2003). At the same time, we control for the correlated effects that arise from the correlation between unobservables in the migration and labor market process (ignoring these, we show, would result in substantial endogeneity biases). Our model for the migration duration permits the sojourn times in the various labor market states to have effects that depend on both duration and the timing of the labor market spells.
1They are also required to deregister when leaving. Noncompliers are removed from the register by administrators. We know that these individuals have out-migrated, but the exact date of their departure is unknown. We take this administrative removal into account in our modeling.
The Review of Economics and Statistics,July 2014, 96(3): 483–494
©2014 by the President and Fellows of Harvard College and the Massachusetts Institute of Technology doi:10.1162/REST_a_00389
These concerns distinguish this paper from the recent empirical literature on return migration. For instance, out-migration propensities of both immigrants and natives have been considered in Nekby (2006) for Sweden. Using admin-istrative data, she estimates linear probability models and focuses on the role of characteristics, finding evidence of positive selection in terms of education. Rather than using a static framework, Aydemir and Robinson (2008) estimate standard proportional hazard models on administrative data for Canada, reporting evidence of positive selection in terms of skill levels. Instead of focusing exclusively on characteris-tics, Kirdar (2009) also considers the effect of unemployment spells on the return decision using survey data for Ger-many. Estimating logistic hazard specifications, he finds that the effect of unemployment spells on out-migration haz-ards depends on unemployment durations. Bijwaard (2010) estimates mover-stayer proportional hazards models using administrative data for different migration motives for the Netherlands, reporting high return rates for labor migrants. However, he does not consider labor market dynamics, as we do here. These approaches to migration duration estimation differ from ours. Unlike these three studies, we also control for unobserved heterogeneity (see van den Berg, 2001, for a discussion of the importance of this). A complementary, mainly theoretical literature focuses on the reason for return migration. However, by not considering the effects of labor market shocks, the concerns of this literature are different from ours.2
We find that, unconditionally, both unemployment and return migration are substantial: between 35% and 50% of labor immigrants experience unemployment, and 48% leave the host country during the observation window of 1999 to 2007. Turning to the effects of the labor market experiences, we found that unemployment periods increase return probabilities for all immigrant groups, while reem-ployment typically delays returns. All effects are substantial and significant.
The impact estimates are valid under the assumption that unemployment affects the migration hazard only after its start, not before. We discuss several threats to identifica-tion posed by the potential anticipaidentifica-tion of the unemployment event by out-migration (noting that anticipators, by terminat-ing their employment, forgo income and the option value of on-the-job search). Further threats in the Dutch case arise at precise migration durations that trigger statutory changes in employment and residence rights of the individual. The scope for systematic anticipation is, however, limited by the flexibil-ity of the Dutch labor market, the little power that unions have, and the short statutory notice period. Finally, we verify the robustness of our results to several of our population selection 2The two principal opposing paradigms are theories of optimal migration durations based on preference for source country consumption (Galor & Stark, 1991; Dustmann & Weiss, 2007) or target savings (Dustmann, 2003), and theories of mistaken expectations and immediate failure on the labor market (Borjas & Bratsberg, 1996). Empirical tests are conducted in Yang (2006) and Gibson and McKenzie (2011).
choices in several data- and simulation-based sensitivity checks.
The outline of the paper is as follows. The data are described in section II. The econometric model is set out in detail in section III. We specify the labor market and the migration processes and elucidate the role of unobserv-able heterogeneity. The identification argument is discussed in section IIIC. Estimation proceeds by maximizing the likelihood, presented in section IIIE. The empirical results follow in section IV, and in section IVE, we present several robustness checks. Section V concludes.
II. Administrative Panel Data on the Population of Recent Immigrants to the Netherlands All legal immigration by non-Dutch citizens to the Nether-lands is registered in the Central Register Foreigners (Cen-traal Register Vreemdelingen, CRV), using information from the Immigration Police (Vreemdelingen Politie) and the Immigration and Naturalization Service (Immigratie en Nat-uralisatie Dienst, IND). It is mandatory for every immigrant to notify the local population register immediately after arrival in the Netherlands if he or she intends to stay for at least two-thirds of the following six months. Natives as well as immigrants are required to register with their municipality. Our data comprise the entire population of immigrants who entered during our observation window of 1999 to 2007.
In addition to the date of entry and exit, the administration records the individual’s reason from migration. The motive is usually coded according to the visa status of the immigrant (see the web appendix for some details); if not, the immi-grant reports the reason when registering in the population register. Statistics Netherlands distinguishes several reasons: labor migrants, family migrants, student immigrants, asylum seekers (and refugees), and immigrants for other reasons. Given the focus of this paper on labor market events, we con-sider exclusively labor migrants, which represent 26% of all
non-Dutch immigrants in the age group 18 to 64.3
It is possible that the reason for labor migration is either miscoded or misreported. Since most non-EU labor migrants require an employment-dependent work visa to immigrate, they should be formally employed shortly after entry. Thus, in order to limit the possibilities of misclassification error of the reason for labor migration, we require that immigrants be employed in the Netherlands within three months of their entry (we have verified that our results are not sensitive to this particular cut-off; see section IVE). Of the original 146,290 migrants with a labor motive, 94,270 (64%) are employed within three months of their entry.
This immigration register is linked by Statistics Nether-lands to the Municipal Register of Population (Gemeentelijke 3This restriction is justified in detail in the discussion paper version of this paper (Bijwaard, Schluter, & Wahba, 2012), where we show that the other migrant groups have a substantially larger propensity to remain in the Netherlands, have a significantly weaker attachment to the labor market, and are demographically different.
Basisadministratie, GBA) and their Social Statistical Data-base (SSD). The GBA contains basic demographic character-istics of the migrants, such as age, gender, marital status, and country of origin. From the SSD we have information (on a monthly basis) on the labor market position, income, industry sector, housing, and household situation. Since we consider only new entrants to the Netherlands, most immigrants are not eligible for social benefits such as unemployment insur-ance payments; these are conditional on sufficiently long employment or length of residence (for non-EU immigrants, essentially five years). Statistics Netherlands classifies an individual as employed if the principal source of income is employment and as unemployed otherwise.
Although in principle the exact date of emigration is known, some migrants do not officially inform the author-ities when they leave. The departure of these noncomplying individuals is registered as an administrative removal after the authorities have assessed that the migrant has left the munici-pality without showing up in the files of another municimunici-pality in the Netherlands or as an emigrant. Given the municipal-ity registration requirement for all citizens, we know that these migrants have left the Netherlands for certain; however, the exact date of their departure is unknown. These admin-istrative removals are included among emigration, and they amount to around 38% of all emigrations. Of these admin-istratively removed migrants, 73% have no observed income in the country. We conjecture that the majority of these migrants left the country shortly after they stopped receiving income (either earnings or benefits). For those who still have income until they are administratively removed, we assume that they left at that exact date. We have explicitly addressed the issue of administrative removals in the formulation of the likelihoods below.
We thus arrive at a data set that contains 94,270 labor immigrants, 120,287 employment spells, and 56,783 peri-ods of unemployment. Distinguishing migrants according to their initial labor mobility, we estimate separate models for migrants from sending countries in the EU15 (“old Europe”), the new EU (the majority of whom are Poles and arrived after 2004), and the countries outside Europe, which are grouped into developed (DCs) and less developed (LDCs) sending countries. These groupings are defined precisely in the online appendix.
A. Summary Statistics: Labor Immigrants
We discuss the summary statistics for our data relating to the dynamics of migration and of labor market events (the online appendix considers other aspects of the data). In table 1 we consider the incidence of return migration and conditional on returning, the duration of the stay in the Netherlands. Note that the group of “stayers” includes permanent immigrants and temporary migrants who have not yet returned. Hence immigrants from the new EU, having arrived predominantly in the second half of our observation window, are expected to exhibit a high proportion of incomplete migration periods.
Table 1.—Descriptive Dynamics
Non-EU
EU15 New EU DCs LDCs
Stayera 48.2% 70.9% 40.9% 58.6%
Length of stay at return migration
Less than 6 months 3.9% 12.9% 2.4% 6.0%
6–12 months 11.3% 20.0% 10.3% 13.6%
12–18 months 13.3% 17.1% 12.4% 13.2%
18–24 months 13.1% 14.0% 15.2% 13.4%
24–60 months 46.4% 29.7% 49.1% 43.6%
More than 5 years 11.6% 6.4% 10.8% 10.2%
Average in months 32.5 23.9 32.8 30.6
Labor market dynamics
Mean number of periods of employment and unemployment per migrant
Employment 1.349 1.233 1.093 1.221
Unemployment 0.714 0.475 0.405 0.509
Always employedb 49.9% 63.8% 64.5% 62.6%
Unemployed once 36.9% 28.5% 32.0% 29.1%
Unemployed more than once 13.2% 7.8% 3.5% 8.3% Never reemployedc 77.9% 83.4% 92.9% 86.2%
Reemployed once 14.5% 12.2% 5.8% 9.1%
Reemployed more than once 7.5% 4.4% 1.3% 4.8%
aStayers are migrants who remain in the country to the end of the observation period. bPercentage of migrants employed through their entire stay in the country.
cPercentage of migrants never reemployed, unemployed, and then reemployed during their stay in the
country.
This is borne out in the data, since the share of stayers from the new EU is 71%, whereas for other immigrants the range is between 41% and 59%. Relatedly, the durations of their completed periods of employment are shorter. However, a large share of new EU movers (13%) leave the Netherlands after less than six months, which is considerably larger than for other immigrant groups. These differences highlight the importance of an analysis disaggregating by sending coun-tries. Immigrants from the EU15 are more (less) likely to stay than migrants from (less) developed countries outside the EU. Conditional on returning, the distribution of com-pleted durations looks fairly similar for these three groups, as do the average durations.
Turning to the return probabilities by migration duration, figure 1 depicts their Kaplan Meier estimates for all
immi-grant groups.4All groups look very similar for durations up
to 24 months, after which the estimates fan out. Considering the two extreme estimates, immigrants from non-EU DCs are more likely to return than new EU immigrants, and this gap increases significantly until the end of the observation window. The other immigrant groups assume an intermedi-ate position. Overall, both table 1 and figure 1 highlight the temporary nature of labor migration. Across all immigrant groups, a substantial proportion leave the Netherlands within our observation window of 1999 to 2007, and many do so within 24 months.5
4See Wooldridge (2010). The estimator isPr{T
m≤ar} =1−
r
i=1(Ni−
Ei)/Niwithr=1,· · ·,RwhereTmdenotes the migration duration,Eithe number of immigrants observed to leave in theith interval[ai−1,ai), andNi is size of the risk set for this interval (the number of immigrants who have neither left nor have been censored at timeai−1).
5As a comparison, Aydemir and Robinson (2008) find that the out-migration rate in Canada twenty years after arrival is around 35% among young, working-age, male immigrants, and around six of ten of those who leave do so within the first year of arrival.
Figure 1.—Kaplan Meier Estimates of Return Probabilities 0 20 40 60 80 100 0.0 0.2 0.4 0 .6 0.8
months since first entry
retur n probabilities EU15 newEU DCs LDCs
Table 2.—Descriptive Statistics: Unemployed Immigrants Who Leave
Non-EU EU15 New EU DCs LDCs Unemployed at emigrationa 54.3% 44.4% 40.8% 48.7% Repeated unemploymentb 20.4% 14.1% 7.9% 15.1% Mean number & period of unemploymentb 1.30 1.20 1.10 1.22 Current unemployment durationb
Less than 3 months 18.5% 26.4% 23.3% 20.1%
3–6 months 15.8% 22.5% 17.1% 17.1%
6–12 months 22.7% 22.6% 19.5% 22.4%
More than 1 year 43.0% 28.5% 40.1% 40.4%
Average number of months 15.1 10.8 14.6 13.8
Preceding employment durationb
Less than 3 months 16.4% 17.7% 6.2% 11.8%
3–6 months 15.1% 17.7% 10.8% 11.9%
6–12 months 45.7% 39.0% 60.4% 54.0%
More than 1 year 22.8% 25.6% 22.6% 22.3%
Average number of months 15.5 13.2 20.0 17.8
aAs percentage of all migrants who leave.
bAt the departure moment for the migrants who are unemployed when they leave.
Turning to the labor market dynamics, table 1 reveals that migrants from the EU15, relative to the other groups, expe-rience greater labor market volatility. During the observation window, they experience a higher incidence of unemploy-ment (the mean number of periods of unemployunemploy-ment is 0.7), and more employment periods (1.3). A slightly bigger pro-portion are more than unemployed once (13%), and the share
of the “always employed” is smaller (50%).6
Since we seek to estimate the effects of negative and positive individual labor market shocks on the migration durations, we now consider the immigrants by their labor market status prior to their departure from the host country. Tables 2 and 3 condition on leaving the host country, whereas table 1 considered the unconditional labor market dynamics. 6Note that migrants who are always employed enter the likelihood as censored observations.
Table 3.—Descriptive Statistics: Reemployed Immigrants Who Leave
Non-EU EU15 New EU DCs LDCs Reemployed at emigrationa 7.4% 9.9% 2.7% 4.8% Repeated reemploymentb 29.9% 29.3% 10.2% 33.8% Mean number of periods of reemploymentb 1.45 1.42 1.13 1.52 Current (re-)employment durationb
Less than 3 months 18.2% 26.9% 17.1% 17.0%
3–6 months 16.7% 21.6% 15.1% 17.4%
6–12 months 23.4% 22.5% 26.9% 23.7%
More than 1 year 41.7% 29.0% 40.9% 41.9%
Average number of months 15.0 10.7 13.9 14.4
Preceding unemployment durationb
Less than 1 month 18.3% 22.2% 11.3% 20.7%
1–2 months 18.1% 18.1% 18.3% 13.2%
2–3 months 17.2% 20.0% 16.7% 20.4%
3–6 months 20.5% 19.7% 17.4% 22.0%
6–12 months 17.4% 13.2% 26.3% 15.9%
More than 1 year 8.5% 6.8% 8.6% 7.8%
Average number of months 5.1 4.3 6.3 4.9
aAs percentage of all migrants who leave.
bAt the departure moment for the migrants who are reemployed when they leave.
In table 2 we condition on being unemployed at the time of the return migration. In line with the results of table 1, immigrants from the EU15 have a higher incidence of unemployment at the time of their departure (54%), a higher incidence of repeated unemployment (20%), and they are more likely on average to experience longer periods of unem-ployment (15 months). Immigrants from non-EU DCs have, compared to Europeans, a lower incidence of unemployment (41%) and of repeated unemployment (8%), while their pre-ceding periods of employment were longer on average (20 months).
In table 3 we consider immigrants who, after a period of unemployment, found a job and subsequently left. Hence this group has a volatile labor market experience (employment, followed by unemployment, followed by reemployment), but the last labor market experience is a positive one. Unsur-prisingly, the incidence of such labor market histories is low, ranging between 3% and 10%. Although non-European immigrants from DCs exhibit the lowest incidence (3%), the durations of the last two labor market spells look fairly simi-lar across all groups, except for the new EU immigrants, who experience typically shorter durations.
III. The Econometric Model
We seek to determine the effect of labor market dynam-ics on the return migration intensity of immigrants, so the random outcome variable of interest is the time spent in
the Netherlands, denoted by Tm. The observational units
are labor immigrants in the host country (the Netherlands). For expositional clarity, we first present a restricted model of the migration period that ignores the labor market pro-cesses. These are introduced subsequently, and we address the empirical challenge that arises from the potential corre-lation between the labor market process and the migration process, which confounds the direct effect of interest.
Figure 2.—Migration and Labor Market Dynamics
We follow common practice in duration analysis and express the distribution of the migration duration variateTm in terms of the associated hazard, say,θm. The proportional hazard (PH) model expresses this return hazard as the product between a baseline hazard,λm(t), which is a function of time alone and common to all individuals, and a covariate func-tion, exp(xm(t)βmx), which accelerates exits: θm(t|xm(t)) =
λm(t)exp(xm(t)βmx). The covariate vector xm(t) is allowed to change over time. To accommodate unobserved het-erogeneity, the mixed proportional hazard model (MPH) extends the PH model by multiplying it by a time-invariant
person-specific error term, say vm, with distribution G:
θm(t|xm(t),vm)=vmλm(t)exp(xm(t)βmx).
We extend this simple framework in two ways. First, we introduce the MPH models for the unemployment and reem-ployment processes and describe the timing of events. All three processes are allowed to exhibit correlated effects that can arise from the correlation between the unobserved het-erogeneity terms (stemming from, for example, dynamic sorting). We then focus on the direct effect of interest, and consider and discuss the identification argument.
A. Labor Market Processes and the Timing of Events
Generically, letTdenote the random time since first entry into the Netherlands that an event takes place. In
particu-lar,Tm is the time the immigrant leaves the host country in
order to return to the sending country,Tethe time a period
of employment ends in the host country, and Tu the time
an unemployment period ends. The durations of the periods
of employment and unemployment are denoted byδe(t)and
δu(t), respectively.
The timing of events and our definitions are illustrated in figure 2. We depict the labor market and migration durations of two migrants. In accordance with our data definitions of section II, migrants are employed at the moment they enter the country. Migrant 1 arrives after migrant 2. The length of migrant 1’s (first) period of employment is δte11
= te11.
He remains in the country unemployed until timetm1. His
duration of unemployment is thusδtu11
= tu11−te11. The
unemployment is terminated at the moment he leaves the host country at timetm1. Migrant 2 stays longer in the country,
tm2 > tm1, and undergoes a different labor market
experi-ence. His first employment has durationδte21
=te21. After
an unemployment period of lengthδtu21
= tu21−te21, he
becomes employed again. This second employment period
is terminated when he leaves the host country at time tm2
and has durationδte22
= te22−tu21. The last labor market
period for each migrant is always censored. While Migrant 1 experiences an adverse labor market shock (unemployment), migrant 2 experiences a positive shock (reemployment). We seek to determine the effect of such shocks in terms of both their incidences and their durations, on the duration of the migration spell.
Because the migrant is either employed or unemployed, the labor market process is alternating and has three possible transitions: unemployment to employment, employment to unemployment, or return migration. The conditional hazards for periods of unemployment and reemployment follow MPH models: θu δu(t)xu(t),vu =vuλu δu(t) exp xu(t)βux , (1) θe δe(t)xe(t),ve =veλe δe(t) exp xe(t)βex , (2)
with baseline hazards λk, unobserved time-invariant
char-acteristicsvk, and observed time-varying characteristicsxk, wherek ∈ {u,e}denotes the labor market state. In order to keep track of labor market events, we also define the associ-ated time-varying indicators: the indicatorIu(t)takes a value of 1 if the migrant is unemployed at timet, andIr(t) indi-cates that the immigrant is employed again after a period of unemployment. This setting is further generalized by distinguishing between the number of the labor market spell. The return migration hazard is also of the MPH form. We allowTm,δe(t), andδu(t)to be correlated through unobserv-able heterogeneity terms and through a possible direct effect of labor market dynamics on the migration hazard. The latter
is the effect to which we now turn. We consider both the inci-dence of the unemployment and reemployment event, as well as its duration, and allow the impact to vary systematically with observed characteristics. In our empirical implementa-tion, these three aspects of the impacts (incidence, duraimplementa-tion, and heterogeneity) are considered progressively. Thus, the extended MPH model for the return hazard is
θm(t|tu,te,xm(t),z(t),vm)=vmλm(t) ×exp xm(t)βmx +Iu(t) γu+αu δu(t) +zu(t)φu +Ir(t) γe+αe δe(t) +ze(t)φe . (3)
The covariateszin the (return) migration hazard are a subset
of the time-varying characteristics of the migrants x. The
duration impacts, αk, are modeled by piecewise constant
functions, so these effects are allowed to exhibit duration dependence. The unobserved error terms(ve,vu,vm)are
dis-tributed according to some distribution functionGand induce
correlated effects, to which we now turn.
B. Endogeneity: Confounding Unobservable Heterogeneity It is well known that due to dynamic sorting effects, the
distribution ofveamong those who become unemployed at
te will differ from its population distribution. In particular,
individuals with high ve will tend to enter unemployment
earlier than individuals with lowve. Ifveandvmare
depen-dent, the distributionvmfor unemployed migrants at a given
time in the country will differ from the distribution of vm
for migrants still employed. Similarly, ifvm andvu are not
independent, then the distribution ofvm among reemployed
migrants will differ from its population distribution. There-fore, one cannot infer the causal effect of unemployment on the return migration from a comparison of the realized
dura-tions of those who became unemployed attewith the rest of
the population, because one would then mix the causal effect of unemployment on the duration with the difference in the distribution ofvmbetween these migrants. In this case,Iu(t) andIr(t)will be endogenous, andTu,Te, andTm should be modeled jointly to account for the dependence of the unob-served heterogeneity terms. Therefore, we allowvu,ve, and vmto be correlated.
For parsimony,7we assume that each of the unobserved
heterogeneity terms remains the same for recurrent dura-tions of the same type, and we adopt a two-factor loading
model with two independent fundamental factors,W1 and
W2, both having a discrete distribution on (−1, 1) with
7After five years of continuous full-time employment, immigrants in the Netherlands can apply for permanent residenceship, making them eligi-ble for welfare and employment rights similar to those enjoyed by natives (by contrast, EU15 immigrants gain these almost immediately; see online appendix A for details). Such a status change could imply that the unob-served heterogeneity vectorvchanges at this date. However, our Kaplan Meier estimates of figure 1 reveal that most immigrants return before month 60, and that at this date, the return probability does not exhibit a jump.
pj=Pr(Wj=1). Hence,
vk =exp(αk1W1+αk2W2), (4)
withk= {u,e,m}. LetW =(W1,W2), v=(ve,vu,vm), and Abe the matrix of factor loadings with rowsAk=(αk1,αk2).
Note that this two-factor model is very general as it allows for positive and negative correlations among the unobserved heterogeneity terms. The variance-covariance matrix of the
unobserved heterogeneity terms is given by Varln(v) =
AVar(W)A.8Using a two-point mass specification to model
unobserved heterogeneity is common in duration analysis, and extending this to correlated processes by considering a factor-loading specification has also been pursued recently in Crépon, Ferracci, and Fougére (2012) and Osikominu (2013). C. Identification and the Timing-of-Events Method
The full effect of employment dynamics on remigra-tion hazards is given in our framework by the funcremigra-tions
γu +αu δu(t) +zu(t)φu andγe+αe δe(t) +ze(t)φe. An application of the timing-of-events method of Abbring and Van den Berg (2003) implies that these effects can have a causal interpretation. This method requires that the dura-tions of employment, unemployment, and migration are modeled parametrically as MPHs, as we have, and that the
so-called no-anticipation assumption holds. Denote bytethe
time an unemployment event would start, and consider first
the migration hazard at a timet before the unemployment
event. The (untestable) no-anticipation assumption requires that migrants do not anticipate the unemployment event by migrating before the anticipated event would occur. The
migration intensity θm
t|te,tu,xm(t),vm
is assumed to be affected only fort >te:
θm t|te1, . =θm t|te2, .
for allt<min{te1,te2}. (5) We proceed to discuss some potential threats to the validity of the no-anticipation assumption with particular reference to the Dutch case (see the online appendix A for a more detailed discussion of Dutch labor and residentship law). The latent risk group consists of currently employed immigrants who expect to lose their jobs at some future time te > t, and “anticipators” are those among them who migrate at time t < te. By choosing to migrate, they forgo two payoffs: (a) they terminate their employment voluntarily and thus forgo
the expected income flow until timeteand any redundancy
compensation if eligible, and (b) they forgo the option of
on-the-job search for a new job beforeteand the option of job
search from unemployment afterte. However, these option
values are usually nontrivial. In particular, immigrants who become unemployed are permitted to search for a new job subject to time limits, and table 1 has shown that reemploy-ment probabilities are significant. As for on-the-job search, 8One additional restriction is needed for identification. We letαm2=0.
external estimates for Dutch data suggest that job-to-job tran-sitions exceed job offer arrival rates for the unemployed (van den Berg & Ridder, 1998, table VII)). The scope for anticipa-tion is also limited by the flexibility of the Dutch labor market: unions have little power, and the statutory notice period for a job termination, one month, is short; hence, the potential anticipation periodte−tm is likely to be short relative to
the migration durationtm (recall from figure 1 that only a
small proportion of immigrants leave within one year and only about 20% have left within two years). In order to gauge the magnitude of the potential bias induced by anticipation, online appendix B considers extensive simulation evidence.
We consider two other potential threats to identification peculiar to the Dutch legal framework: (a) in month 36 of continuous full-time employment any full-time work
con-tract9essentially becomes permanent, and (b) in month 60 of
continuous full-time employment, non-EU immigrants gain residence and benefit rights. Some employers might thus have an incentive to terminate a contract at these critical dates. To assess the empirical relevance of these threats, we recon-sider the Kaplan Meier estimates of the return probabilities of figure 1. An active systematic threat should manifest itself in terms of jumps. The figure, however, does not suggest the presence of jumps around months 36 and 60.
D. Administrative Removal
Some migrants do not officially inform the authorities that they are about to leave the host country. However, all citi-zens (immigrants and natives) are required to register with their municipalities (this is a prerequisite for many social services and for tax benefit matters). It is thus clear that any migrant who has no entries in the tax benefit register and does not appear in the register of another municipality must have left the country. Only the exact date of the departure is unknown. Such noncompliers are periodically identified and removed from the registers by the authorities in a step labeled “administrative removal.”
We address this as follows. We assume that the two observ-able events of administrative removal and zero income at last observed time imply that the migrant has left before the date the administrative removal is recorded, and after the last date of any observed change in the observed characteristics (e.g., labor market status, housing, and marital status). Such limited information is equivalent to interval-censored data. For interval-censored data, the exact end of a duration is unknown, but it is known that the duration ended at some point. If a migrant is administratively removed at duration
ta and the last observed change for this migrant occurred at
durationt1 <ta, the contribution to the likelihood (of the out-migration) of this migrant is the probability of survival untilt1
times the probability that the migrant left the country between t1 andta. The latter is equal to the survival fromt1 untilta 9Unfortunately, we do not have data about the status of an individual’s work contract; however, external estimates (Sà, 2008) suggest that the share of temporary contracts among recent male immigrants is about 32%.
given survival. Consequently, administrative removal has no effect on the employed part of the likelihood function or on the likelihood of migrants who are administratively removed with nonzero income until their administrative removal date. Letaiindicate whether the emigration of migrantiwas due to an administrative removal (ai=1). For an administratively
removed migrant, we introduce two different event dates:ta
i is the administrative removal date, andt1
i < tia is the date of the last recorded change in any of the characteristics of migrantibeforetai.
E. Likelihood Function
We have data for i = 1,. . .,n immigrants entering the
Netherlands in our observation window. Let Kie and Kiu
denote the number of the observed employment and
unem-ployment spells of individuali. Note that for some migrants,
Kiu = 0 (e.g., a migrant who remains employed). We
con-sider only the first period of migration. The three indicators
Δu
ik,Δeik, andΔmi signal thatkth employment/unemployment, or the migration spell is uncensored. Thus, the likelihood
contribution of migranticonditional on the unobserved
het-erogeneityv = (ve,vu,vm)is, in the light of the preceding discussions: Li(v)= Kiu k=1 θu δu(tik)·,vu Δu ik ×exp − δu(tik) 0 θu(τ|·,vu)dτ (1−aik) · exp − δu(tik1) 0 θu(τ|·,vu)dτ −exp − δu(tika) 0 θu(τ|·,vu)dτ aikIu(tik−) × Kie j=1 θe δe(tij)·,ve Δe ijexp− δe(tij) 0 θe(τ|·,ve)dτ Ie(t−ij) × θm(ti|·,vm)Δ m i exp − ti 0 θm(τ|·,vm)dτ (1−ai) · exp − t1 i 0 θm(τ|·,vm)dτ −exp − tia 0 θm(τ|·,vm)dτ ai . (6)
This likelihood naturally separates unemployment, employ-ment, and migration periods, and for each allows for cen-soring and administrative removal. To simplify notation, we have suppressed the dependence on observed characteristics in the hazard rates.Iu(tik−)indicates that the migrant is unem-ployed just beforetik, and similarly forIe(til−). WhenKiu=0, the relevant term becomes 1. Note that the last, and only the last, labor market spell is censored. This is either because the migrant is still in the country at the end of the observation period or has left.
Integrating out the unobserved heterogeneity, we obtain the likelihood function
L= n i=1 Li(v)dG(ve,vu,vm), (7) whereG(ve,vu,vm)is the joint distribution of the unobserved
heterogeneity terms implied by the discussion ofvkgiven by
equation (4).
IV. Results
The full model, given by the MPH hazards (1) to (3) and the heterogeneity model (4), permits the effects of the labor market processes to exhibit duration dependence and vary systematically with observed characteristics, while controlling for correlated effects that arise from correlated unobserved heterogeneity. In view of this complexity, and given the nested structure of the model, we first consider simpler variants before turning to the full model.
A. The Restricted Model
In order to gain a first descriptive impression of the effect of the incidence of unemployment on migrants’ return, we com-pare the Kaplan Meier estimates for the group of immigrants who always work and those who have experienced unemploy-ment once (at the date of their return, the latter might be either still unemployed or are reemployed). For short durations, this comparison is, of course, distorted, as immigrants who expe-rience changes in their labor market status must have stayed for a sufficiently long period to allow such events to take place.
Figure 3 depicts the Kaplan Meier estimates for all immi-grants (the plots for each immigrant group look similar). It is evident that for durations above 20 months, unemployment seems to have a significant effect on return probabilities. The size of the effect seems to increase in the duration of stay. We proceed from this descriptive analysis to the analysis based on our empirical model.
We focus first on the incidence of labor market events by setting the varying duration and heterogeneity impacts to 0,αk = φk = 0, and refer to this as the timing-of-events model 1. It nests the PH model that ignores unobservable het-erogeneity altogether,θPH
m (t|tu,te,xm(t)) = exp(xm(t)βmx + Iu(t)γu + Ir(t)γe), whereas the MPH model, θMPHm (t|tu,te, xm(t),vm) = vmθPHm (t|tu,te,xm(t)) ignores the correlation betweenλm and(λu,λe). The coefficients of interest areγu andγe.
Table 4 reports the estimates of the effects given by γu
and γe. The simple PH model already demonstrates the
importance of labor market events on return migration. In all cases (except one), the incidence of an unemployment spell significantly increases return probabilities, and the event of finding employment increases migration durations. Extending this model to incorporate (uncorrelated) unob-served heterogeneity has only a small effect on the estimated causal effect.
Figure 3.—Kaplan Meier Estimates of Return Probabilities by Labor Market Experience 0 20 40 60 80 100 0.0 0.2 0.4 0.6 0.8 1.0
months since entry
retur
n
probabilities
always worked Once no work
Table 4.—Incidence Impact of Labor Market Events on Return-Migration Hazards Non-EU EU 15 New EU DCs LDCs Unemployment PH model 1.045∗∗∗ 0.938∗∗∗ 0.103 1.400∗∗∗ (0.095) (0.192) (0.219) (0.300) MPH model 1.144∗∗∗ 0.967∗∗∗ 0.267 1.501∗∗∗ (0.099) (0.193) (0.239) (0.307) Timing-of-events 0.778∗∗∗ 0.684∗∗∗ 0.223 1.207∗∗∗ model 1 (0.105) (0.197) (0.237) (0.314) Reemployment PH model −0.179∗∗∗ 0.203∗∗∗ −0.370∗∗∗ −0.383∗∗∗ (0.027) (0.062) (0.078) (0.061) MPH model −0.163∗∗∗ 0.217∗∗∗ −0.332∗∗∗ −0.367∗∗∗ (0.029) (0.063) (0.088) (0.064) Timing-of-events −0.091∗∗ 0.277∗∗∗ −0.356∗∗∗ −0.093 model 1 (0.038) (0.069) (0.125) (0.083) ∗∗p<0.05;∗∗∗p<0.01.
However, taking into account the correlated unobserved heterogeneity in the timing-of-events model substantially affects the estimates. The estimated effect is typically smaller in magnitude than for both PH and MPH models. For instance, as regards the incidence of unemployment for EU15 immi-grants, the MPH estimate is 1.144, whereas our model estimate is .778, the two differing by a factor of 1.47. We conclude that ignoring the endogeneity issue would result in substantial selectivity biases.
B. The Full Model
Building on the insights of the timing-of-events model 1, we first allow the durations of the labor market events to have an impact on immigration durations more flexibly. This is implemented nonparametrically by modeling the sequence
{αk}as piece-wise constant functions. Thus, in model 2, we
Table 5.—Estimated Effect of Becoming Unemployed on Return Migration Hazards
Model 1 Model 2 Model 3
Non-EU Non-EU Non-EU
EU 15 New EU DCs LDCs EU 15 New EU DCs LDCs EU 15 New EU DCs LDCs
Constant effect[γu] 0.778∗∗∗ 0.684∗∗∗ 0.223 1.207∗∗∗ (0.105) (0.197) (0.237) (0.314) Duration dependence[αu] 0–3 months 0.643∗∗∗ 0.585∗∗∗ 0.379 1.261∗∗∗ 0.865∗∗∗ 1.814∗∗∗ 0.108 1.058∗∗∗ (0.106) (0.202) (0.222) (0.308) (0.117) (0.272) (0.241) (0.326) 3–6 months 0.658∗∗∗ 0.910∗∗∗ 0.282 1.406∗∗∗ 0.983∗∗∗ 2.054∗∗∗ 0.047 1.183∗∗∗ (0.107) (0.206) (0.224) (0.311) (0.119) (0.275) (0.243) (0.328) 6–12 months 0.517∗∗∗ 0.698∗∗∗ −0.214 1.358∗∗∗ 0.939∗∗∗ 1.752∗∗∗−0.423 1.116∗∗∗ (0.107) (0.211) (0.226) (0.314) (0.119) (0.277) (0.244) (0.328)
More than 1 year 0.312∗∗∗ 0.748∗∗∗ −0.509∗∗ 1.575∗∗∗ 1.009∗∗ 1.562∗∗∗−0.671∗∗∗ 1.315∗∗∗
(0.117) (0.226) (0.224) (0.328) (0.123) (0.278) (0.243) (0.336) Labor market history[φu]
Repeated unemployment −0.198∗∗∗−0.523∗∗ 0.067 −0.459∗∗∗
(0.057) (0.205) (0.232) (0.145)
Order of unemployment spell −0.186∗∗∗−0.046 −0.216 −0.156
(0.032) (0.126) (0.182) (0.083) Duration of previous employment spell
Less than 3 months −0.302∗∗∗−0.235∗∗ 0.065 −0.016
(0.043) (0.117) (0.122) (0.103)
3–6 months −0.338∗∗∗−0.081 0.116 −0.119
(0.043) (0.103) (0.087) (0.096)
More than 1 year −0.318∗∗∗−0.189∗∗ 0.032 −0.153∗∗
(0.036) (0.092) (0.064) (0.072) The model equations are given by (1) to (3), the likelihood by (7). SE in parentheses.∗∗:p<0.05 and∗∗∗:p<0.01. Model 3 covariates (z) also include demographics (sex, married, number of children, age group dummies, and cohort effects measured by the year of entry). Reference category for employment durations: 6–12 months. “Order of unemployment spell” refers to the second, third, etc. period of unemployment.
Table 6.—Estimated Effect of Reemployment on Return Migration Hazards
Model 1 Model 2 Model 3
Non-EU Non-EU Non-EU
EU 15 New EU DCs LDCs EU 15 New EU DCs LDCs EU 15 New EU DCs LDCs
Constant effect[γe] −0.091∗∗ 0.277∗∗−0.356∗∗−0.093 (0.038) (0.069) (0.125) (0.083) Duration dependence[αe] 0–3 months −0.222∗∗ 0.298∗∗∗−0.233 −0.327∗∗−0.096 0.339 −0.164 −0.302 (0.089) (0.113) (0.182) (0.147) (0.082) (0.205) (0.253) (0.186) 3–6 months 0.017 0.454∗∗∗−0.190 0.000 0.127 0.532∗∗ 0.132 0.085 (0.088) (0.122) (0.192) (0.142) (0.083) (0.209) (0.260) (0.185) 6–12 months −0.042 0.203 −0.097 −0.102 0.083 0.319 0.054 0.038 (0.080) (0.119) (0.145) (0.123) (0.077) (0.211) (0.229) (0.172)
More than 1 year −0.315∗∗∗ 0.194 −0.641∗∗∗−0.390∗∗∗−0.242∗∗∗ 0.357 −0.626∗∗∗ 0.140
(0.058) (0.108) (0.119) (0.095) (0.072) (0.210) (0.214) (0.158) Labor market history[φe]
Repeated reemployment 0.068 0.327 −0.073 0.261
(0.091) (0.214) (0.586) (0.202)
Order of reemployment spell (>1) −0.194∗∗∗−0.055 −0.318 −0.097
(0.051) (0.125) (0.423) (0.107)
On benefit −0.431∗∗∗−0.825∗∗∗ 0.048 −0.570∗∗∗
(0.085) (0.314) (0.284) (0.210) Duration of previous unemployment spell
Less than 1 month −0.406∗∗∗−0.332∗∗−0.128 −0.281
(0.080) (0.165) (0.285) (0.174) 1–2 months −0.284∗∗∗−0.138 0.298 −0.580∗∗∗ (0.079) (0.173) (0.248) (0.195) 2–3 months −0.185∗∗ 0.100 −0.037 −0.164 (0.080) (0.168) (0.252) (0.172) 6–12 months 0.030 −0.179 0.294 −0.279 (0.080) (0.188) (0.226) (0.184)
More than 1 year 0.079 −0.162 −0.444 −0.218
(0.101) (0.238) (0.305) (0.240) See table 5 notes.
Figure 4.—Assessing the Impact of Truncating Immigration Durations at Month 36 0 20 40 60 80 100 0.2 0.4 0.6 0.8 1.0
months since first entry
emplo yment probabilities EU15 newEU DCs LDCs 0 5 10 15 20 25 30 35 0.00 0.10 0.20 0.30 months retur n probability EU15 0 5 10 15 20 25 30 35 0.00 0.10 0.20 0.30 months retur n probability LDCs
Left: Kaplan Meier estimates of employment probabilities. Right: Impacts on return probabilities for unemployment periods of 12 months that start in month 3 (broken lines are based on the truncated data at month 36; the solid lines are based on the unrestricted data).
allow the effect to be heterogeneous across migrants in terms ofzuandze, which measure demographics and previous labor market history. For expositional clarity, we present the effect of the periods of unemployment and reemployment spells in tables 5 and 6 separately, although it is clear from equation (7) that these are estimated simultaneously. For ease of reference, model 1 reports the results of the last row of table 4. For brevity, we do not discuss the coefficients of the covariates
xkwhich are of only secondary importance.10
C. The Effects of Becoming Unemployed
The estimated effects of unemployment spells on return migration hazards are reported in table 5. Across all three specifications and all immigrant groups, it is evident that
unemployment spells shorten migration durations.11
10The estimates are available from the authors. The covariates include extensive measures of demographics, a nonparametric function of income, housing descriptors, sector dummies, cohort effects measured by the year of entry, and controls for macro effects.
11 In the discussion paper version of this paper (Bijwaard et al., 2012), we quantify the impacts of the unemployment process in various evalu-ation exercises in terms of the return probability 1−Pr{Tm >t}where
We recall that the average effectγufor all of the groups of immigrants estimated in model except for immigrants from non-EU DCs, the significant point estimates ranging from 0.68 to 1.2. Models 2 and 3 reveal that the effect exhibits duration dependence. In model 2, for EU migrants, the impact peaks for durations of 3 to 6 months. For non-EU migrants, the picture is more heterogeneous, as duration dependence increases for immigrants from LDCs, whereas the coeffi-cients remain insignificant for the others except for long durations. In model 3, we further permit the effect to vary across characteristics (demographics and labor market his-tory). This increases the magnitude of the duration effects for EU immigrants, and follows since the duration of the pre-ceding employment spell lengthens the migration spell. By
Pr{Tm>t} =Evm{exp(−
t
0θm(s)ds)}. For instance, consider a reference individual (βm
x =0,φu=0,φe=0) from the EU15 who starts a period of unemployment three months after entry into the Netherlands in 2003. If he is unemployed for twelve rather than three months, the maximal increase in the return probability is 6 percentage points. If he is from an LDC, the maximal difference is 14 percentage points. Holding the length of the unem-ployment period constant at six months, but starting it progressively later, we found a maximal increase in return probabilities of 6 percentage points.
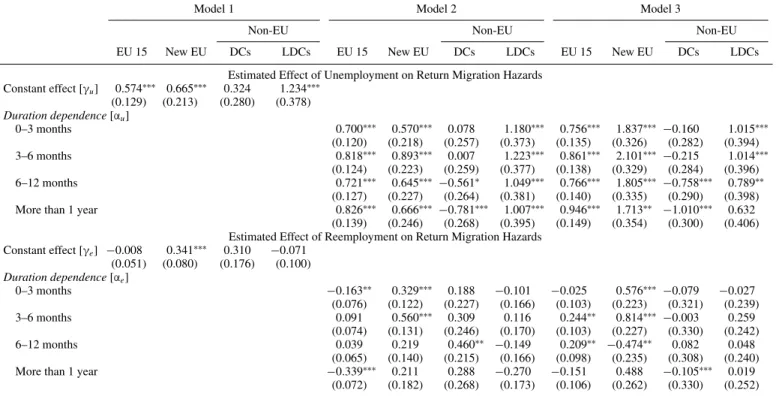
Table 7.—Sensitivity Analysis: Migration Durations Less Than Three years
Model 1 Model 2 Model 3
Non-EU Non-EU Non-EU
EU 15 New EU DCs LDCs EU 15 New EU DCs LDCs EU 15 New EU DCs LDCs
Estimated Effect of Unemployment on Return Migration Hazards Constant effect[γu] 0.574∗∗∗ 0.665∗∗∗ 0.324 1.234∗∗∗ (0.129) (0.213) (0.280) (0.378) Duration dependence[αu] 0–3 months 0.700∗∗∗ 0.570∗∗∗ 0.078 1.180∗∗∗ 0.756∗∗∗ 1.837∗∗∗ −0.160 1.015∗∗∗ (0.120) (0.218) (0.257) (0.373) (0.135) (0.326) (0.282) (0.394) 3–6 months 0.818∗∗∗ 0.893∗∗∗ 0.007 1.223∗∗∗ 0.861∗∗∗ 2.101∗∗∗ −0.215 1.014∗∗∗ (0.124) (0.223) (0.259) (0.377) (0.138) (0.329) (0.284) (0.396) 6–12 months 0.721∗∗∗ 0.645∗∗∗ −0.561∗ 1.049∗∗∗ 0.766∗∗∗ 1.805∗∗∗ −0.758∗∗∗ 0.789∗∗ (0.127) (0.227) (0.264) (0.381) (0.140) (0.335) (0.290) (0.398)
More than 1 year 0.826∗∗∗ 0.666∗∗∗ −0.781∗∗∗ 1.007∗∗∗ 0.946∗∗∗ 1.713∗∗ −1.010∗∗∗ 0.632
(0.139) (0.246) (0.268) (0.395) (0.149) (0.354) (0.300) (0.406)
Estimated Effect of Reemployment on Return Migration Hazards Constant effect[γe] −0.008 0.341∗∗∗ 0.310 −0.071 (0.051) (0.080) (0.176) (0.100) Duration dependence[αe] 0–3 months −0.163∗∗ 0.329∗∗∗ 0.188 −0.101 −0.025 0.576∗∗∗ −0.079 −0.027 (0.076) (0.122) (0.227) (0.166) (0.103) (0.223) (0.321) (0.239) 3–6 months 0.091 0.560∗∗∗ 0.309 0.116 0.244∗∗ 0.814∗∗∗ −0.003 0.259 (0.074) (0.131) (0.246) (0.170) (0.103) (0.227) (0.330) (0.242) 6–12 months 0.039 0.219 0.460∗∗ −0.149 0.209∗∗ −0.474∗∗ 0.082 0.048 (0.065) (0.140) (0.215) (0.166) (0.098) (0.235) (0.308) (0.240)
More than 1 year −0.339∗∗∗ 0.211 0.288 −0.270 −0.151 0.488 −0.105∗∗∗ 0.019
(0.072) (0.182) (0.268) (0.173) (0.106) (0.262) (0.330) (0.252) See the notes to table 5.
contrast, the effect of the previous labor market history is found to be insignificant for non-EU DC immigrants. D. Effects of Becoming Reemployed
Finding employment after a period of unemployment is a positive labor market event that is likely to have an impact on migration duration. Table 6 reports the results. For all except non-EU LDC immigrants, the effect of having found employment after being unemployed delays the migrant’s return. The effect is particularly strong for immigrants from developed countries outside the EU. Previous unemployment durations exhibit an effect only if these were no longer than three months, indicating that such periods of unemployment were anomalies that the individual quickly overcame. The one immigrant group that deviates from this pattern of extended migration durations is made up of immigrants from the new EU—mainly Polish immigrants. The estimated impact of reemployment for this group, however, is consistent with tar-get savings: having regained employment, it is plausible that such immigrants are back on track to reach their savings target and return once they have saved enough.
E. Sensitivity Checks
Our modeling approach assumes that unobserved hetero-geneityvis time invariant. One concern is that this might not be valid for individuals who experience multiple labor market transitions. However, we cannot condition on the experience of only one period of unemployment because of the ensuing
selection bias. We address this concern by truncating the data at 36 months since entry, a period sufficiently long to allow labor market events to take place while at the same time being sufficiently short to make multiple transitions less likely.
The left panel of figure 4 depicts the estimates of the Kaplan Meier estimates of unemployment probabilities and the imposed cut-off date. The plot illustrates, as did our earlier descriptive tables, the substantial unemployment risk that all immigrant groups experience and the importance of stratifica-tion by immigrant group. Table 7 reports, for these restricted data, the estimates of models 1 to 3, concentrating for reasons
of space on the estimates of the impact coefficientsγk and
αk.
The results for the restricted durations are similar to those for the unrestricted sample of tables 5 and 6. The coefficients have changed only slightly without affecting the qualitative conclusions. The right panel of figure 4 illustrates the effect of the change in the coefficients brought about by the truncation at month 36. These are assessed in terms of the effect on return probabilities for the representative immigrant, assuming an unemployment period of twelve months that starts in month 3 (see also note 11). For EU15 immigrants, there is a small effect on return probabilities for the higher durations, whereas for LDC immigrants, there is no discernable difference.
Another concern could be our selection rule that the immi-grant be employed within three months of entry into the Netherlands, imposed to limit the potential of misclassifica-tion of the labor motive. We have reestimated the models for varying cut-offs. For brevity, table 8 reports the estimates of the impacts of the labor market process on migration hazards
Table 8.—Effect of Changing the Initial Employment Requirement in Model 1 Non-EU EU 15 New EU DCs LDCs Unemployment 2 months 0.759∗∗∗ 0.607∗∗∗ 0.171 1.232∗∗∗ 3 months 0.778∗∗∗ 0.684∗∗∗ 0.223 1.207∗∗∗ 4 months 0.767∗∗∗ 0.714∗∗∗ 0.213 1.241∗∗∗ 5 months 0.739∗∗∗ 0.703∗∗∗ 0.280 1.248∗∗∗ Reemployment 2 months −0.078∗∗ 0.273∗∗∗ −0.372∗∗∗ −0.080 3 months −0.091∗∗ 0.277∗∗∗ −0.356∗∗∗ −0.093 4 months −0.099∗∗∗ 0.282∗∗∗ −0.463∗∗∗ −0.120 5 months −0.105∗∗∗ 0.296∗∗∗ −0.443∗∗∗ −0.095 ∗∗p<0.05;∗∗∗p<0.01.
of model 1 (the same conclusions obtain for models 2 and 3). We observe only a small change in the point estimates, and all qualitative conclusions remain unchanged.
Online appendix B contains several other simulation-based robustness checks: we verify the robustness of our estimation procedure, conduct a simulation-based placebo test assuming no labor market impact, and examine the sensitivity of the results to departures from the no-anticipation assumption.
V. Conclusion
The majority of recent labor immigration to the Nether-lands is temporary rather than permanent. Across all immi-grant groups, a substantial proportion leave the host country eventually, and many do so within 24 months. We have con-sidered in this paper the individual labor market drivers of immigration durations.
Despite this extent of temporary immigration, the interde-pendence of labor market events and immigration durations has received little attention in the empirical literature. We have addressed this gap using a unique Dutch administrative panel of the entire population of recent labor immigrants, in which we observe entry, exit, reason for migration, and complete labor market histories. The large size of the data permitted us to stratify the analysis by distinct immigrant groups. The timing-of-events method enabled us to esti-mate the effects of employment and unemployment histories on migration durations, while we controlled for unobserv-able heterogeneity. Simpler models that ignore such error
correlations across labor market and migration processes were shown to exhibit substantial selection biases.
REFERENCES
Abbring, Jaap H., and Gerard J. van den Berg, “The Non–Parametric Iden-tification of Treatment Effects in Duration Models,”Econometrica
71 (2003), 1491–1517.
Aydemir, Abdurrahman, and Chris Robinson, “Global Labor Markets, Return and Onward Migration,” Canadian Journal of Economics
41 (2008), 1285–1311.
Bijwaard, Govert E., “Immigrant Migration Dynamics Model for the Netherlands,”Journal of Population Economics23 (2010), 1213– 1247.
Bijwaard, Govert E., Christian Schluter, and Jackline Wahba, “The Impact of Labour Market Dynamics on the Return-Migration of Immi-grants,” CReAM discussion paper 27/12 (2012).
Borjas, George J., and Brent Bratsberg, “Who Leaves? The Outmigration of the Foreign Born,” thisreview78 (1996), 165–176.
Crépon, Bruno, Marc Ferracci, and Denis Fougére, “Training the Unem-ployed in France: How Does It Affect Unemployment Duration and Recurrence?”Annales d’Economie et de Statistique108 (2012), 175–200.
Dustmann, Christian, “Children and Return Migration,”Journal of Popu-lation Economics16 (2003), 815–830.
Dustmann, Christian, and Yoram Weiss, “Return Migration: Theory and Empirical Evidence,” British Journal of Industrial Relations 45 (2007), 236–256.
Galor, Oded, and Oded Stark, “The Probability of Return Migration, Migrants’ Work Effort, and Migrants’ Performance,” Journal of Development Economics35 (1991), 399–405.
Gibson, John, and David McKenzie, “The Microeconomic Determinants of Emigration and Return Migration of the Best and Brightest,”Journal of Development Economics95 (2011), 18–29.
Kirdar, Murat, “Labor Market Outcomes, Savings Accumulation, and Return Migration,”Labour Economics16 (2009), 418–428. Nekby, Lena, “The Emigration of Immigrants, Return vs. Onward
Migra-tion: Evidence from Sweden,”Journal of Population Economics19 (2006), 197–226.
Osikominu, Aderonke, “Quick Job Entry or Long-Term Human Capi-tal Development? The Dynamic Effects of Alternative Training Schemes,”Review of Economic Studies80 (2013), 313–342. Sá, Filipa, “Does Employment Protection Help Immigrants? Evidence from
European Labor Markets,” IZA discussion paper 3414 (2008). van den Berg, Gerard J., “Duration Models: Specification, Identification,
and Multiple Duration” (pp. 3381–3460), in James J. Heckman and Edward Leamer, eds.,Handbook of Econometrics(Amsterdam: North–Holland, 2001).
van den Berg, Gerard J., and Geert Ridder, “An Empirical Equilibrium Search Model of the Labor Market,” Econometrica66:5 (1998), 1183–1222.
Wooldridge, Jeffrey M.,Econometric Analysis of Cross Section and Panel Data, 2nd ed. (Cambridge, MA: MIT Press, 2010).
Yang, Dean, “Why Do Migrants Return to Poor Countries? Evidence from Philippine Migrants’ Responses to Exchange Rate Shocks,” this