Effects of decentralization
on school resources
Åsa Ahlin
Eva Mörk
The Institute for Labour Market Policy Evaluation (IFAU) is a research insti-tute under the Swedish Ministry of Industry, Employment and Communica-tions, situated in Uppsala. IFAU’s objective is to promote, support and carry out: evaluations of the effects of labour market policies, studies of the function-ing of the labour market and evaluations of the labour market effects of meas-ures within the educational system. Besides research, IFAU also works on: spreading knowledge about the activities of the institute through publications, seminars, courses, workshops and conferences; creating a library of Swedish evaluational studies; influencing the collection of data and making data easily available to researchers all over the country.
IFAU also provides funding for research projects within its areas of interest. There are two fixed dates for applications every year: April 1 and November 1. Since the researchers at IFAU are mainly economists, researchers from other disciplines are encouraged to apply for funding.
IFAU is run by a Director-General. The authority has a traditional board, consisting of a chairman, the Director-General and eight other members. The tasks of the board are, among other things, to make decisions about external grants and give its views on the activities at IFAU. A reference group including representatives for employers and employees as well as the ministries and authorities concerned is also connected to the institute.
Postal address: P.O. Box 513, 751 20 Uppsala Visiting address: Kyrkogårdsgatan 6, Uppsala Phone: +46 18 471 70 70
Fax: +46 18 471 70 71 [email protected] www.ifau.se
Papers published in the Working Paper Series should, according to the IFAU policy, have been discussed at seminars held at IFAU and at least one other academic forum, and have been read by one external and one internal referee. They need not, however, have undergone the standard scrutiny for publication in a scientific journal. The pur-pose of the Working Paper Series is to provide a factual basis for public policy and the public policy discussion.
Effects of decentralization on school resources
* byÅsa Ahlin# & Eva Mörk⊗ January 12, 2005
Abstract
Sweden has undertaken major national reforms of its schooling sector which, consequently, has been classified as one of the most decentralized ones in the OECD. This paper investigates the extent to which local tax base, grants, pref-erences and structural characteristics affected local schooling resources as de-centralization took place. We use municipal data for the period 1989–95 which covers the key reform years without confounding decentralization with institu-tional changes after 1995. The main arguments against decentralization are not supported by our findings. First, school spending as well as teacher density is found to be more equally distributed across municipalities following decentrali-zation. Second, local tax capacity does not influence schooling resources more in the decentralized regime than in the centralized regime. We also find that the form in which grants are distributed matter: Targeted grants have a significant positive impact on resources while general grants have not.
Keywords: school resources, school finance reform, decentralization JEL: H40, H52, H70
* We are grateful for comments from Sören Blomquist, Erik Mellander, Mikael Sandström, Björn
Öckert and seminar participants at Department of Economics, Uppsala University. Discussions with Per Johansson have also been very valuable.
# Department of Economics, Uppsala University, e-mail: [email protected]
Table of contents
1 Introduction ... 3
2 Institutional background ... 5
2.1 The centralized regime ... 5
2.2 The decentralized regime... 6
2.2.1 The 1991 reform: shifting responsibility to the local level... 6
2.2.2 The 1993 grant reform... 7
3 Empirical literature on the effects of school finance reforms on school resources ... 8
4 Data... 11
4.1 Choice of variables ... 11
4.2 The development of school resources... 13
5 Did decentralization cause structural shifts in school resources?... 18
5.1 Model specification and empirical strategy... 18
5.2 Results ... 20
5.2.1 Per pupil spending ... 20
5.2.2 Teacher density... 23
5.3 Sensitivity analysis ... 25
5.3.1 Does the economic recession matter?... 25
5.3.2 Sluggish adjustment to reforms ... 29
6 Concluding comments and discussions ... 33
References... 35
1 Introduction
While the trend in many U S states has been to centralize school funding in or-der to avoid inequities in school district spending, Sweden has unor-dertaken
na-tional reforms to decentralize the responsibility and funding of the schooling
sector to lower level government (municipalities). In 1991, the responsibility for compulsory and upper secondary school provision was transferred to the lo-cal level along with a less centralized system of targeted grants to schooling. In 1993, a major grant reform transformed the system of targeted grants into a general grant system. The latter reform meant a fundamental change of the or-ganization of school funding. Cross-country comparisons undertaken after the implementation of these reforms rank Sweden as having one of the most decen-tralized schooling sectors in the OECD (OECD, 1998).
The main objectives with the Swedish reforms were to better adjust school-ing to local conditions, increasschool-ing efficiency and accountability. This is indeed one of the main theoretical arguments for decentralizing public tasks to lower level governments (see, e g, Oates, 1972). However, as is discussed by, e g, Boadway & Mörk (2004), fiscal decentralization inevitably gives rise to differ-ences in the capacity of local governments to provide public services. Given that there also are national objectives of equal opportunities – as in Sweden – some state influence may still be called for. The challenge is to accomplish this without unduly compromising the efficiency and accountability of public ser-vice production. In the decentralized school setting of Sweden, pupils’ equal access to a high standard of compulsory education was to be fulfilled through, on the one hand, centrally formulated curricula and a stipulated minimum number of teaching hours for each subject, and, on the other hand, an ambitious equalizing grant program constructed to compensate local governments with
adverse structural conditions.1
The purpose of this paper is to empirically investigate whether the reforms that decentralized the school organization affected local school resources and, if so, in what way. Two complementary measures of school resources are used in the analysis; per pupil spending and teacher density. We focus our analysis entirely on the compulsory school sector, since the objectives of efficiency and
1 The equalization grant system was not directed towards the schooling sector alone but towards
equality of opportunities are most vital at this level, compulsory school being the stepping stone for further education.
The following questions are analyzed: Did spending levels become more unequally distributed across municipalities in connection with the reforms? To what extent does the impact of local tax capacity on schooling resources differ before and after decentralization? This is clearly a relevant issue since, as ar-gued above, the drawback of decentralization is the risk of creating inequalities in school resources and thereby different prerequisites for pupils depending on where they attend school. What about grants: to what extent does it matter in what form (general or targeted) they are distributed? This is of interest, con-sidering that the construction of the Swedish grant system is constantly being changed. Finally, what is the impact of local preferences, and did it change in connection with the reforms? Theoretically, we would expect a more disparate pattern and a higher influence of local preferences in the decentralized regime, but the effects may be neutralized by the common curricula and the equalizing grants.
Employing a panel of local government data, we study the period 1989–95.2
This way we cover observations from both before and after the implementation of the key reforms without confounding decentralization with many other mi-nor changes in the schooling sector taking place after 1995.
There exists only one other quantitative study of the decentralization of the Swedish school system: Björklund, Edin, Fredriksson & Krueger (2004). They investigate whether the distribution of the teacher-pupil ratio changed follow-ing decentralization. Their primary focus is, however, on the effects of resource changes on student achievement.
This paper is organized as follows: in the next section the institutional back-ground and, specifically, the two different regimes are described. Section 3 gives an overview of earlier empirical literature on the effects of school finance reforms. Section 4 presents and describes the data. This is followed by a de-scription of the empirical setup and the ensuing results as well as some sensi-tivity analysis in section 5. Finally, section 6 gives some concluding remarks.
2 This period coincides to a large extent with the downturn in the Swedish business cycle. We
2 Institutional
background
Sweden’s system for organizing compulsory schooling was for a long time one of the most centralized ones in the OECD. Since the national reforms of the
early 1990s, it has been classified as being one of the most decentralized ones
(OECD, 1998). In this section we will describe the main features of the differ-ent school regimes. For a fuller description of the Swedish school system, see
e g Björklund et al (2004).
2.1
The centralized regime
3Prior to 1991, the Swedish school system was characterized by central govern-ment regulations and controls, centrally employed teachers and school leaders, and a system of central government grants that were targeted to specific catego-ries of school spending. The overriding objective was pupils’ equal access to education and to a certain standard of schooling irrespective of social back-ground or place of residence. A general system of equalization grants was used in order to compensate municipalities with high structural costs, such as sparsely-populated areas, and those with less than average tax capacity.
At the time, the county board of education assessed the local need for dif-ferent types of resources and set the size of the grants according to detailed formulas. Most of the grants were then distributed directly to the schools. The major parts of the grants to schooling were targeted towards teaching costs (50 percent), costs for special education/remedial teaching and extra-curricular activities (25 percent), and payroll tax expenses (16 percent), see Ds 1987:1 (only available in Swedish). The municipalities contributed with local income tax revenues to provide for school premises, textbooks and teaching aids, school lunches, school bussing, and costs for non-pedagogical staff such as counselors and school health services.
The grants to teaching were determined as a function of the allocation of pupils across schools, the number of teaching hours per pupil, and the wage costs for teachers. By construction, the targeted grant system determined the school organization, the teacher-student ratio as well as the number of teaching hours. Since teachers were central government employees, local governments
3 See, e g, Ds 1987:1 (only available in Swedish) for a background to and detailed description of
did not have the possibility to hire more teachers than allowed by the grants in order to, for example, increase teaching time or reduce class sizes. Grants were also to cover costs for substitute teachers, but not based on actual outlays, funds were allocated as a percentage of the number of teachers. To the extent that this amount did not cover the actual cost in a municipality, local revenues had to be used to cover additional hiring expenses.
During the two years preceding decentralization, 1989–90, the municipal grant dependence in school funding varied between 50 to 80 percent (Svenska Kommunförbundet, Skolöverstyrelsen & SCB, 1990, 1991). The municipalities also received targeted grants to finance their other activities, such as, e g, child care.
2.2
The decentralized regime
2.2.1 The 1991 reform: shifting responsibility to the local level4
Gradually, public sector efficiency became an important policy objective. It was considered necessary to deregulate the schooling sector to make it possible to better adjust to local conditions. Along with a general trend of public sector decentralization and deregulation, this formed the basis for the school reforms. On January 1, 1991, the formal responsibility for compulsory, upper secondary and adult education was transferred from the national to the local government level. At the same time, teachers and school leaders became municipal employ-ees. The role of the central government now became limited to setting the tional goals to be met by the municipalities and their schools and seeing to
na-tional evaluations being performed.5
Equality in education standards remained an important national objective. The central government was still to have the overall responsibility for seeing that the financial prerequisites of the various municipalities were as equal as possible. At the same time, it was realized that the municipal responsibility needed to be accompanied by a local capacity to affect and allocate schooling resources. This was done by abolishing the various grants targeted to specific school costs and by introducing in its place a single lump sum grant to the local
4 See Ds 1990:32 (only available in Swedish) for a description of the reasons for the 1991 reform
and the arguments behind the change in the grant system at this time.
5 In addition, a tax reform was undertaken in 1991. The purpose of this reform was to broaden
compulsory school sector as a whole. Thus, the grant system remained targeted but on a less detailed level than before. The size of the new grant was to a cer-tain extent based on the amount of grants received in the old. Thereafter, grants were to be adjusted according to local changes in the number of school-aged children.
This change meant that the municipalities became able to allocate compul-sory school resources as they saw fit. Also, as teachers were now municipal employees it became possible to adjust the teaching staff, either through
reallo-cations of existing resources or by adding local tax revenues to the grants.6
However, national regulations specifying the minimum amount of teaching time to be spent on different subjects remained.
2.2.2 The 1993 grant reform
A second step in public sector decentralization was taken only two years later when the overall system of central government grants was changed, something that consequently affected the school funding system as well. One aim of the reform was to make the responsibility at the local and national level, respec-tively, more clear. The reform, which took place in 1993, replaced the system of targeted central government grants to all municipal services (education, child and elderly care, social services and infrastructure) by a general lump sum grant. Thereby, local governments received considerably more flexibility also in their school spending decisions. In connection with this reform, the level of the grant was reduced. To avoid inequalities in municipal spending due to different structural conditions across municipalities a new grant system was formed, compensating municipalities with unduly high cost of providing ser-vices. Also this part of the grant system was of lump-sum character, leaving it up to the local governments to decide how to allocate funds between different municipal services. During this period (1993–95), grants from the national government constituted approximately 20 percent of total municipal revenues. Tax revenues made up approximately 50 percent.
As another way of obtaining some degree of equality in education across municipalities, the national government level retained the responsibility for
6 However, the local income tax rate could not be adjusted upwards during most of the period
under study due to a central government ceiling on local tax rates. Additional spending on schools through the use of local tax revenues could therefore mainly be implemented by reallo-cating resources from other local services.
formulating a common curriculum and educational goals that the local govern-ments were to achieve. Finally, note that even after decentralization took place, teacher wages continued to be determined through central negotiations that
were implemented nationwide.7
Another national reform that contributed to decentralization – but at the stu-dent and parent level – was the introduction of public funding to indepenstu-dent schools. Implemented in the second half of 1992, it greatly increased the oppor-tunities for students to choose another school – public or independent – than the one in the neighborhood. It also became easier to choose school in a
mu-nicipality different from the one where the student lived.8
Finally, it can be noted that the possibilities for municipalities to raise local revenues through an increase in the local income tax rate was temporarily re-stricted through national regulations 1991 through 1994. At the same time, the Swedish economy plunged into a deep recession in the first half of the 1990s which further enhanced the financial constraints of the local governments.
3
Empirical literature on the effects of
school finance reforms on school
resources
As far as we are aware of, there is only one previous quantitative study analyz-ing the effect of the Swedish decentralization on compulsory school resources:
Björklund et al (2004, ch 4). Their study differs from the one in this paper in
several ways; they focus on the teacher-pupil density alone, study a longer time period than we do (thereby being unable to separate the effects of the decen-tralization from other reforms undertaken after 1995), and they treat 1993 as
7 The wage level was a function of seniority. The maximum level was achieved after 18-23 years
of teaching. The wage level differed, however, between primary and secondary school teachers. The wage setting procedures for teachers did not allow for local and individual adjustments until 1996.
8 This created better financial prerequisites for, and a subsequent growth of, private schools
which in 1991 were situated in only 33 out of 288 municipalities. In 1992, the share of students attending a private school (in the home municipality or in another area) varied in between 0 and 7.8 percent across municipalities. By 1995, the private school share had increased to at most 9.6 percent. About 40 percent of the municipalities had, however, not yet any students attending pri-vate schools. See Ahlin (2003) for more information on the school choice reform.
the key date in the decentralization process rather than separating between the 1991 and 1993 reforms. Studying whether teacher resources changed in rela-tion to the 1993 grant reform, and whether such a change affected student
per-formance (grades in the final year of compulsory school)9, Björklund et al find
that the median teacher/pupil ratio decreased by 1.7 percentage points during the period 1990/1991 to 1999/00 but rebounded somewhat in the beginning of the 2000s. They also find a trend of widening differences in teaching resources, mainly at the bottom of the distribution. Regressing teacher density on the av-erage municipal income and comparing 2001 with the 1991–93 period, they conclude that decentralization seems to have had little effect on the relationship between schooling inputs and income but that municipalities seem to have changed positions in the distribution of resources over municipalities.
Just like Sweden, Chile decentralized part of the school finance system from the national to the local level. In addition, Chile, just like Sweden, has under-taken a school choice reform. Winkler & Rounds (1996) study the Chilean case. They compare the spending equality and cost-efficiency across rich and poor municipalities before and after the reform. The conclusion of their study is that spending inequality increased after decentralization, but that the effect on cost-effectiveness was ambiguous.
The school finance reforms that otherwise have been most analyzed in the literature are those implemented in the U S. Since the 1970s, all U S states have at some point reformed the school finance system to obtain more equal spend-ing across school districts. The background to these reforms is that many state courts have judged the school finance systems based on local property taxes unconstitutional due to the different financial prerequisites it gives for schools in rich (high per pupil property value) and poor (low per pupil property value) districts. This has forced states to undertake differently constructed reforms with the common denominator of increased reliance on state-level revenues to obtain less dispersion in district spending. Murray, Evans & Schwab (1998), among others, have investigated the effects of these reforms using school dis-trict data from a selection of U S states in a fixed effect model. Using a dummy to capture school finance reforms, they find that the centralization of schooling significantly decreased the degree of dispersion in school spending across
9 The effect of decentralization on school resources is only of the topics discussed in Björklund et
al. Other topics are e g equality and efficiency; skills and earnings; teacher supply and the conse-quences of school choice.
wealthy and poor districts. Furthermore, they find that this happened through “leveling-up”, i e through an increase in spending in the poorest districts but with an unchanged spending in the richest districts. Card & Payne (1998) study the effect of school finance reforms on the distribution of school spending across low and high income districts in California. More specifically they vestigate to which extent state revenues and total spending vary with family in-come. They find that districts where the existing financing system was found unconstitutional tended to adopt more equalizing funding formulas over the 1980s. But even in absence of court actions, legislatively-induced school fi-nance reforms that reduced or eliminated flat grants and enlarged the share of state funding based on the districts’ ability to pay led to equalization in many states. However, in many states inequality in local revenues per student wid-ened between richer and poorer districts, partially offsetting the equalizing
ef-fects of changes in state aid formulas.10 Other studies, such as Manwaring &
Sheffrin (1997) and Silva & Sonstelie (1995), use national level data to investi-gate the effect of finance reforms on mean spending. While Manwaring and Sheffrin find that spending has risen in connection with the reforms, Silva and Sonstelie, concentrating on California, find that school-spending decreased.
One problem the evaluator of the U S reforms faces, but that the Swedish evaluator does not, is that the reforms undertaken are very heterogeneous, something that has been pointed out by e g Hoxby (1998). The way districts and states finance schooling differs across states both before and after the re-forms. In the Swedish system this is not problematic since all municipalities faced the same institutional setting both before and after the reforms and the re-forms were homogenous across the country.
10 Card’s and Payne’s primary focus is on whether the reforms aiming at spending inequality had
any effect on the distribution of performance across students of different family background. Their findings indicate that students with a family background of low education tend to have higher academic achievement if attending school in a state where the inequality in spending has decreased.
4 Data
4.1
Choice of variables
This paper uses municipal data for the period 1989–95.11 The reason for
study-ing this time period is that we wish to allow for differential effects in connec-tion with the 1991 and 1993 reforms. Consistent school resource data can be obtained from 1989 onwards, which gives us two years of data from the cen-tralized regime. From 1996 onwards a number of smaller institutional changes
were undertaken.12 Extending the time period beyond 1995 would therefore
threaten to confound the effect of decentralization.
We use two different definitions of municipal compulsory school resources. The first is total spending per pupil attending compulsory public schools in the
municipality, excluding costs for premises and school transports.1314 Our
sec-ond dependent variable is teacher density; the number of full-time teachers per pupil. We argue that none of these two variables is to be preferred over the other, but that they reflect different aspects of school resources. Note that there is, by definition, a link between the two measures, where teacher density times
teacher wages is one of the components in spending per pupil.15
11 We have excluded six municipalities from the data; Nyköping, Borås, and Örebro since they
been involved in municipality splits during the studied period and therefore, are not comparable over time, and Gotland, Göteborg and Malmö since they handled activities that are normally the responsibility of a county, i e an aggregate of municipalities.
12 For example, in 1996 the construction of the equalization grant system changed and the
for-merly centralized wage bargaining system for teachers was replaced by an individualized one. Furthermore, the municipalities have received further responsibilities over time, and the use of targeted grants has increased.
13 Costs for premises are excluded since the principles for how to calculate these costs differs
ex-tensively over municipalities as well as over time. Costs for school transports are excluded, since there are no available data for 1992.
14 Total spending per pupil is available for practically all municipalities for the period 1992–95.
However, for 1989–91 reporting data was voluntary, and the variable is therefore missing for some municipalities. There may be a selection problem if the municipalities that did not report during these years are not random, but differ in some important aspect from those that did report. In order to investigate this, we have compared summary statistics for the two groups for 1992. Testing on the 5-percent level, we cannot reject the null hypothesis that the means are the same across the two groups. Results from these tests are reported in Table A2 in the Appendix. The t-test builds on equal variances in both groups. Comparing the distributions of variables in the two groups (see Figure A1 in the Appendix) we conclude that these are the same.
What variables can be expected to explain differences in local school re-sources? First, we take municipal income into account. Since it is likely that the
form that income enters in matters16 we control for the two types of local
in-come separately, using tax base and total intergovernmental grants (total tar-geted and general central government grants + equalization grants), respec-tively.
One of the purposes of this paper is to investigate whether decentralization has entailed increased inequality in schooling resources across municipalities of different tax capacities. If this has happened, we would see an increasing, positive impact of the local tax base on school resources over time. Since local government possibilities to use tax revenues to hire teachers was introduced in connection with the 1991 reform (when teachers became municipal employ-ees), we might expect the main change in the impact of tax base on teacher density to be visible in connection with this reform rather than from 1993 and ahead. Finally, given that grants were partly targeted up to the 1993 reform, we expect grants to have a greater impact on school spending these years than from 1993 onwards.
The second type of explaining variable is motivated by one of the main ar-guments for decentralizing publicly provided services; the assumption that lo-cal governments have better knowledge about lolo-cal preferences than the central government. We capture local preferences by using a political dummy
indi-cating whether the left-wing bloc has a majority in the municipal council17, and
by the share of inhabitants with higher education. Higher education could be both positively and negatively associated with stronger preferences for higher school spending and teacher density. Left-wing governments are typically as-sumed to prefer a larger public sector than right-wing governments, but whether this is true for school resources as well can be questioned. Therefore, we have no prediction about the signs of the preference variables but expect
them to matter more after the reforms than before. 18
16 This hypothesis is supported by the finding in Bergström, Dahlberg & Mörk (2004), showing
that median income has a different effect than grants on municipal labor demand. See also the literature discussing the flypaper effect, e g, Bailey & Connolly (1998).
17 Even though Sweden is a multi-party system, it is standard to treat Sweden as a bipartisan
sys-tem among political scientists and economists (see, e g, Alesina, Roubini & Cohen, 1997). The parties can be divided into a left-wing and a right-wing bloc.
18 The share of women in the local government, and the degree of political fragmentation are two
other possible ways of capturing local preferences for schooling. However, neither of these was found to be relevant and they were therefore left out of the model.
The 288 Swedish municipalities vary substantially in their structural char-acteristics, e g in terms of population density and population composition. As these are factors beyond municipal control, part of the grant program is in-tended to control and compensate for cost differences arising from such struc-tural differences. Assuming that the grant system does not succeed completely in this task, we include a third set of variables that measure local structural conditions. These are the population share of school-aged individuals, the share of school-aged children born abroad, and the number of households with school-aged children receiving welfare. We have no a-priori expectations about the sign of the first variable, but expect the next two to have a positive effect on per pupil spending and teacher density. Furthermore, the average number of
students per school is included in the analysis.19 We expect school size to have
a negative impact on both school spending and teacher density because of eco-nomics of scale.
Finally, in order to avoid omitted-variable bias, we control for time effects as well as municipality-specific fixed effects. We expect the fixed effects to
control for factors such as school competition.20 Unfortunately, it also controls
for municipality specific preferences that are constant over time. Definitions and summary statistics of the discussed variables are given in the Appendix.
4.2
The development of school resources
How have our two measures of school recourses evolved over time? This chap-ter will take a quick look at some descriptive statistics. We are mainly in-terested in whether something happened in 1991 when the responsibility for schooling was transferred to the municipalities and/or in 1993 when inter-governmental grants underwent a large reform. Are there any indications that school resources became more unevenly distributed following the decentrali-zation? If so, did this happen at the expense of poorer municipalities?
Starting with the first question, we try to answer this by illustrating our
re-source variables using Box-whisker plots21 and by calculating different
19 This variable captures also the population density in the municipality.
20 Björklund et al (2004) and Skolverket (2004) both estimate fixed effects models and conclude
that the change in private school competition has no significant effect on the change in local per pupil compulsory school costs.
21 The line in the middle of the box represents the median of data. The box itself constitutes the
interquartile range (IQR), that is, it extends from the 25th percentile of the data to the 75th. The
adja-tical measures of inequality.22 Figure 1 presents an overview of the
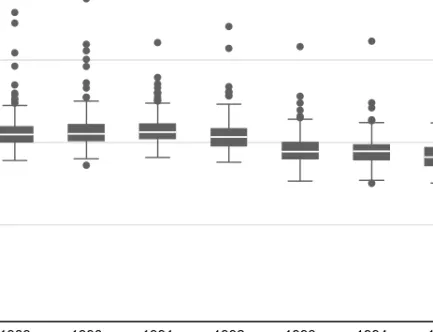
devel-opment of school spending 1989–95. As can be seen from the figure, spending per pupil decreased when the grant system was changed in 1993. This might be an effect of the reduction in total grants in connection with the reform; mean grant dropped, in real terms, from 12 800 in 1992 to 8 000 in 1995 (2001 prices). The variation in spending seems, if anything, to have decreased over time.
Figure 1 Per pupil compulsory school spending, 1989–95
0 20,000 40,000 60,000 80,000 1989 1990 1991 1992 1993 1994 1995
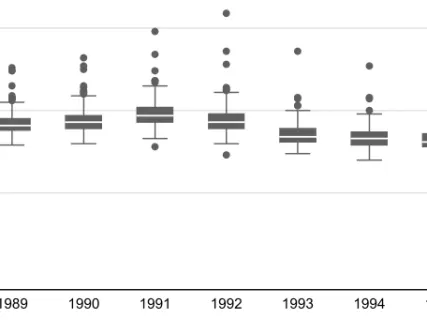
Figure 2 does the same for teacher density. If we compare the two figures we see that the patterns in the two measures are very much the same: the level as well as the variation seems to decrease over time.
cent values. The upper adjacent value is defined as the largest data point less than or equal to the 75th percentile + 1.5*IQR and the lower adjacent value is defined as the smallest data point
greater than or equal to the 25th percentile - 1.5*IQR. Observed data points more extreme than
the adjacent values are individually plotted.
22 We have chosen to study a balanced panel, so that the different number of observations across
time does not cause differences in variation. In the estimations we will use all available data and hence use an unbalanced panel.
Figure 2 Teacher density in compulsory school, 1989–95 0 5 10 15 20 1989 1990 1991 1992 1993 1994 1995
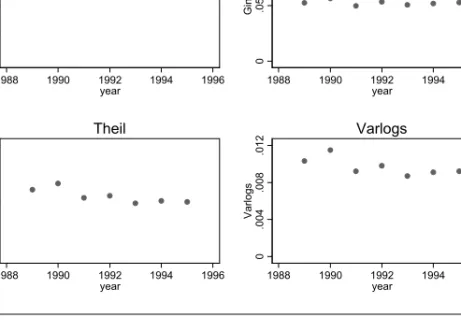
In order to get a clearer picture we have also calculated a number of different statistics describing the variation in school resources and investigated how these have changed over time. The measures we have chosen are the coefficient of variation (CV), the Gini-coefficient, the Theil entropy measure, and the
vari-ance of logs.23 Higher values on the statistics mean that spending/teacher
den-sity is more unequally distributed. The graphs in Figure 3 show that, if
any-thing, inequality of spending has decreased over time, making the municipali-ties more similar in terms of compulsory education spending per pupil, in con-trast to expectations. The same pattern, even more pronounced, is illustrated in
Figure 4 for teacher density. The variation in both variables is, however, quite low to begin with (for example, the Gini coefficient is never higher than 0.056).
23 The coefficient of variation is calculated by dividing the standard deviation of a variable with
its mean. For formulas of the Gini coefficient and Theil’s entropy measures see, e g, Mills & Zandvakili (1997). The calculations are performed in Stata SE8.
Figure 3 Different measures of the variation in school spending per pupil 0 4 8 12 16 CV 1988 1990 1992 1994 1996 year CV 0 .05 .1 Gini 1988 1990 1992 1994 1996 year Gini 0 .005 .01 T heil 1988 1990 1992 1994 1996 year Theil 0 .004 .008 .012 V arlogs 1988 1990 1992 1994 1996 year Varlogs
Figure 4 Different measures of the variation in teacher density
0 4 8 12 16 CV 1988 1990 1992 1994 1996 year CV 0 .05 .1 Gini 1988 1990 1992 1994 1996 year Gini 0 .005 .01 T heil 1988 1990 1992 1994 1996 year Theil 0 .004 .008 .012 V arlogs 1988 1990 1992 1994 1996 year Varlogs
Even if the variation in school resources did not change much in connection with the reforms, it could still be the case that the set of municipalities in the upper and the lower end of the school resource distribution shifted after
re-form.24 Our interest is in whether inequality increased in terms of a greater gap
in school resources between municipalities of different tax capacities. There-fore, let us for each year relate the schooling resources in municipalities
be-longing to the 95th percentile of the tax base distribution to those in the 5th
per-centile. Figure 5 reports the annual development of this ratio. Contrary to what
is typically expected, the municipalities in the lower-most part of the income
distribution tend to have higher spending and more teachers per pupil than the higher-income municipalities after 1991. In fact, the spending ratio pattern re-versed immediately following decentralization. After 1993, the low income municipalities still spend relatively more on schooling than the richer ones al-though the degree of inequality has decreased (the spending ratio of rich rela-tive to poor municipalities is closer to one). Remember, however, that these calculations do not control for structural conditions, which might be the reason for the observed pattern. In order to investigate this, we will continue with re-gression analysis in the next section.
24 For example, Björklund et al (2004) conclude that the decentralization had the effect of
Figure 5 Ratio of compulsory school resources: municipalities in the 95th percentile relative to the 5th percentile of the tax base distribution
0 .5 1 1.5 spending/teacherdensity 1988 1990 1992 1994 1996 year spending teacherdensity
5
Did decentralization cause structural
shifts in school resources?
5.1 Model
specification
and empirical strategy
Since our purpose is to investigate the effects of structural changes in connec-tion with the decentralizaconnec-tion reforms, we focus on three time periods that cover the two reform years; 1989–90, 1991–92, and 1993–95.
Our approach is to estimate the following type of fixed effect interaction model:
(1)
y
mt=
(
D
1x
mt)
δ
1+
(
D
2x
mt)
δ
2+
(
D
3x
mt)
δ
3+
υ
m+
υ
t+
ε
mtThe dependent variable, ymt, denotes compulsory schooling resources in
municipality m in year t. The vector of independent variables, x includes the
three sets of variables described in the data section above. A year-specific
included. Interaction terms are created through the dummy variablesD1,D2,
and
D
3 which equal one for the years 1989–90, 1991–92, and 1993–95,re-spectively, and zero otherwise. Thus, the estimated parameter δ1 will capture
the impact of x on school resources prior to decentralization, δ2 the impact
af-ter decentralizing the responsibility for schooling, and
δ
3 the impact followingthe introduction of general grants. Finally,
ε
mt is an independently andiden-tically distributed error term with mean equal to zero and a constant variance,
2
ε
σ
. We thus identify the parameters using within as well as betweenmunici-pality reform variations.
Our empirical strategy for investigating whether there are structural shifts related to the decentralization reforms in 1991 and 1993 is to use a multi-step procedure. In the first step, the fully interacted model in equation (1) is
esti-mated. For each regressor in x we test whether the resulting parameter
esti-mates are equal across the three time-periods. In the second step, we estimate the more parsimonious model in which the parameter estimates are either equal across time or different across all three periods in accordance with the results from the preceding F-tests. The resulting parameter estimates are now tested for being equal across the two first and the two last periods, respectively. This is to account for that the key reform year might differ among the regressors. For example, it is reasonable to expect grants to change in impact following the
1993 reform, rather than the 1991 reform.25 But in the same way it could be
ar-gued that 1991 is the important year with respect to the impact of the tax base. Remember that it was this reform that gave municipalities discretion to in-crease its local teaching resources for those who wished to use local tax reve-nues for this purpose. In the third and final stage, we estimate the specification following from the preceding testing-procedure and build our conclusions on that model. The final model will hence depend on a number of pretests. Pre-testing adds an additional element of uncertainty to most problems of statistical inference: the chosen significance level in the pretest matters for the final re-sults. However, as stated by Davidson & MacKinnon (1993) there is often not much we can do about it. The problem should however be bore in mind.
25 Björklund et al (2004) argue, for example, that 1993 was the only relevant year for when
5.2 Results
In this section we present the estimation results for school spending per pupil and teacher density one at the time. The results from the third stage of the
esti-mation procedure described above are reported in this section (Tables 2 and 4).
The estimated parameters of the first two steps are given in the Appendix (
Ta-bles A3 and A4).
5.2.1 Per pupil spending
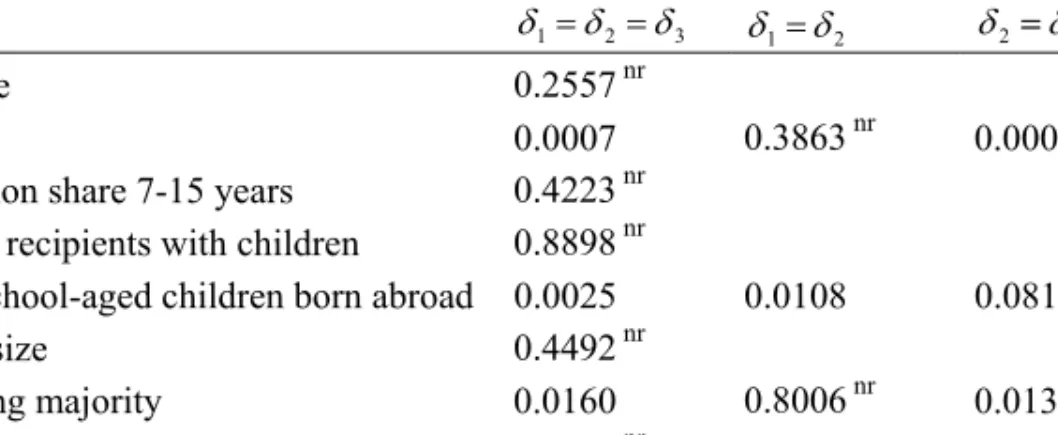
Starting with per pupil spending, the test of equal parameter estimates across
all three periods is summarized in Table 1. A p-value below 0.10 indicates that
we can reject the null on the ten percent level.
Table 1 Test of equal parameter estimates: per pupil spending 26
Variable Prob > F 3 2 1 δ δ δ = = δ1=δ2 δ2=δ3 Tax base 0.2557 nr Grants 0.0007 0.3863 nr 0.0002
Population share 7-15 years 0.4223 nr
Welfare recipients with children 0.8898 nr
Share school-aged children born abroad 0.0025 0.0108 0.0813
School size 0.4492 nr
Left-wing majority 0.0160 0.8006 nr 0.0134
Population share with higher education 0.1903 nr
Note:nr denotes that we cannot reject the null of equal parameters on the ten percent
level
From the first column of the table we see that the null of equal parameters can be rejected for three regressors; grants, share of school-aged children born abroad, and left-wing majority. We thus continue by estimating the resulting, more restricted, model and testing the null that the parameter estimates are the same for the two earlier time-periods (the second column) and the two latter
(the third column). In Table 1 we see that for the first two periods, we can
re-ject the null only for the share of school-aged children born abroad. For the
ter period, we reject the null of equal parameters for all three variables. Hence,
it seems like 1993 is the important reform year, as argued by Björklund et al
(2004). We chose a preferred model in accordance with these results, i e we al-low only the parameters for which we rejected the null to differ across time.
Results from estimating the preferred model are given in Table 2.
Starting with local income we see that the tax base is insignificant during the whole period. There is hence no evidence supporting the view that the richer the municipality is, the more does it spend on schooling, or that this pat-tern has become more pronounced in connection with the decentralization of the school sector. Turning next to grants, we see that it has a positive and sig-nificant effect on spending before the 1993 general grant reform, but enters in-significantly after the reform. Since grants were targeted to school-spending only prior to 1993, this finding is in accordance with expectations.
The first of the two parameters with which we attempt to capture local pref-erences – the political bloc enjoying a majority in the local government – dif-fers significantly over time in its impact on school spending. During the period with targeted grants a left-wing majority is negatively associated with school spending. The statistical significance is on the one percent level. In the decen-tralized period with general grants this variable does, however, not have any significant impact. This is perhaps odd, since we would expect local prefer-ences to be more important the more decentralized the system is. One ex-planation for this result could be that the political variable exerts little variance over time (elections were only held in 1991 and 1994) across municipalities and is mainly captured by the fixed effects. Another potential explanation is that municipalities were not able to adjust spending as they would have liked due to the economic downturn. The second parameter with which we attempt to capture local preferences is the share of the population with higher education. This variable turns out to be insignificant and we can not reject the null of equal (zero) impact across time periods.
Looking at the control variables we find that, in line with our expectations, a higher share of foreign citizens in the school-aged population tends to increase spending. Over the three time periods, this impact declines but remains statisti-cally significant on a one percent level throughout. Furthermore, we find that the higher the share of school-aged children in the population the lower is per-pupil spending. Likewise, the larger the average school size, the lower is spending. Both these associations are stable over time. That municipalities with larger schools tend to spend less per pupil than those with smaller schools
makes sense. For example, one could suspect that areas with a low population density will tend to require more schools per pupil in order to avoid unreason-able travel times to school.
Table 2 Fixed effect estimation: per pupil spending
Variable Estimate (std err) Tax base 1989–95 -1.642 (3.557) Grants 1989–92 0.214*** (0.053) 1993–95 0.071 (0.049)
Population share 7-15 years 1989–95 -1061.93***
(215.58)
Welfare recipients with children 1989–95 -2261.41
(3665.02) Share school-aged children born
abroad 1989–90 426.331 *** (77.775) 1991–92 324.669*** (76.142) 1993–95 261.215*** (76.763) School size 1989–95 -13.808*** (3.758) Left-wing majority 1989–92 -626.203** (265.039) 1993–95 111.504 (273.340)
Population share with higher education 1989–95 -151.570
(124.973)
Time dummies Yes
No of obs 1763
R-sq: within 0.6594
Between 0.3355
Overall 0.4514
Note: A Hausman test rejected a random model in favor of a fixed
effects-model. Standard errors are given within parenthesis. *** denotes statistical significance at the one percent level, ** at the five percent level, and * at the ten percent level.
5.2.2 Teacher density
Next, we have approached the teacher density variable the same way as the spending variable. Hence, we start by testing for equality of parameters over
time. Table 3 presents these results. For teacher density, as opposed to per pupil
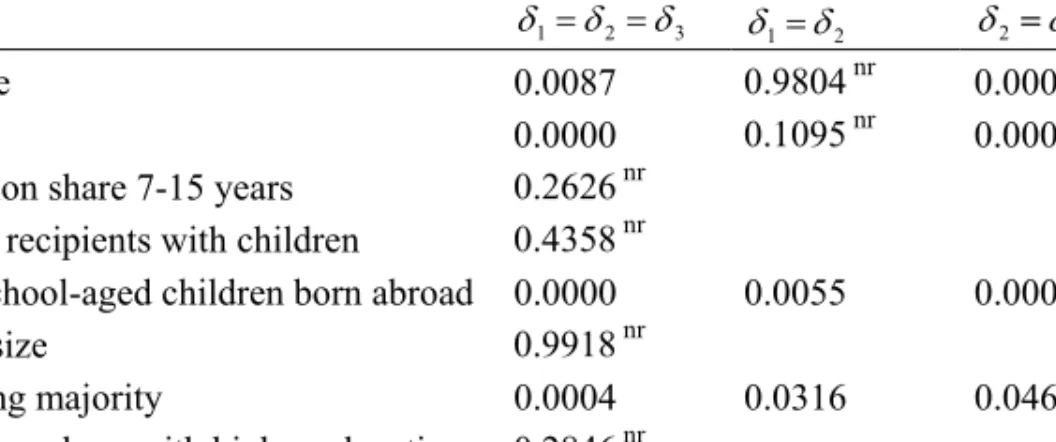
spending, the local tax base has different effects before and after the grant-reform of 1993. The same pattern is found for grants. In addition, both the share of immigrant school-aged children and the left-wing majority exert a sig-nificantly different impact on teacher density across all three time periods.
Hence, although similar to the results in Table 1, there are some differences in
what constitutes the key reform year.
Table 3 Tests of equal parameter estimates: teacher density 27
Variable Prob > F 3 2 1 δ δ δ = = δ1=δ2 δ2=δ3 Tax base 0.0087 0.9804 nr 0.0000 Grants 0.0000 0.1095 nr 0.0000
Population share 7-15 years 0.2626 nr
Welfare recipients with children 0.4358 nr
Share school-aged children born abroad 0.0000 0.0055 0.0000
School size 0.9918 nr
Left-wing majority 0.0004 0.0316 0.0464
Population share with higher education 0.2846 nr
Note:nr denotes that we cannot reject the null of equal parameters on the ten percent
level.
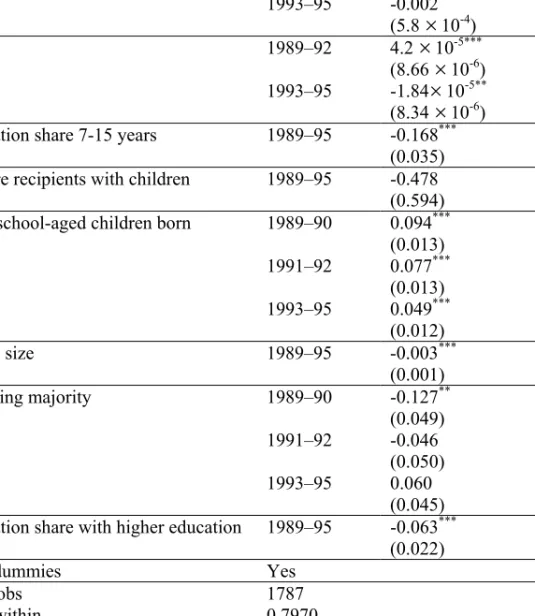
Table 4 Fixed effects estimations: teacher density Variable Estimate (std err) Tax base 1989–92 -7.20
×
10-4 (6.04×
10-4 1993–95 -0.002*** (5.8×
10-4) Grants 1989–92 4.2×
10-5*** (8.66×
10-6) 1993–95 -1.84×
10-5** (8.34×
10-6)Population share 7-15 years 1989–95 -0.168***
(0.035)
Welfare recipients with children 1989–95 -0.478
(0.594) Share school-aged children born
abroad 1989–90 0.094*** (0.013) 1991–92 0.077*** (0.013) 1993–95 0.049*** (0.012) School size 1989–95 -0.003*** (0.001) Left-wing majority 1989–90 -0.127** (0.049) 1991–92 -0.046 (0.050) 1993–95 0.060 (0.045)
Population share with higher education 1989–95 -0.063***
(0.022)
Time dummies Yes
No of obs 1787
R-sq: within 0.7970
between 0.2690
overall 0.4723
Note: A Hausman test rejected a random model in favor of a fixed
effects-model. Standard errors are given within parenthesis. *** denotes statistical significance at the one percent level, ** at the five percent level, and * at the ten percent level.
Table 4 presents the result from the preferred teacher density model. There we can see that the local tax base matters to a statistically significant extent after 1993 (in the fully decentralized period) but not before. However, contrary to what we should expect, this impact is negative. That is, the lower the income in
the municipality is, the higher the teacher density is, even after controlling for structural conditions and preferences following the 1993 reform. This is in line
with the descriptive statistics in Figure 5. Grants seem to have a positive effect
before the grant reform – a result that we found in our analysis of per pupil spending as well – but a statistically negative effect after the reform. Note, however, that the parameter estimates for both tax base and grants are very small. Although statistically significant, the economic impact thus seems to be negligible.
Neither the dummy for a left-wing majority or the population share with higher education indicate that local preferences have had a larger impact on teacher density following full decentralization. In fact, the political parameter is negative contrary to expectations. Also the parameter for the population share with higher education is negative in sign. This might simply suggest that chil-dren with highly educated parents tend to receive more support with school work at home, and therefore require fewer teachers per student.
In line with the results above, a higher share of foreign citizens in the school-aged population tends to increase teacher density. Over the three time periods, this impact declines but remains statistically significant on a one per-cent level throughout. As before, we find that the higher the share of school-aged children in the population the smaller is teacher density with no marked difference over time. Likewise, the larger the average school size, the lower is teacher density.
5.3 Sensitivity
analysis
5.3.1 Does the economic recession matter?
An identifying assumption in the analysis above is that there are no within mu-nicipality differences in time trends. However, the reforms coincide with a deep recession with increased unemployment. It is likely that this economic
downturn hit different municipalities different.28 If, at the same time, the
reces-sion affected school resources as well as some of the regressors, this would cause a bias in the estimated parameters. We check whether this affects the es-timates obtained in section 5.2. by including municipal unemployment as an additional regressor. Estimating and testing in the same way as above leads us
to the preferred models presented in Table 6 (per pupil spending) and Table 7
28 Effects of the economic downturn that are homogenous across municipalities are accounted for
(teacher density). Results from the F-tests are presented in Table 5 and the
pre-ceding estimations in Tables A5 and A6 in Appendix.
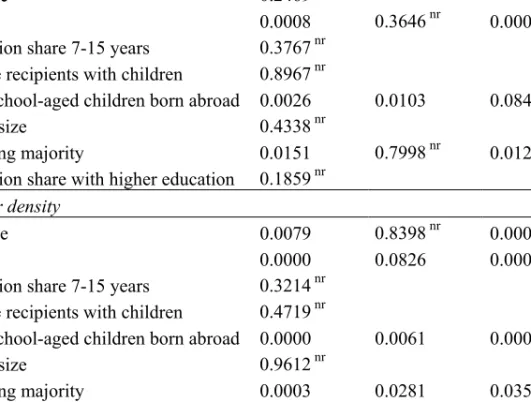
Table 5 Tests of equal parameter estimates, controlling for unemployment 29
Variable Prob > F
Per pupil spending δ1=δ2=δ3 δ1=δ2 δ2=δ3
Tax base 0.2469 nr
Grants 0.0008 0.3646 nr 0.0003
Population share 7-15 years 0.3767 nr
Welfare recipients with children 0.8967 nr
Share school-aged children born abroad 0.0026 0.0103 0.0843
School size 0.4338 nr
Left-wing majority 0.0151 0.7998 nr 0.0129
Population share with higher education 0.1859 nr
Teacher density
Tax base 0.0079 0.8398 nr 0.0000
Grants 0.0000 0.0826 0.0000
Population share 7-15 years 0.3214 nr
Welfare recipients with children 0.4719 nr
Share school-aged children born abroad 0.0000 0.0061 0.0000
School size 0.9612 nr
Left-wing majority 0.0003 0.0281 0.0354
Population share with higher education 0.2690 nr
Note:nr denotes that we cannot reject the null of equal parameters on the ten percent
level.
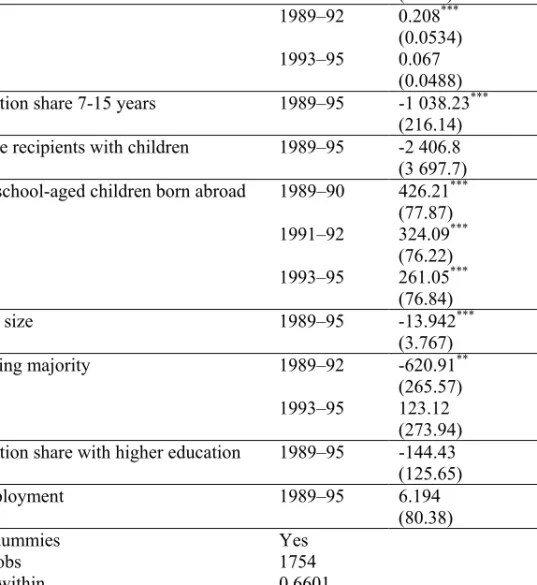
Table 6 Fixed effect estimation controlling for unemployment: per pupil spending
Variable Estimate (std err) Tax base 1989–95 -1.890 (3.577) Grants 1989–92 0.208*** (0.0534) 1993–95 0.067 (0.0488)
Population share 7-15 years 1989–95 -1 038.23***
(216.14)
Welfare recipients with children 1989–95 -2 406.8
(3 697.7)
Share school-aged children born abroad 1989–90 426.21***
(77.87) 1991–92 324.09*** (76.22) 1993–95 261.05*** (76.84) School size 1989–95 -13.942*** (3.767) Left-wing majority 1989–92 -620.91** (265.57) 1993–95 123.12 (273.94)
Population share with higher education 1989–95 -144.43
(125.65)
Unemployment 1989–95 6.194
(80.38)
Time dummies Yes
No of obs 1754
R-sq: within 0.6601
between 0.3088
overall 0.4474
Note: A Hausman test rejected a random model in favor of a fixed
effects-model. Standard errors are given within parenthesis. *** denotes statistical significance at the one percent level, ** at the five percent level, and * at the ten percent level.
Table 7 Fixed effects estimations, controlling for unemployment: teacher density Variable Estimate (std err) Tax base 1989–92 -8.37
×
10-4 (6.06×
10-4) 1993–95 -0.0022*** (5.80×
10-4) Grants 1989–90 5.46×
10-5*** (1.15×
10-5) 1991–92 3.94×
10-5*** (8.74×
10-6) 1993–95 -1.68×
10-5** (8.46×
10-6)Population share 7-15 years 1989–95 -0.157***
(0.035)
Welfare recipients with children 1989–95 -0.411
(0.598) Share school-aged children born
abroad 1989–90 0.094 *** (0.013) 1991–92 0.075*** (0.012) 1993–95 0.048*** (0.012) School size 1989–95 -0.003*** (0.001) Left-wing majority 1989–90 -0.146*** (0.050) 1991–92 -0.033 (0.051) 1993–95 0.068 (0.045)
Population share with higher education 1989–95 -0.068***
(0.022)
Unemployment 1989–95 -0.014
(0.013)
Time dummies Yes
No of obs 1780
R-sq: within 0.7983
between 0.2512
overall 0.4632
Note: A Hausman test rejected a random model in favor of a fixed
effects-model. Standard errors are given within parenthesis. *** denotes statistical significance at the one percent level, ** at the five percent level, and * at the ten percent level.
Controlling for unemployment, the results remain very much the same as those reported for the preferred models in section 5.2. The one difference relates to the importance of the 1991 reform. The association between grants and teacher density now shows a statistically significant heterogeneity across all three peri-ods. The effect is most prominent in the centralized period, significant positive during 1991–92 and negative from 1993 onwards.
5.3.2 Sluggish adjustment to reforms
Thus far we have assumed that the municipalities adjust their behavior directly in response to institutional changes. However, changes may take time. It is therefore possible that effects of the 1991-reform do not turn up in our data un-til 1993. We check this by focusing on the two years before the first reform and the two years after the second reform, respectively (dropping the time period
1991–93). 30 The two-period version of equation (1) is given by
(2)
y
mt=
(
T
1x
mt)
γ
1+
(
T
2x
mt)
γ
2+
γ
3z
mt+
υ
m+
υ
t+
ξ
mtwhere T1 is a dummy for the centralized period (1989–90) and T2 the
corre-sponding dummy for the years after full decentralization has been implemented
(1994–95). ztm denotes unemployment in municipality m in year t.31 We start by
estimating equation (2) and, for each regressor, test if
γ
1 =γ
2.32 Results fromthese tests are shown in Table 8. The results are the same as before with the
two exceptions: Tax base has a homogenous impact on teacher density over
time (but the p-value is 0.12 and the null is thus almost rejected at the ten
30 An alternative approach would be to estimate a dynamic model. However, avoiding
inconsis-tent estimates in such a specification would require taking the first difference and instrumenting along the line suggested by Andersson & Hsiao (1981). Doing this, two years of observations will be lost. Hence, because of the data restrictions it will not be possible to estimate any parame-ters from the centralized period.
31 Since it is likely that differences in municipality specific time trends are even more important
to control for in the two-period analysis, we have chosen to include local unemployment rate in these estimation.
32 An alternative interpretation of what we do is that we see the reforms as one and therefore
compare the fully centralized regime (before 1991) with the fully decentralized regime (after 1993).
cent level) and the population share of school-aged children now shows a het-erogeneous impact for spending per pupil.
The estimates of the now preferred models are reported in Table 9 and
Ta-ble 10. The qualitative results for total spending per pupil are very similar to the three-period specification. One important difference is, however, the nega-tive association between local tax base and school spending which is statisti-cally significant. For teacher density grants are no longer negatively significant during the latter period.
To conclude, the results from this section do not change our above conclu-sions about the effect of decentralization in terms of a heterogeneous associa-tion between various regressors and school resources before and after reform. Allowing for sluggish adjustment seems, however, to accentuate the link be-tween tax base and school resources more, but in the opposite direction of what is typically expected.
Table 8 Tests of equal parameter estimates, two periods
Prob > F
Per pupil spending Teacher density
2 1
γ
γ
=γ
1 =γ
2Tax base 0.2325 nr 0.1177 nr
Grants 0.0007 0.0000
Population share 7-15 years 0.0429 0.0198
Welfare recipients with children 0.6896 nr 0.3233 nr
Share school-aged children born abroad 0.0016 0.0000
School size 0.1196 nr 0.6859 nr
Left-wing majority 0.0187 0.0003
Population share with higher education 0.2560 nr 0.3195 nr
Note:nr denotes that we cannot reject the null of equal parameters on the ten percent
Table 9 Fixed effects estimations, two periods: per pupil spending Variable Estimate (st err) Tax base 1989–99, 1994–95 -12.732 ** (6.127) Grants 1989–90 0.208* (0.110) 1994–95 -0.0063 (0.0878)
Population share 7-15 years 1989–90 -905.77***
(292.61)
1994–95 -574.28
(350.99)
Welfare recipients with children 1989–99,
1994–95
-3 600.42 (5 525.14)
Share school-aged children born abroad 1989–90 320.27***
(102.09) 1994–95 131.63 (106.41) School size 1989–99, 1994–95 -15.010*** (5.333) Left-wing majority 1989–90 -1 276.79*** (430.19) 1994–95 -135.22 (384.79)
Population share with higher education 1989–99,
1994–95
-21.839 (161.79)
Unemployment 1989–99, 1994–95 120.98 (116.32)
Time dummies Yes
No of obs 963
R-sq: within 0.7015
between 0.2042
overall 0.3835
Note: A Hausman test rejected a random model in favor of a fixed
effects-model. Standard errors are given within parenthesis. *** denotes statistical significance at the one percent level, ** at the five percent level, and * at the ten percent level.
Table 10 Fixed effects estimations, two periods: teacher density Variable Estimate (std err) Tax base 1989–90, 1994–95 -0.00394 ** (0.00101) Grants 1989–90 9.12
×
10-5*** (1.83×
10-5) 1994–95 1.77×
10-5 (1.45×
10-5)Population share 7-15 years 1989–90 -0.153***
(0.0479)
1994–95 -0.0468
(0.0576)
Welfare recipients with children 1989–99,
1994–95
-0.852 (0.896)
Share school-aged children born abroad 1989–90 0.0859*** (0.0166)
1994–95 0.0239 (0.0173) School size 1989–99, 1994–95 -0.00305 *** (0.000869) Left-wing majority 1989–90 -0.1852*** (0.0705) 1994–95 0.0451 (0.0636)
Population share with higher education 1989–99,
1994–95 -0.0702 (0.0267)
Unemployment 1989–99, 1994–95
0.0210 (0.0191)
Time dummies Yes
No of obs 977
R-sq: within 0.7712
between 0.2277
overall 0.3600
Note: A Hausman test rejected a random model in favor of a fixed
effects-model. Standard errors are given within parenthesis. *** denotes statistical significance at the one percent level, ** at the five percent level, and * at the ten percent level.
6
Concluding comments and
discus-sions
In this paper, we have analyzed how the decentralization of the Swedish school sector affected the allocation of local school resources. Just looking at data over the period 1989–95, which covers observation from before and after the key reform years without confounding for various institutional changes after 1995, it seems like the variation in school spending and teacher density
de-creased following decentralization. The descriptive analysis of the Swedish
case is thus contrary to both the U S and the Chilean evidence, but in line with
those in Björklund et al (2004). It is also opposed to what one would have
ex-pected from basic fiscal-federalism literature. One potential explanation for the decreased variation could be strategic interaction; given that local politicians know that they will be held accountable for their decisions after the de-centralization they may not want to deviate too much from the their neighbor-ing municipalities. Also, the early 1990s was a period with a downturn in the economic business cycle. Given that the municipalities met worse economic conditions when grants from the central government decreased at the same time as they were not allowed to raise taxes, they may have been unable to increase spending and personnel above the minimum standards. This would mean that local preferences, costs and needs didn’t have the impact the municipalities would have liked them to have.
Turning to the regression analysis, we start by concluding that local income does not seem to matter more after the decentralization than before. The local tax base has no effect on per pupil spending neither before, nor after the re-forms. For teacher density the effect is insignificant up to the 1993 grant reform and negative thereafter. Hence, the fears that pupils attending school in low in-come municipalities would be disadvantaged by the reforms do not seem to have been fulfilled. Sweden hence seems to have avoided one potential draw-back of decentralization. Grants have a positive, significant impact before the reforms, but an insignificant (or even negative) impact after the reforms. These
results are in line with Bergström et al (2004) who find that grants have a
lar-ger effect on municipal labor demand before the 1993-grant reform than after. Given that the central government wants to influence school resources, our re-sults indicate that it should use targeted rather than general grants.
It is a bit surprising that local income (grants as well as tax base) has such a low impact on school spending and teacher density. However, the same result
is found in several other studies: Dahlberg & Mörk (2005) find insignificant ef-fects of grants and tax base when studying municipal labor demand over the
period 1990–2002. Also, Bergström et al (2004) find very small effects of
grants on municipal labor demand before as well as after the 1993-grant re-form, studying the period 1988–95. Using survey data when estimating the in-dividual demand for local public schooling in Sweden, also Ahlin & Johansson (2001) find an insignificant effect of grants. The low impact of tax base could be an indication of equalizing grants having succeeded in equalizing income.
Finally, looking at local preferences we find that if anything, they matter less after the decentralization than before. We are, however, unwilling to draw any strong conclusions given the small variation in the political dummy and the fact that when controlling for fixed effect we capture the between-variation in local preferences.
Taken together, our results indicate that not much happened when the school sector was decentralized. Our results thus show that it is possible to de-centralize schooling without making municipalities more sensitive to local in-come, given that decentralization is combined with an ambitious equalizing grant system and a common curriculum. It could however be the case that the allocation of school resources has become more efficient after the reforms. We hence need more research focusing on efficiency aspects to better understand the reforms. This is however not trivial. Studying the allocation of resources within the school sector could be one way of doing this.
References
Ahlin, Å (2003) “Does School Competition Matter? Effects of a Large-Scale School Choice Reform on Student Performance.” Working Paper 2003:2, De-partment of Economic, Uppsala University.
Ahlin, Å & E Johansson (2001) “Individual Demand for Local Public
School-ing: Evidence from Swedish Survey Data” International Tax and Public
Fi-nance, vol 8, pp 254-271.
Alesina, A, N Roubini & G Cohen (1997) Political Cycles and the
Macroecon-omy, MIT Press, Cambridge.
Andersson & Hsiao (1981) “The Estimation of Dynamic Models with Error
Components” Journal of the American Statistical Association, vol 76, pp
598-606.
Bailey S J & S Connolly (1998) “The Flypaper Effect: Identifying Areas for
Further Research” Public Choice, vol 95, pp 335-361.
Bergström P, M Dahlberg & E Mörk (2004) “The Effect of Grants and Wages
on Municipal Labour Demand” Labour Economics, vol 11, pp 315-334.
Björklund, A, Edin, P-A, Fredriksson, P & Krueger, A (2004), Education,
equality and efficiency – An analysis of Swedish school reforms during the
1990s, Report 2004:1, Institute for Labour Market Policy Evaluation, Uppsala.
Boadway R & E Mörk (2004) “Division of Powers”, in P Molander (eds)
Fis-cal Federalism in Unitary States, Kluwer Academic Publishers.
Card, D & A A Payne (2002) “School Finance Reform, the Distribution of
School Spending and the Distribution of SAT Scores” Journal of Public
Eco-nomics, vol 83, pp 49-82.
Dahlberg, M & E Mörk (2005) “Public Employment and the Double Role of