Panos Vassiliadis
Knowledge and Data Base Systems Laboratory Computer Science Division
Department of Electrical and Computer Engineering National Technical University of Athens
Zographou 157 73, Athens, GREECE
Ph.D. Thesis
NATIONAL TECHNICAL UNIVERSITY OF ATHENS
ZOGRAPHOU 157 73, ATHENS, GREECE
Data warehouses can be defined as ‘subject-oriented’, integrated, time-varying, non-volatile collections of data that is used primarily in organizational decision making. Nowadays, data warehousing became an
important strategy to integrate heterogeneous information sources in organizations, and to enable On-Line Analytic Processing (OLAP). Unfortunately, neither the accumulation, nor the storage process, seem to be completely credible. For example, it has been suggested in the literature that more than $2 billion of U.S. federal loan money have been lost because of poor data quality at a single agency, that manufacturing companies spent over 25% of their sales on wasteful practices, a number which came up to 40% for service companies.
The question that arises, then, is how to organize the design, administration and evolution choices in such a way that all the different, and sometimes opposing, quality user requirements can be simultaneously satisfied. To tackle this problem, this thesis contributes as follows:
The first major result that we present is a general framework for the treatment of data warehouse metadata in a metadata repository. The framework requires the classification of metadata in at least two instantiation layers and three perspectives. The metamodel layer constitutes the schema of the metadata repository and the metadata layer the actual meta-information for a particular data warehouse. The perspectives are the well known conceptual, logical and physical perspectives from the field of database and information systems. We link this framework to a well-defined approach for the architecture of the data warehouse from the literature. Then, we present our proposal for a quality metamodel, which builds on the widely accepted Goal-Question-Metric approach for the quality management of information systems. Moreover, we enrich the generic metamodel layer with patterns concerning the linkage of (a) quality metrics to data warehouse objects and (b) of data warehouse stakeholders to template quality goals. Then, we go on to describe a metamodel for data warehouse operational processes. This metamodel enables data warehouse management, design and evolution based on a high level conceptual perspective, which can be linked to the actual structural and physical aspects of the data warehouse architecture. This metamodel is capable of modeling complex activities, their interrelationships, the relationship of activities with data sources and execution details.
The ex ante treatment of the metadata repository is enabled by a full set of steps, i.e., quality question, which constitute our methodology for data warehouse quality management and the quality-oriented evolution of a data warehouse based on the architecture, process and quality metamodels. Our approach extends GQM, based on the idea that a goal is operationally defined over a set of questions. Thus, we provide specific “questions” for the full lifecycle of a goal: this way the data warehouse metadata repository is not simply defined statically, but it can be actually exploited in a systematic manner.
Special attention is paid to a particular part of the architecture metamodel, the modeling of OLAP databases. To this end, we first provide a categorization of the work in the area of OLAP logical models by surveying some major efforts, including commercial tools, benchmarks and standards, and academic efforts. We also attempt a comparison of the various models along several dimensions, including representation and querying aspects. Our contribution lies in the introduction a logical model for cubes based on the key observation that a cube is not a self-existing entity, but rather a view over an underlying data set. The proposed model is powerful enough to capture all the commonly encountered OLAP operations such as selection, roll-up and drill-down, through a sound and complete algebra. We also show how this model can be used as the basis for processing cube operations and provide syntactic characterizations for the problems of cube usability.
Finally, this thesis gives an extended review of the existing literature on the field, as well as a list of related open research issues.
Chapter 1: Introduction
1. DESCRIPTION 1.1
2. QUALITY AND DATA WAREHOUSES 1.3
3. FRAMEWORK AND MOTIVATION FOR RESEARCH 1.4
4. ROADMAP FOR THE REST OF THE DOCUMENT 1.6
Chapter 2: Architecture and Quality Metamodels
1. INTRODUCTION 2.1
1.1 STATE OF THE ART IN METADATA MANAGEMENT 2.1
1.2 THE PROPOSAL FOR A DATA WAREHOUSE ARCHITECTURE MODEL 2.2
2. STATE OF THE ART ON DATA WAREHOUSE QUALITY 2.4
2.1 QUALITY DEFINITION 2.4
2.2 DATA QUALITY RESEARCH 2.4
2.3 SOFTWARE QUALITY RESEARCH 2.6
2.4 QUALITY ENGINEERING AND MANAGEMENT 2.6
2.4.1 Total Quality Management 2.6
2.4.2 Statistical Process Control (SPC) 2.7
2.4.3 ISO 9000 2.8
2.4.4 Quality Function Deployment (QFD) 2.9
2.4.5 Taguchi's Quality Engineering 2.10
2.4.6 Miscellaneous techniques 2.11
2.5 COMMERCIAL TOOLS CONCERNING DATA WAREHOUSE QUALITY 2.11
3. THE QUALITY METAMODEL 2.12
3.1 THE GOAL-QUESTION-METRIC (GQM) APPROACH 2.12
3.2 THE PROPOSED QUALITY METAMODEL 2.15
3.2.1 The Metamodel layer: the framework for quality management 2.15
3.2.2 Specialization at the metamodel layer: the patterns for quality management 2.17
3.2.3 Instantiation of the quality framework at the metadata layer. 2.17
3.2.4 Adherence to the metadata framework 2.17
4. PATTERNS FOR THE DATA WAREHOUSE QUALITY MANAGEMENT 2.19
4.1 TEMPLATES FOR QUALITY GOALS 2.19
4.2 TEMPLATES FOR QUALITY METRICS 2.21
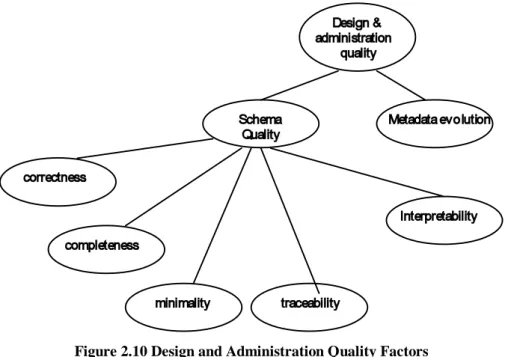
4.2.1 Design and Administration Quality 2.21
4.2.2 Software Implementation/Evaluation Quality 2.22
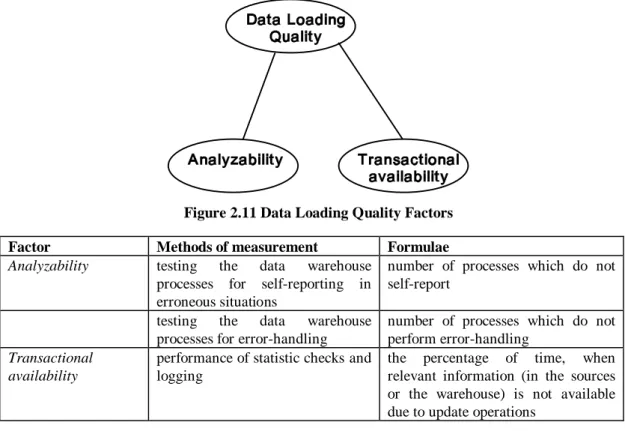
4.2.3 Data Loading Quality 2.24
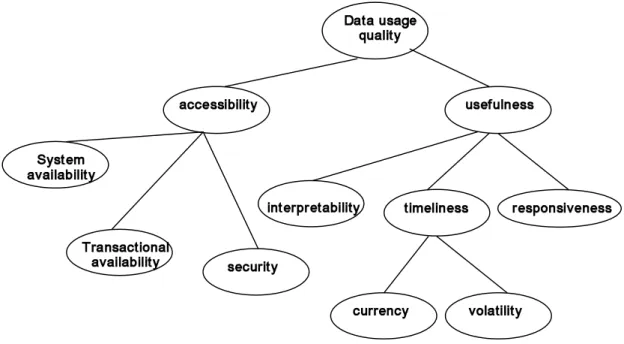
4.2.4 Data Usage Quality 2.25
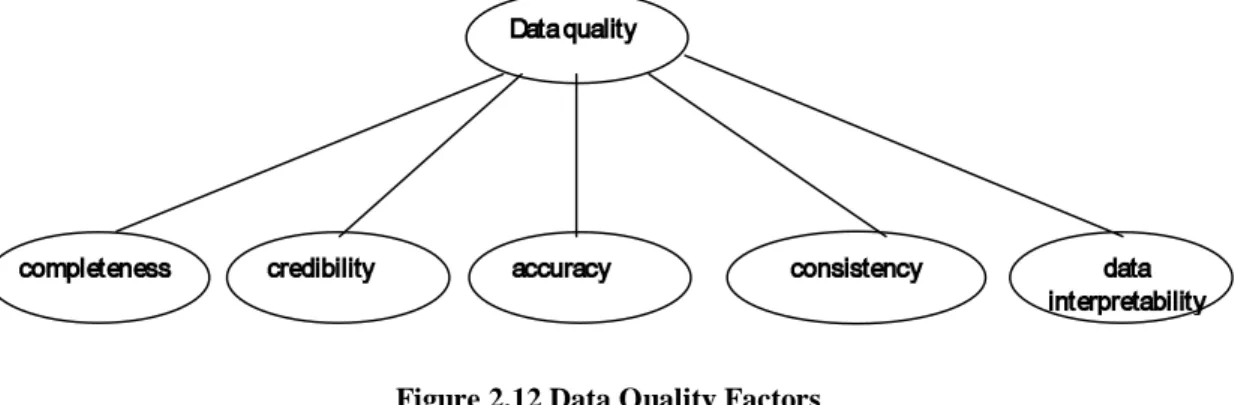
4.2.5 Data Quality 2.27
5. CONCLUSIONS 2.28
Chapter 3: Data Warehouse Processes
1. INTRODUCTION 3.1
4. METAMODEL FOR DATA WAREHOUSE OPERATIONAL PROCESSES 3.3
4.1 THE 3 PERSPECTIVES FOR THE PROCESS MODEL. 3.4
4.2 COMPLEXITY IN THE PROCESS STRUCTURE 3.6
4.3 RELATIONSHIP WITH DATA 3.7
4.4 THE PHYSICAL PERSPECTIVE 3.9
4.5 THE CONCEPTUAL PERSPECTIVE 3.10
5. ISSUES ON PROCESS QUALITY 3.11
5.1 TERMINOLOGY FOR QUALITY MANAGEMENT 3.11
5.2 QUALITY DIMENSIONS OF DATA WAREHOUSE PROCESSES 3.11
5.3 RELATIONSHIPS BETWEEN PROCESSES AND QUALITY 3.11
6. EXPLOITATION OF THE METADATA REPOSITORY 3.12
6.1 CONSISTENCY CHECKING IN THE METADATA REPOSITORY 3.13
6.2 INTERDEPENDENCIES OF TYPES AND PROCESSES 3.13
6.3 DERIVING ROLE INTERDEPENDENCIES AUTOMATICALLY 3.15
6.4 EXPLOITATION OF THE QUALITY MODELING IN THE REPOSITORY FOR THE ADMINISTRATION OF THE DATA WAREHOUSE
3.16
6.5 REPOSITORY SUPPORT FOR DATA WAREHOUSE EVOLUTION 3.16
7. CONCLUSIONS 3.17
Chapter 4: Data Warehouse Repository Exploitation
1. INTRODUCTION 4.1
2. LINKAGE TO THE ARCHITECTURE AND QUALITY MODEL 4.2
2.1 ARCHITECTURE AND QUALITY MODEL 4.2
2.2 QUALITY METAMODEL INSTANTIATION: THE REFRESHMENT CASE 4.2
3. EXPLOITATION OF THE METADATA REPOSITORY AND THE QUALITY METAMODEL
4.3
3.1 THE DESIGN PHASE 4.5
3.2 THE EVALUATION PHASE 4.7
3.3 THE ANALYSIS AND IMPROVEMENT PHASE 4.8
4. DATA WAREHOUSE EVOLUTION 4.9
4.1 EVOLUTION OF QUALITY FACTORS 4.9
4.2EVOLUTION OF QUALITY GOALS 4.10
4.3 REPOSITORY SUPPORT FOR DATA WAREHOUSE EVOLUTION 4.11
5. CASE STUDY 4.12
5.1 THE SYSTEM ARCHITECTURE 4.12
5.2 PROBLEMS AND QUALITY GOALS OF THE PROJECT 4.13
5.3 SCENARIO OF THE QUALITY GOAL 4.13
5.4 MAP OF THE QUALITY GOAL AND ANALYSIS OF THE SITUATION 4.14
6. RELATED WORK 4.15
7. SUMMARY 4.16
2. RELATED WORK 5.2
2.1 TERMINOLOGY, PRODUCTS AND STANDARDS 5.2
2.1.1 Terminology 5.2
2.1.2 Products and Technologies 5.3
2.1.3 Benchmarks and Standards 5.3
2.2 RELATIONAL EXTENSIONS 5.4
2.2.1 Models for OLAP 5.4
2.2.2 Relationship with Statistical Databases 5.5
2.3 CUBE-ORIENTED MODELS 5.5
2.4 COMPARISON 5.6
3. CUBES FOR MULTIDIMENSIONAL DATABASES 5.6
4. THE CUBE USABILITY PROBLEM 5.11
4.1 EQUIVALENT TRANSFORMATIONS FOR ATOMS INVOLVING VALUES 5.13
4.2 EQUIVALENT TRANSFORMATIONS FOR ATOMS INVOLVING ONLY LEVELS 5.15
4.3 TESTING CUBE USABILITY 5.20
5. SUMMARY 5.24
Chapter 6: Iktinos, an OLAP tool
1. INTRODUCTION 6.1
2. IKTINOS' MODEL OF MULTIDIMENSIONAL SPACE AND CUBES 6.2
3. SQL MAPPING OF THE MULTIDIMENSIONAL MODEL 6.9
4. CONCLUSIONS 6.11
Chapter 7: Conclusions
Referenecs
Chapter 1
Introduction
1. DESCRIPTION
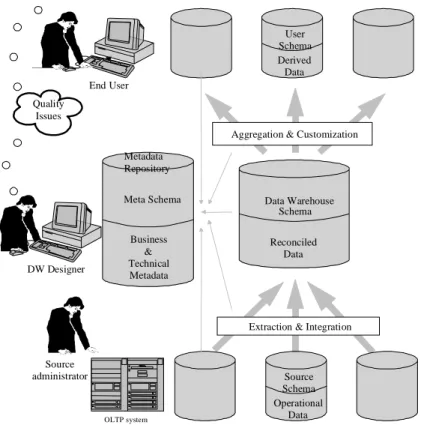
A Data Warehouse (DW) is a collection of technologies aimed at enabling the knowledge worker (executive, manager, analyst, etc) to make better and faster decisions. Many researchers and practitioners share the understanding that a data warehouse architecture can be formally understood as layers of materialized views on top of each other. A data warehouse architecture exhibits various layers of data in which data from one layer are derived from data of the lower layer. Data sources, also called operational databases, form the lowest layer. They may consist of structured data stored in open database systems and legacy systems, or unstructured or semi-structured data stored in files. The central layer of the architecture is the global (or primary) Data Warehouse. The global data warehouse keeps a historical record of data that result from the transformation, integration, and aggregation of detailed data found in the data sources. Usually, a data store of volatile, low granularity data is used for the integration of data from the various sources: it is called Operational Data Store
(ODS). The Operational Data Store, serves also as a buffer for data transformation and cleaning so
that the data warehouse is populated with clean and homogeneous data. The next layer of views are the local, or client warehouses, which contain highly aggregated data, directly derived from the global warehouse. There are various kinds of local warehouses, such as the data marts or the OLAP
databases, which may use relational database systems or specific multidimensional data structures.
All the data warehouse components, processes and data are -or at least should be- tracked and administered from a metadata repository. The metadata repository serves as an aid both to the administrator and the designer of a data warehouse. Indeed, the data warehouse is a very complex system, the volume of recorded data is vast and the processes employed for its extraction, transformation, cleansing, storage and aggregation are numerous, sensitive to changes and time-varying. The metadata repository serves as a roadmap that provides a trace of all design choices and a history of changes performed on its architecture and components. For example, the new version of the
Microsoft Repository [BBC*99] and the Metadata Interchange Specification (MDIS) [Meta97]
provide different models and application programming interfaces to control and manage metadata for OLAP databases. In Figure 1.1, a generic architecture for a data warehouse is depicted.
Data Warehouse Schema Reconciled Data User Schema Derived Data
Aggregation & Customization
Extraction & Integration
Source Schema Operational Data Meta Schema Business & Technical Metadata Metadata Repository End User Quality Issues OLTP system Source administrator DW Designer
Figure 1.1. A generic architecture for a data warehouse
The emergence of data warehousing was initially a consequence of the observation by W. Inmon and E. F. Codd in the early 1990’s that operational-level on-line transaction processing (OLTP) and decision support applications (OLAP) cannot coexist efficiently in the same database environment, mostly due to their very different transaction characteristics [Inmo96]. Inmon defined data warehouses as ‘subject-oriented’, integrated, time-varying, non-volatile collections of data that is
used primarily in organizational decision making. Since then, data warehousing became an important
strategy to integrate heterogeneous information sources in organizations, and to enable On-Line Analytic Processing.
A report from the META group during the Data Warehousing Conference (Orlando, Fl) in February 1996, presented very strong figures for the area [JLVV99]:
• Data warehousing will be a $13,000 million industry within 2 years ($8,000m hardware,
$5,000m on services and systems integration), while 1995 represents $2,000m levels of expenditure..
• The average expenditure for a data warehouse project is $3m. This is set to accelerate. 59% of the survey’s respondents expect to support data warehouses in excess of 50GB by the middle of the year 1996 and 85% are claiming they will be supporting over 50 users in the same timeframe.
In 1998, the reality has exceeded these figures, reaching sales of $14,600m. The number and complexity of projects is indicative of the difficulty of designing good data warehouses. Still, it is an interesting question to discover why the big organizations and enterprises embark in such a costly, risky and painful task, as the construction of a data warehouse is. It is a fact, of course, that OLAP technology gives added value to the information system of an enterprise; still practice has proved that another issue is of equal or greater importance too.
It is well known that the ultimate goal of organizations, governments and companies, when they accumulate and store information is the ability to process it later and take advantage of it. Unfortunately, neither the accumulation, nor the storage process, seem to be completely credible. In [WaRK95] it is suggested that errors in databases have been reported to be up to ten percent range and even higher in a variety of applications. It is obvious that inaccurate, invalid, out-of-date or incomplete data may have a heavy financial, or even social, impact. Although the implementation of mechanisms for achieving data quality has financial risks and may prove not to be profitable for the
organization which decides to undertake the task of implementing it, it is at least accepted that there can be an equilibrium in the cost-quality tradeoff. In [WaSF95], it is reported that more than $2 billion of U.S. federal loan money had been lost because of poor data quality at a single agency. It also reported that manufacturing companies spent over 25% of their sales on wasteful practices. The number came up to 40% for service companies.
Data warehouses have proved their value to serve as repositories for integrated, homogenized and clean data. In other words, they do not serve only as information buffers for answering complex questions quickly but also as intermediate stages in the processing of information within the information system of an enterprise, where the information becomes more accurate and useful. Thus, at the end of the data processing chain, at the front end of an OLAP / DW application, is ultimately the overall quality of the information which is provided to the end user.
2. QUALITY AND DATA WAREHOUSES
Data quality has been defined as the fraction of performance over expectancy, or as the loss imparted to society from the time a product is shipped [ BBBB95]. We believe, though, that the best definition is the one found in [TaBa98, Orr98, WaSG94]: data quality is defined as "fitness for use". The nature of this definition directly implies that the concept of data quality is relative. For example, data semantics (the interpretation of information) is different for each distinct user. As [Orr98] mentions "the problem of data quality is fundamentally intertwined in how [...] users actually use the data in the system", since the users are actually the ultimate judges of the quality of the data produced for them: if nobody actually uses the data, then nobody will ever take care to improve its quality.
As a decision support information system, a data warehouse must provide high level quality of data and quality of service. Coherency, freshness, accuracy, accessibility, availability and performance are among the quality features required by the end users of the data warehouse. Still, too many stakeholders are involved in the lifecycle of the data warehouse; all of them seem to have their quality requirements. As already mentioned, the Decision Maker usually employs an OLAP query tool to get answers interesting to him. A decision-maker is usually concerned with the quality of the stored data, their timeliness and the ease of querying them through the OLAP tools. The Data Warehouse
Administrator needs facilities such as error reporting, metadata accessibility and knowledge of the timeliness of the data, in order to detect changes and reasons for them, or problems in the stored
information. The Data Warehouse Designer needs to measure the quality of the schemata of the data warehouse environment (both existing and newly produced) and the quality of the metadata as well. Furthermore, he needs software evaluation standards to test the software packages he considers purchasing. The Programmers of Data Warehouse Components can make good use of software
implementation standards in order to accomplish and evaluate their work. Metadata reporting can
also facilitate their job, since they can avoid mistakes related to schema information. Based on this analysis, we can safely argue that different roles imply a different collection of quality aspects, which should be ideally treated in a consistent and meaningful way.
From the previous it follows that, on one hand, the quality of data is of highly subjective nature and should ideally be treated differently for each user. At the same time, the quality goals of the involved stakeholders are highly diverse in nature. They can be neither assessed nor achieved directly but require complex measurement, prediction, and design techniques, often in the form of an interactive process. On the other hand, the reasons for data deficiencies, non-availability or reachability problems are definitely objective, and depend mostly on the information system definition and implementation. Furthermore, the prediction of data quality for each user must be based on objective quality factors that are computed and compared to users' expectations. The question that arises, then, is how to organize the design, administration and evolution of the data warehouse in such a way that all the different, and sometimes opposing, quality requirements of the users can be simultaneously satisfied. As the number of users and the complexity of data warehouse systems do not permit to reach total quality for every user, another question is how to prioritize these requirements in order to satisfy them with respect to their importance. This problem is typically illustrated by the physical design of the data warehouse where the problem is to find a set of materialized views that optimize user requests response time and the global data warehouse maintenance cost at the same time.
Before answering these questions, though, it should be useful to make a clear-cut definition of the major concepts in these data warehouse quality management problems. To give an idea of the complexity of the situation let us present a verbal description of the situation. The interpretability of the data and the processes of the data warehouse is heavily dependent on the design process (the level of the description of the data and the processes of the warehouse) and the expressive power of the models and the languages which are used. Both the data and the systems architecture (i.e. where each piece of information resides and what the architecture of the system is) are part of the interpretability dimension. The integration process is related to the interpretability dimension, by trying to produce minimal schemata. Furthermore, processes like query optimization (possibly using semantic information about the kind of the queried data -e.g. temporal, aggregate, etc.), and multidimensional aggregation (e.g. containment of views, which can guide the choice of the appropriate relations to answer a query) are dependent on the interpretability of the data and the processes of the warehouse. The accessibility dimension of quality is dependent on the kind of data sources and the design of the data and the processes of the warehouse. The kind of views stored in the warehouse, the update policy and the querying processes are all influencing the accessibility of the information. Query optimization is related to the accessibility dimension, since the sooner the queries are answered, the higher the transaction availability is. The extraction of data from the sources is also influencing (actually determining) the availability of the data warehouse. Consequently, one of the primary goals of the update propagation policy should be to achieve high availability of the data warehouse (and the sources). The update policies, the evolution of the warehouse (amount of purged information) and the kind of data sources are all influencing the timeliness and consequently the usefulness of data. Furthermore, the timeliness dimension influences the data warehouse design and the querying of the information stored in the warehouse (e.g., the query optimization could possibly take advantage of possible temporal relationships in the data warehouse). The believability of the data in the warehouse is obviously influenced from the believability of the data in the sources. Furthermore, the level of the desired believability influences the design of the views and processes of the warehouse. Consequently, the source integration should take into account the believability of the data, whereas the data warehouse design process should also take into account the believability of the processes. The validation of all the processes of the data warehouse is another issue, related with every task in the data warehouse environment and especially with the design process. Redundant information in the warehouse can be used from the aggregation, customization and query optimization processes in order to obtain information faster. Also, replication issues are related to these tasks. Finally, quality aspects influence several factors of data warehouse design. For instance, the required storage space can be influenced by the amount and volume of the quality indicators needed (time, believability indicators etc.). Furthermore, problems like the improvement of query optimization through the use of quality indicators (e.g. ameliorate caching), the modeling of incomplete information of the data sources in the data warehouse, the reduction of negative effects schema evolution has on data quality and the extension of data warehouse models and languages, so as to make good use of quality information have to be dealt with.
3. FRAMEWORK AND MOTIVATION FOR RESEARCH
Our proposal is based on the assumption that the metadata repository of the data warehouse can serve as the cockpit for the management of quality. To make the repository functional, we must provide a coherent framework that captures the data warehouse from three different viewpoints, namely the
architecture, process and quality viewpoints.
Why an architecture model?
Although many data warehouses have already been built, there is no common methodology, which supports database system administrators in designing and evolving a data warehouse. The problem with architecture models for data warehouses is that practice has preceded research in this area and continues to do so. Consequently, the task of providing an abstract model of the architecture becomes more difficult.
Formally, an architecture model corresponds to the schema structure of the meta-database that controls the usually distributed and heterogeneous set of data warehouse components and therefore is
the essential starting point for design and operational optimization. The purpose of architecture models is to provide an expressive, semantically defined and computationally understood meta modeling language, based on observing existing approaches in practice and research. Expressiveness and services of the metadata schema are crucial for data warehouse quality.
To facilitate complex analysis and visualization, information targeted for On-Line Analytical Processing is organized according to the multidimensional data model, which involves aggregation of data according to specific data dimensions. It has been argued that traditional data models (e.g., the relational one) are in principle not powerful enough for data warehouse applications, whereas multidimensional models provide the functionality needed for summarizing, viewing, and consolidating the information available in data warehouses [JLVV99]. Despite this consensus on the central role of multidimensional data cubes, and the variety of the proposals made by researchers, there is little agreement on finding a common terminology and semantic foundations for a multidimensional data model. The missing semantic enrichment will not only enhance data warehouse design but can also be used to optimize data warehouse operation, by providing reasoning facilities to exploit redundant pre-materialized (or cached) information which can be reused in more than one operations.
Why a process model?
The static description of the architecture parts of the data warehouse can be complemented, with a metamodel of the dynamic parts of the data warehouse, i.e. the data warehouse processes. Providing a process model for data warehouses practically captures the behavior of the system and the interdependencies of the involved stakeholders. Since data warehouse processes are data intensive, special care should be taken to capture the interrelationship of the process definition to the data involved to their operation. Moreover, due to the diversity and number of the stakeholders in the data warehouse environment, the tracking of data warehouse processes provides the ability to administer the operation and especially the evolution of the data warehouse, based on the knowledge of the possible effects of any actions, to the involved stakeholders or architecture objects.
Why a quality model? How to use it?
As already made explicit, apart from their role as passive buffers in the data propagation path between operational databases and end users, data warehouses can also serve as the bridge of the gap between subjective user requirements for information quality and objective detection and measurements of data deficiencies. The data warehouse, being a collective off-line, multi-layered system, can serve as a "data cleaner" for the information presented to the user. Recording the quality of the data warehouse data and processes in a metadata repository is providing, thus, the data warehouse stakeholders with sufficient power to evaluate, understand and possibly react against the structure and content of the warehouse. The quality model of the data warehouse, answers questions like:
• How can the quality of a data warehouse be evaluated and designed?
• How can the quality of a data warehouse be managed in the everyday usage of the data
warehouse?
Still, although quality considerations have accompanied data warehouse research from the beginning, most of the research has focused on issues such as the trade-off between freshness of data warehouse data and disturbance of OLTP work during data extraction; the minimization of data transfer through incremental view maintenance; and a theory of computation with multi-dimensional data models [JLVV99].
From the viewpoint of information systems research, though, the problem of how to design, construct and administer data warehouses that satisfy specific, well-defined quality criteria is still present. Due to the versatile nature of quality requirements, it is desirable to achieve breadth of coverage without giving up the detailed knowledge available for certain criteria. The heavy use of highly qualified consultants in data warehouse applications indicates that we have not yet reached a high-level, systematic solution to the problem. The basic issues raised in this context are basically
• Measurement techniques that populate the quality model, in order to make it useful;
• A methodology that ensure the quality of the data and processes during both the design and the everyday usage of the warehouse.
As a concluding general statement, the enrichment of the metadata of a data warehouse with the appropriate models will be beneficial for the design, administration and usage of the data warehouse.
4. ROADMAP FOR THE REST OF THE DOCUMENT
We answer all the aforementioned problems in the following chapters of this document. In Chapter 2, we adopt an architecture metamodel [JJQV99] as the basis for the metadata repository of the data warehouse. A framework for data warehouse metadata and a quality metamodel accompany the architecture metamodel. In Chapter 3, the metamodel for data warehouse processes is introduced. The three metamodels are accompanied by a methodology for quality-oriented data warehouse management in Chapter 4. In Chapter 5 we present a formal metamodel for multidimensional databases as well as query optimization techniques that exploit it. Chapter 6 presents information about a prototype OLAP tool, which implemented a previous version of the multidimensional metamodel. Finally, in Chapter 7, we conclude our results.
Specifically, the thesis is structured as follows:
The first major result that we present in Chapter 2, is a general framework for the treatment of data warehouse metadata in a metadata repository. The framework requires the classification of metadata in at least two instantiation layers and three perspectives. The metamodel layer constitutes the schema of the metadata repository and the metadata layer the actual meta-information for a particular data warehouse. The perspectives are the well known conceptual, logical and physical perspectives from the field of database and information systems.
We link this framework to a well-defined approach for the architecture of the data warehouse from the literature. Then, we present our proposal for a quality metamodel, which builds on the widely accepted Goal-Question-Metric approach for the quality management of information systems. Moreover, we enrich the generic metamodel layer with patterns concerning the linkage of (a) quality metrics to data warehouse objects and (b) of data warehouse stakeholders to template quality goals.
Then, in Chapter 3, we go on to describe a metamodel for data warehouse operational processes. This metamodel enables data warehouse management, design and evolution based on a high level conceptual perspective, which can be linked to the actual structural and physical aspects of the data warehouse architecture. This metamodel is capable of modeling complex activities, their interrelationships, the relationship of activities with data sources and execution details.
The ex ante treatment of the metadata repository is enabled by a full set of steps, i.e., quality question, which constitute our methodology for data warehouse quality management and the quality-oriented evolution of a data warehouse based on the architecture, process and quality metamodels. Our approach –presented in Chapter 4- extends GQM, based on the idea that a goal is operationally defined over a set of questions. Thus, we provide specific “questions” for the full lifecycle of a goal: this way the data warehouse metadata repository is not simply defined statically, but it can be actually exploited in a systematic manner.
Special attention is paid to a particular part of the architecture metamodel, the modeling of OLAP databases. To this end, in Chapter 5, we first provide a categorization of the work in the area of OLAP logical models by surveying some major efforts, including commercial tools, benchmarks and standards, and academic efforts. We also attempt a comparison of the various models along several dimensions, including representation and querying aspects. Our contribution lies in the introduction a logical model for cubes based on the key observation that a cube is not a self-existing entity, but rather a view over an underlying data set. The proposed model is powerful enough to capture all the commonly encountered OLAP operations such as selection, roll-up and drill-down, through a sound and complete algebra. We also show how this model can be used as the basis for processing cube operations and provide syntactic characterizations for the problems of cube usability. In Chapter 6, we
present an experimental prototype OLAP tool, implementing a previous version of the proposed model.
Finally, this thesis gives an extended review of the existing literature on the field, as well as a list of related open research issues.
Chapter 2
Architecture and Quality
Metamodels
1.
INTRODUCTION
We made an interesting point at the end of the previous chapter, by stating that the efficient management of the lifecycle of a data warehouse is enabled by the inspection of three viewpoints concerning the data warehouse: its architecture, processes and quality. The architecture constitutes of the static components comprising the data warehouse; the processes capture the dynamic part of the data warehouse environment. Finally, quality is a measure of the fulfillment of the expectations of the involved stakeholders in such an environment.
For each viewpoint, a respective metamodel can be derived. It is important, of course, that all three metamodels respect a coherent framework, and fit gracefully with each other. We will immediately proceed to present the architecture metamodel for a data warehouse, as well as the general framework for metadata management. In the next section we will make a proposal for a quality metamodel and in the fourth section we will present templates for quality management in a data warehouse environment. The data warehouse processes -which we believe to be the more interesting part of the whole environment- will be detailed in the next chapter.
1.1 State of the art in metadata management
As mentioned in [JLVV99], metadata is stored in a repository, where it can be accessed from every component of the data warehouse. The Metadata Coalition has proposed a Metadata Interchange
Specification [Meta97]; additional emphasis has been placed on this area through the recent efforts of
Microsoft to introduce a repository product in their Office tool suite, including some simple Information Models for data warehousing [BBC*99]. We refer the interested reader to [JLVV99] for a more detailed description of these approaches. The Telos language developed jointly between the University of Toronto and a number of European projects in the late 80’s, is specifically dedicated to the goal of metadata management [MBJK90]. Telos, in the axiomatized form defined in [Jeus92], offers an unlimited classification hierarchy in combination with abstractions for complex objects and
for generalizations, both for objects and for links between them, i.e. both are first-class citizens of the language, offering maximum flexibility in modeling and re-modeling complex metadata. In particular, it becomes possible to define, not just syntactically but also semantically, meta models for new kinds of metadata introduced in the distributed system managed by the repository, and therefore in the repository itself. Such metamodels are often also called Information Models and exist typically for all kinds of objects and processes used in system analysis, design and evolution.
The ConceptBase system, developed since 1987 at RWTH Aachen, Germany [JaRo88, JGJ*95, NiJa98], as a knowledge-based repository, integrates a logical semantics with the basic abstractions for the purpose of analyzing the consistency of stored repository objects such as software specifications in different kinds of formalisms. Through the axiomatization of the Telos semantics, ConceptBase achieves a combination of structural object-orientation with the kinds of reasoning capabilities offered by deductive relational databases and relational query optimization. ConceptBase will be the metadata repository to which we will refer in the rest of this document.
1.2 The proposal for a data warehouse architecture model
In [JJQV99] the need for a data warehouse metadata structure that offers three perspectives is argued:
- a conceptual business perspective developed around the enterprise model of the organization;
- a logical perspective covering all the schemata of the data warehouse environment, and
- a physical perspective representing the storage and execution properties of the data warehouse components.
Each of these perspectives, and their interrelationships, are orthogonally linked to the three traditional layers of data warehousing, namely sources, data warehouse, and clients. The metamodel is reproduced in Figure 2.1. In this section, we will quickly present the extended metamodel resulting from this approach, and the reasons for which we adopt it. This description is fully elaborated in [JJQV99]. Note that the architecture model was basically developed in RWTH, the Technical University of Aachen, by C. Quix, M. Jeusfeld, M. Jarke.
Client Level DW Level Source Level Conceptual Perspective Logical Perspective Physical Perspective Meta Model Level Models/ Meta Data Level in Real World in in Process Model Process Meta Model uses Process Processes
Figure 2.1. The [JJQV99] Data Warehouse MetaData Framework
At the beginning of this description we would like to remind the reader that (a) data warehouse systems are unique in the sense that they rely on a run-time meta-database (or metadata repository)
that stores information about the data and processes in the system and (b) our approach is based on the Telos language [MBJK90], and the ConceptBase metadata repository [JGJ*95].
A condensed ConceptBase model of the architecture notation is given in Figure 2.2, using the graph syntax of Telos. Bold arrows denote specialization/instantiation links (depending on the respective tag each time). The top-level object is MeasurableObject. It classifies objects at any perspective (conceptual, logical, or physical) and at any level (source, data warehouse, or client). Within each perspective, we distinguish between the modules it offers (e.g. client model) and the kinds of information found within these modules (e.g. concepts and their subsumption relationships). The horizontal levels of the information structures are coded by the three subclasses attached to Model,
Schema, and DataStore, each for a different perspective. The horizontal links isViewOn and hasStructure establish the way how the horizontal links in Figure 2.2 are interpreted: the types of a
schema (i.e., relational or multidimensional structures) are defined as logical views on the concepts in the conceptual perspectives. On the other hand, the components of the physical perspective get a schema from the logical perspective as their schema.
Each object can have an associated set of materialized views called QualityMeasurements. These materialized views (which can also be specialized to the different perspectives – not in the figure) constitute the bridge to the quality model discussed in the Section 3.
ConceptualObject LogicalObject PhysicalObject
Model Concept hasConcept Source Model Enterprise Model Client Model Schema Type hasType Source Schema DW Schema Client Schema DW_Component deliversTo Agent DataStore Source DataStore Control Agent Transport Agent Client DataStore DW DataStore isViewOn hasStructure in in in isa isa isa isa isa isa isa isSubsumedBy relatesTo isa isa isa Measurable
Object MeasurementQuality
onObject
Figure 2.2. Structure of the Repository Meta Model
Note that all the objects in Figure 2.2 are meta-classes: actual conceptual models, logical schemas, and data warehouse components are represented as instances of them in the meta-database. Actually, as depicted in Figure 2.1, we can discriminate between three levels of instantiation. The metamodel (i.e. the topmost layer in Figure 2.1) provides a notation for data warehouse generic entities, such as schema, or agent, including the business perspective. Each box shown in Figure 2.1 is decomposed into more detailed data warehouse objects in the metamodel of [JJQV99]. This metamodel is instantiated with the metadata of the data warehouse (i.e. the second layer in Figure 2.1), e.g. relational schema definitions or the description of the conceptual data warehouse model. The lowest layer in Figure 2.1 represents the real world where the actual processes and data reside: in this level the metadata are instantiated with data instances, e.g. the tuples of a relation or the objects of the real world which are represented by the entities of the conceptual model.
We adopt the approach of [JJQV99] for specific reasons. During the analysis of previous data warehouse frameworks (see [JLVV99] for a broader discussion), one could observe that these frameworks cover only logical schemata and their physical implementation. However, data warehouse users may interpret the data in different ways because they think of different concepts. This situation leads often to misunderstandings of the data. Furthermore, enterprises have a huge number of heterogeneous data sources and it is difficult to have on overall picture of what kind of data is available in the source and to keep track of the interdependencies between the data sources. Thus, it is important to note that the proposal of [JJQV99] extended the traditional data warehouse architecture in two ways: (i) a conceptual perspective is clearly added and (ii) a clean separation of locality (here:
metamodel depicted in Figure 2.2 is the conceptual enterprise model, which gives a conceptual description of the data in the enterprise. All the information that is available in the sources and requested by the clients of the data warehouse is expressed in terms of this enterprise model.
To summarize, we stress that the metadata framework that we adopt is based on the following assumptions / requirements:
1. A clear distinction exists between different layers of instantiation. Thus, for all the metamodels that we will present, we will require that the generic metamodel layer deals abstractly with entities applicable to any data warehouse; the metadata layer deals will the schemata of a specific data warehouse under examination; and finally the instance layer intantiates the previous ones at the real-world domain. Out of the three layers of instantiation, we require that the two first should be treated clearly by a metadata repository. The instance layer, though, is optional as far as the metadata repository is concerned, since it deals with the actual information (and not its "meta" description).
2. A clear distinction exists between perspectives. Following a classical database / information systems categorization, we require that a conceptual perspective captures the world in a vocabulary really close to the one of the final user; the physical perspective covers the data warehouse environment in terms of real world, computer-oriented components or events; and finally, the logical perspective acts as an intermediate between these two extremes in order to provide a concrete vocabulary of the data warehouse environment, being independent, though, from strict implementation details.
As we saw, the architecture model of [JJQV99], not only covers these requirements, but provides an extra useful categorization, namely the locality attribute of any data warehouse component. In Section 3, we will introduce a quality metamodel that covers the second viewpoint for data warehouses. Still, before that, we feel that it is necessary to present the state of the art in the field of quality definition and management, in information systems.
2.
STATE OF THE ART ON DATA WAREHOUSE QUALITY
Models and tools for the management of data warehouse quality can build on substantial previous work in the fields of data quality.
2.1
Quality Definition
In [BBBB95], a definition and quantification of quality is given, as the fraction of Performance over
Expectance. Taguchi defined quality as the loss imparted to society from the time a product is shipped
[BBBB95]. The total loss of society can be viewed as the sum of the producer's loss and the customer's loss. It is well known that there is a tradeoff between the quality of a product or service and a production cost and that an organization must find an equilibrium between these two parameters. If the equilibrium is lost, then the organization loses anyway (either by paying too much money to achieve a certain standard of quality, called "target", or by shipping low quality products of services, which result in bad reputation and loss of market share).
2.2
Data Quality Research
Quite a lot of research has been done in the field of data quality. Both researchers and practitioners have faced the problem of enhancing the quality of decision support systems, mainly by ameliorating the quality of their data. In this section we will present the related work on this field, which more or less influenced our approach for data warehouse quality. A detailed presentation can be found in [VaSL97] and [WaSF95].
Wang et al. [WaSF95] presents a framework of data analysis, based on the ISO 9000 standard. The framework consists of seven elements adapted from the ISO 9000 standard: management responsibilities, operation and assurance cost, research and development, production, distribution, personnel management and legal function. This framework reviews a significant part of the literature
on data quality, yet only the research and development aspects of data quality seem to be relevant to the cause of data warehouse quality design. The three main issues involved in this field are: analysis and design of the data quality aspects of data products, design of data manufacturing systems (DMS’s) that incorporate data quality aspects and definition of data quality dimensions. We should note, however, that data are treated as products within the proposed framework. The general terminology of the framework regarding quality is as follows: Data quality policy is the overall intention and direction of an organization with respect to issues concerning the quality of data products. Data
quality management is the management function that determines and implements the data quality
policy. A data quality system encompasses the organizational structure, responsibilities, procedures, processes and resources for implementing data quality management. Data quality control is a set of operational techniques and activities that are used to attain the quality required for a data product.
Data quality assurance includes all the planed and systematic actions necessary to provide adequate
confidence that a data product will satisfy a given set of quality requirements.
In [WaSF95] the research regarding the design of data manufacturing systems that incorporate data quality aspects is classified into two major approaches: the development of analytical models and the
design of system technologies to ensure the quality of data .
In the papers concerning the development of analytical models, one can find efforts such as the ones presented in [BaPa85], [BaPa87] and [BWPT93]. In [BaPa85] and [BaPa87] a model that produces expressions for the magnitude of errors for selected terminal outputs, is presented. The model can be deployed to investigate the quality of data in existing systems. Furthermore, an operations research model is presented for the analysis of the effect of the use of quality control blocks, in the management of production systems. In [BWPT93] a data-manufacturing model to determine data product quality is proposed. The model is used for the assessment of the impact quality has on data delivered to ‘data customers’.
In the field of the design of system technologies to ensure the quality of data, there exist several interesting efforts. In [HKRW90], [PaRe90], [Redm92] a data tracking technique is proposed. This technique uses a combination of statistical control and manual identification of errors and their sources. The basis of the proposed methodology is the assumption that processes that create data are often highly redundant. The aim of the methodology is to identify pairs of steps in the overall process that produce inconsistent data. In [WaKM93], [WaRG93], [WaRK95], [WaMa90] an attribute-based model that can be used to incorporate quality aspects of data products has been developed. The basis of this approach is the assumption that the quality design of an information system can be incorporated in the overall design of the system. The model proposes the extension of the relational model as well as the annotation of the results of a query with the appropriate quality indicators. In [WaKM93], in particular, an extension of the ER model is proposed, in order to incorporate data quality specification. The data quality design is handled as an internal part of the whole database design. The methodology deals with data quality requirements collection and definition. Quality parameters are initially treated as subjective (user requirements) and then mapped to objective technical solutions. [Svan84] reports on a case study, regarding the testing of an actual development of an integrity analysis system. A methodology -consisting of seven steps- is suggested: i) defining database constraints, ii) selecting statistical techniques for sampling the database, iii) selecting the integrity analysis to be performed, iv) defining suitable quality measures, v) specifying outputs to be produced from a defect file, vi) developing and testing program code, and finally vii) executing the integrity analysis system.
Finally, there is a great deal of work related to the definition of data quality dimensions. In [BaPa82], [BaPa85], [BaPa87], [BaTa89], [BWPT93], the following quality dimensions are defined: accuracy (conformity of the stored with the actual value), timeliness (recorded value is not out of date),
completeness (no information is missing), consistency (the representation of data is uniform). In
[StLW94] data quality is modeled through the definition of intrinsic, contextual, representation, and accessibility aspects of data. In [Jans88], [LiUp90], [WaRG93] validation, availability, traceability and credibility are introduced. In [More82] a method that estimates the ‘true’ stored error rate is proposed. In the field of information systems, many efforts are focused on the evaluation of the success of a system from the user's point of view. In [Hall*78] various factors are proposed, such as
usability, reliability, independence, etc. [Krie79] proposes attributes such as accuracy, timeliness, precision, reliability, completeness and relevancy. In [AgAh87] the reliability of an information
system is measured. The following measures are proposed: internal reliability ("commonly accepted" characteristics of data items), relative reliability (data compliance to user requirements) and absolute
In [WaSF95] it is suggested that the establishment of data quality dimensions can be achieved through two possible ways. The first is the usage of a scientifically grounded approach in order to achieve a rigorous definition. In the context of this approach, an ontological-based [Wand89], [WaWa96], [WaWe90] approach has been proposed in order to identify the possible deficiencies that exist when mapping the real world into an information system. In [DeMc92] information theory is used as the basis for the foundation of data quality dimensions, whereas in [WaSG94] marketing research is used as the basis for the same cause. The second way to establish data quality dimensions is the use of pragmatic approaches. E.g. data quality dimensions can be thought as user defined. Another proposal [WaSF95] is the formation of a data quality standard technical committee for this task. A previous example of similar practice is the IEEE standard for software quality dimensions [Schn90].
2.3
Software Quality Research
Apart from the research in the quality of data, quite a lot of research has been done in the field of software quality. The research in this field is actually centered towards the design, implementation, testing and evaluation of software.
Several models for software quality have been proposed. The GE Model of software quality [McRW78], suggests 11 criteria of software quality. The model developed by B. Boehm [Boeh89] suggests 19 quality factors for software. ISO 9126 [ISO97] suggests six basic quality factors that are further analyzed to an overall of 21 quality factors. In [HyRo96] a comparative presentation of these three models is done. Furthermore, the SATC software quality model is presented, along with the metrics for the software quality dimensions.
The GE Model suggests that the dimensions software should have are: correctness, reliability,
integrity, usability, efficiency, maintainability, testability, interoperability, flexibility, reusability and portability.
Boehm’s model suggests correctness, reliability, integrity, usability, efficiency, maintainability,
flexibility, reusability, portability, clarity, modifiability, documentation, resilience, understandability, validity, generality, economy.
ISO 9126 model suggests functionality (suitability, accuracy, interoperability, compliance, security),
reliability (maturity, fault tolerance, recoverability), usability (understandability, learnability,
operability), efficiency (time behavior, resource behavior), maintainability (analyzability, changeability, stability, testability), portability (adaptability, installability, conformance, replacability).
Finally, SATC suggests requirements quality (ambiguity, completeness, understandability, volatility, traceability), product (code) quality (structure/architecture, maintainability, reusability, internal documentation, external documentation), implementation effectivity (resource usage, completion rates), testing effectivity (correctness).
The interested reader can find quite a lot of standards developed from ISO and IEEE in the field of software quality. A list of them is found in Appendix A.
2.4
Quality engineering and management
2.4.1 Total Quality Management
In our days, one of the most popular trends in the field of quality engineering is Total Quality
Management (TQM). Total Quality Management is a philosophy for the improvement of an
organization in order to achieve excellence. It involves the whole structure and operation of an organization. In [BBBB95], Total Quality Management is considered to be heavily dependent upon 6 crucial concepts:
1. A management committed to TQM ideas, in order to provide long term organizational support at all levels.
2. An unwavering focus both to the internal and the external customers. 3. The effective involvement of all the work force of the organization. 4. The continuous improvement of all the processes of the organization. 5. The treatment of suppliers as partners.
As already mentioned, TQM considers quality as the fraction of performance over expectance. The greater quality is, the better a customer feels about a product or service. In [Garv88] the dimensions of quality (regarding TQM) are presented:
• performance (primary product characteristics);
• features (secondary product characteristics);
• conformance (to specification standards);
• reliability (consistency of performance over time);
• durability (useful life of a product);
• service (resolution of problems, ease of repair);
• response (human-to-human interface);
• aesthetics (sensory characteristics);
• reputation (past performance).
For reasons of completeness, we will proceed in a very short presentation of the basic principles of TQM. TQM involves a strategic planning for the achievement of quality. In [BBBB95] it is suggested that several steps have to take place in order to complete the strategic planning successfully:
1. Discovery of the customers needs.
2. Positioning of the organization towards its customer base. 3. Future prediction.
4. Analysis of the gaps between current and future states of the organization. 5. Closing of these gaps through the construction of an action plan.
6. Alignment of this plan to the mission, vision and core values of the organization. 7. Implementation of the plan.
Nevertheless, the original design is never sufficient enough. Continuous control and improvement of processes must take place. In [Jura88], a specific approach is presented for the achievement of this goal. This approach is called the Juran Trilogy and consists of several steps:
• planning
⇒ determination of customers;
⇒ discovery of their needs;
⇒ development of product/service features responding to the customers' needs;
⇒ development of processes able to produce these necessary features;
• control
⇒ evaluation of the actual operating performance;
⇒ comparison of this performance to the goals of the organization;
⇒ action on the difference;
• improvement
To be useful, quality has to be measured. As reported in [Boed87], performance measures are used to establish baseline measures, determine processes which need to be improved, indicate process gains and losses, compare goals with actual performance, provide information for team and personal evaluation and finally, manage by fact rather than by gut feeling. Several criteria are defined for the evaluation of the measures employed:
• simplicity;
• number: measures should be few in number so that all users (i.e., persons that perform the
measurement) can concentrate on them;
• development by the user;
• relevance to the customer;
• focus on the improvement of processes, prevention of errors and long-term planning;
• cost;
• knowledge of the measures from the side of the users.
Several characteristics of a process or function can be used to measure the performance of a process, as reported in [Boed87]:
• cost (the amount of resources required to produce a given output);
• time (timeliness of the output of a process);
• accuracy (number of non-conformances in the output of a process);
• function (extent of performance of the specified function);
• service;
• aesthetics (quantification come through the percentage of people who like the product's exterior design).
2.4.2 Statistical Process Control (SPC)
Statistical Process Control (SPC) is one of the best tools for monitoring and improving product and service quality. In [Best94], [BBBB95], seven basic techniques are proposed for this purpose:
• Pareto diagrams.
• Process flow diagrams.
• Cause and effect (Ishikawa) diagrams.
• Check sheets.
• Histograms.
• Control charts.
Pareto diagrams are used to identify the most important factors of a process, based on the assumption that most of the errors result from very few causes. A Pareto diagram is a graph that ranks data classifications (e.g. system failures) in a descending order. The process flow diagrams show the flow of product (services) through the various subsystems of a bigger system. Possible errors can be detected through the analysis of such a diagram. The cause and effect diagrams, introduced by Dr. Ishikawa in 1943, are composed of lines and symbols representing meaningful relationships between an effect and its causes, in a recursive fashion. Check sheets and histograms are very known techniques for representing graphically cumulative information about failure phenomena. Finally, control charts are used in order to relate an average (possibly expected or predefined) value of quality to statistical data representing the behavior of the actual products (services).
2.4.3 ISO 9000
The International Organization for Standardization (ISO) was founded in Geneva, Switzerland, in 1946. Its goal is to promote the development of international standards to facilitate the exchange of goods and services worldwide.
The original ISO 9000 [ISO92], [ISO97] standards were a series of international standards (ISO 9000, ISO 9001, ISO 9002, ISO 9003, ISO 9004), developed by ISO Technical Committee 176 (TC176) to provide guidance on selection of an appropriate quality management program (system) for a supplier's operations. The series of standards serves the purpose of common terminology definition and demonstration of a supplier's capability of controlling its processes. The titles and content of the 1994 edition of the ISO 9000 series are described in the following paragraphs:
ISO 9000 -1, Quality Management and Quality Assurance Standards - Guidelines for Selection and Use. This standard explains fundamental quality concepts, defines key terms and provides guidance
on selecting, using and tailoring series. Furthermore, it helps in the selection and use of the standards in the ISO 9000 family.
ISO 9001-1, Quality Systems - Model for Quality Assurance in Design/Development, Production, Installation and Servicing. This is the most comprehensive standard. It addresses all elements in the
including design. The 1994 edition of the standard improved the consistency of the terminology and clarified or expanded the meaning of some of the standards clauses. Several new requirements, such as that for quality planning, were added. The standard contains 20 elements describing the quality parameters, from the receipt of a contract through the design/delivery stage, until the service required after delivery.
ISO 9002, Quality Systems - Model for Quality Assurance in Production and Installation and Servicing. This standard is now identical to ISO 9001 except for the design requirements.
ISO 9003, Quality Systems - Model for Quality Assurance in Final Inspection and Test. This is the
least comprehensive standard. It addresses the detection and control of problems during final inspection and testing. Thus, it is not a quality control system. The 1994 edition added additional requirements including: contract review, control of customer supplied product, corrective actions, and internal quality audits.
ISO 9004 -1, Quality Management and Quality System Elements - Guidelines. This standard provides
guidance in developing and implementing an internal quality system and in determining the extent to which each quality system element is applicable. The guidance in ISO 9004-1 exceeds the requirements contained in ISO 9001, ISO 9002 and ISO 9003. ISO 9004-1 is intended to assist a supplier in improving internal quality management procedures and practices. Yet, it is not intended for use in contractual, regulatory or registration applications.
The full list of the developed standards is found in Appendix A. Out of them, the «ISO/DIS 9000-3
Quality management and quality assurance standards -- Part 3: Guidelines for the application of ISO 9001:1994 to the development, supply, installation and maintenance of computer software (Revision of ISO 9000-3:1991)» standard, is specifically intended for use in the computer software industry.
Furthermore, there are several standards developed from ISO, concerned with the achievement of quality in the development and evaluation of software. Yet, these standards are not directly concerned with ISO 9000, so they are covered in the section of software quality research.
A framework for quality analysis is developed in ISO 9001-1 and consists of the following 20 elements [BBBB95]:
• management responsibility (quality policy, responsibility - authority, management review);
• the quality system (establishment and maintenance of a documented quality system);
• contract review (clear definition of contracts, existence of unusual quality requirements, feasibility of the implementation);
• design control (establishment and maintenance of procedures to control and verify that product design meets specified requirements);
• document control (establishment and maintenance of procedures to control all document and data that affect the quality of a product or service);
• purchasing (conformance of purchased materials or products, to specified requirements);
• customer supplied support (identification and isolation of customer supplied materials from any similar organization-owned items);
• product identification and traceability (establishment of procedures for the identification of the products during all stages of production, delivery and installation);
• process control (monitoring and documentation to ensure that the design is successfully
implemented);
• inspection and testing (receiving, in-process and final inspection);
• inspection, measuring and test equipment (ownership status, control, calibration and maintenance of all equipment used);
• inspection and test status (identification of the condition of product);
• control of nonconforming product (definition and documentation of the responsibility for product review and the authority for the disposition of nonconforming products);
• corrective action (detection of any suspected nonconformance and responsibility for the
undertaking of the correction of the deficiency and the prevention of its recurrence);
• handling, storage, packaging and delivery (protection of the products from damage and
deterioration);
• quality records (records used to demonstrate the achievement of the required quality and verify the effective and economical operation of the quality system);
• internal quality audits (to ensure that the quality system is working according to plan and to provide opportunities for improvement);
• training (very general requirements, practically leaving the decision of appropriate training to the organization involved);
• servicing (establishment of procedures for service after delivery, and verification that the service meets the contract's specified requirements);
• statistical techniques (for the improvement and/or control of the quality of the processes or the product).
2.4.4 Quality Function Deployment (QFD)
As reported in [Dean97], ‘the concept of QFD was introduced in Japan by Yoji Akao in 1966. By 1972 the power of the approach had been demonstrated and in 1978 the first book on the subject was published in Japanese. Unfortunately, for those of us who do not read Japanese, it was not translated into English until 1994 [MiAk94]’.
QFD [Dean97], [HaCl88], [Akao90], [Day93], [MiAk94], [BBBB95] is a team-based management tool, used to map customer requirements to specific technical solutions. This philosophy is based on the idea that the customer expectations should drive the development process of a product.
The basic tool used in QFD is the so-called ‘House of Quality’. An example of a House of Quality is shown in Figure 2.3.
W
H
A
T
s
HOWs
Technical Competitive
Assessment
Prioritized Technical
Descriptors
Customer
Competitive
Assessment
Prioritized
Customer
Requirements
Correlation
matrix
Figure 2.3. QFD, the House of Quality.
The basic methodology for building a house of quality is composed of several steps. The first step involves the modeling of the needs or expectations of the customers. This step produces a list of goals-objectives, often referred as the ‘WHATs’ [BBBB95]. It is very possible that a customer requirement is expressed rather generally and vaguely; so the initial list is refined and a second, more detailed, list of customer requirements is produced. If it is necessary, this procedure is repeated once more.
The second step involves the suggestion of technical solutions (the ‘HOWs’) which can deal with the problem that was specified at the previous step. This process can also be iterated, as it is rather hard to express detailed technical solutions at once.
The third step involves the combination of the results of the two previous steps. The basic aim of this process is to answer the question ‘how are customer requirements and possible technical solutions interrelated?’. To achieve that, the interior of the house of quality, called the relationship matrix, is filled in. Symbols are usually used, determining how strong a relationship is. It is also important to note that both positive and negative relationships exist.
The fourth step is also very crucial. It involves the identification of any interrelationships between the technical factors. The roof of the house, also known as the ‘correlation matrix’ is also filled in. All the conflicting points represent tradeoffs in the overall technical solution.
Next, competitive assessments must be made. The competitive assessments are a pair of weighted tables which depict analytically, how competitive products compare with the organization products. The competitive assessment is separated in two categories: customer assessment and technical assessment.
The following step is the definition of the prioritized customer requirements. The prioritized customer requirements are a block of columns corresponding to each customer requirement and contain


![Figure 3.1: Framework for Data Warehouse Architecture [JJQV99].](https://thumb-us.123doks.com/thumbv2/123dok_us/1838074.2766323/49.892.261.626.509.846/figure-framework-for-data-warehouse-architecture-jjqv.webp)