1
Do Borrowers Make Rational Choices on Points and
Refinancing?
by
Yan Chang and Abdullah Yavas*
*Contact information:
Yan Chang Abdullah Yavas
Freddie Mac Penn State University
8200 Jones Branch Drive, MS K484 381 Business Building
McLean, VA 22102 University Park, PA 16802
yan_chang@freddiemac.com ayavas@psu.edu
(703)903-2341 (814)865-0392
The views expressed are those of the authors and do not necessarily represent Freddie Mac or its board of director’s views. The authors are thankful to participants at the 2006 ASSA Meeting and 2006 Washington Area Finance Association Meeting for their comments.
2
Do Borrowers Make Rational Choices on Points and Refinancing?
Abstract
Mortgagors face a trade off between paying more points and a lower interest rate. The theoretical prediction is that borrowers with a higher probability of prepayment would opt for a loan with fewer points and higher interest rate. Another theoretical prediction is that once incurred, points become sunk costs, hence should not affect borrowers’ refinancing decisions in the future. Utilizing individual mortgage loan data, we find that borrowers overestimate their holding periods and pay too many points. We also find that borrowers fail to treat points as sunk costs; borrowers with points are likely to refinance “too late.”
Do Borrowers Make Rational Choices on Points and Refinancing
1. IntroductionWith most fixed-rate mortgages (FRMs), borrowers can choose to pay an upfront fee, or points, in exchange for a more favorable mortgage rate. The purpose of this study is to empirically test two theoretical predictions regarding borrowers’ point choice and their refinancing decisions. One prediction is that borrowers with a shorter expected holding period (higher probability of prepayment) would opt for a loan with fewer points and higher interest rate. The other prediction is that once incurred, points become sunk costs, hence should not affect borrowers’ refinancing decisions in the future. That is, once the difference between the contract rate and the market rate becomes large enough to make it optimal to refinance, the borrower should disregard the points paid at origination. With our data set of 3,899 individual loans between 1996 and 2003, we are able to track a loan from origination till termination and control for observable borrower characteristics as well as macroeconomic variables.
To our knowledge, this is the first empirical test of the rationality of the choices made by borrowers with respect to the points they pay and whether or not these points play a role in their future refinancing decisions. Refinancing loan volume exceeded 2.6 trillion dollars and made up 73.27% of the single-family conventional loan market in 2003. The average points and origination costs for that year were 0.6% of the loan amount, totaling 15.6 billion dollars.1 According to the 2001 Residential Finance Survey, 27% of all the single-family outstanding first mortgages have positive number of points.
1 http://www.freddiemac.com. It is also worth noting that points and origination costs were at their lowest
2
Clearly, understanding the rationality of borrowers' behavior will have significant implications for policy makers as well as pricing of mortgages by financial institutions.
Theoretical models in the literature offer different explanations for the borrower’s choice among various rates and points combinations. According to these models, points serve as: a tax shield for borrowers, a way for lenders to charge for the prepayment risk, and, in the case of information asymmetry, a screening instrument to separate borrowers of different prepayment risk types.
Kau and Keenan i1987j use tax benefits to explain the existence of points. They show that if the marginal tax rate of the lender is less than that of the borrower, points can serve as a means for the lender to increase his tax yield without increasing the after-tax cost paid by the borrower. Their model suggests that there should be a positive
relationship between points and borrower income, since individuals in higher tax brackets have greater desire to deduct points up front. There should also be observed difference between purchase loans and refinance loans because points on purchase loans are tax-deductible in the year they are incurred while points on refinance loans are amortized over the life of the loan.
A number of papers utilize the option theory to study borrowers’ point choice and refinancing decisions. The mortgage can be viewed as a callable coupon bond issued by the homeowner. When the borrower sells the house or refinances, she is exercising the option accompanying the bond and calling it at face value. For this option, the borrower pays a price above that of a non-callable bond. Points can be considered as the price of the prepayment option embedded in fixed rate mortgages. Dunn and Spatt i1988j view a typical fixed-rate loan as an adjustable-rate loan with a protective option to continue the
3
loan at the same rate. Borrowers who are less likely to prepay the loan will find this protective option more valuable, hence will self-select toward loans with high points and low rates. A similar conclusion is reached in Chen and Ling i1989j and Follain et al i1992j who compare the borrower’s expected holding period to the lender’s assumption about the borrowers’ holding period and show that borrowers who expect a shorter duration on their mortgage than the duration assumed by the lender should choose loans with fewer points.
When borrowers have private information concerning the length of their holding period of the loan, the problem of asymmetric information arises. In this case, lenders can offer a list of contracts to screen high risk and low risk borrowers. Dunn and Spatt i1988j offers a comprehensive discussion of how the terms of a mortgage contract can serve as screening devices for dealing with asymmetric information in mortgage markets. Point and rate combinations on an FRM are argued to be such a screening instrument in many studies. Chari and Jagannathan i1989j, for instance, expand the argument behind
prepayment penalty in Dunn and Spatt i1985j and show that the up-front points function as an insurance device against future income fluctuations in the event of a move. Their critical assumption is that mobile borrowers have a riskier income stream than stationary borrowers, and borrowers move when their future income realization is favorable. The likelihood of a move, or the riskiness of the borrower’s income, is private to the borrower, and the resulting separating equilibrium involves borrowers with a higher probability of a future move choosing loans with more points. However, their results contradict the results of a series of other studies such as Brueckner i1994j, Yang i1992j and Stanton and Wallace i1998j.
4
Brueckner i1994j develops a two-period model in which borrowers self-select into loans of different point and rate features according to their mobility, with more mobile borrowers choosing loans with lower points and a higher coupon. Unlike Chari and Jagannathan i1989j, the only distinguishing characteristic among the borrowers is their probability of moving and prepaying the loan, and income uncertainty is no longer a differentiating factor. Yang i1992j considers the case of a market with multiple classes of borrowers distinguished by their expected tenure, and shows that it is possible to achieve a separating equilibrium where borrowers who expect a longer residence in their houses choose a high point and low rate mortgage while those with shorter expected tenures choose a low point and high rate mortgage. LeRoy i1996j extends the asymmetric information model to include the cases of both mobility and refinancing choice. When voluntary prepayments are allowed, the points/coupon choice can only achieve a semi-pooling equilibrium, where a menu of nonnegative points and nonpositive points (but not both zero) are served. The stationary borrowers are identified through self-selection, as the mobile borrowers choose loans with nonpositive points while the stationary
borrowers are indifferent between the two choices. Stanton and Wallace i1998j also distinguish borrowers with respect to the probability of moving. They show that in the presence of refinancing costs payable by borrowers but not received by the lender, the value of the loan is always higher to the borrower than to the lender. When both asymmetric information and refinancing costs are present, it is possible to construct a separating equilibrium where borrowers are separated by type into different contracts with the stationary borrowers selecting higher points and lower coupon rates. In the absence of such costs, no such separating equilibrium is possible.
5
Empirical studies linking points selection and prepayment probability are sparse and the data typically lack either points information or termination status. For instance, the dataset in Brueckner i1994j involves points, but not the loan termination information. The sample includes 418 conventional 30-year mortgages from the National Association of Realtors Home Financing Transaction Database from 1988 to 1991. He utilizes the American Housing Survey panel data to control for a series of geographical, household and property characteristics. He then examines the relationship between the points choice and mobility and concludes that mobile borrowers choose low points. The datasets in Hayre and Rajan i1999j, Pavlov i2001j and Clapp et al. i2001j, on the other hand, involve prepayment information but not points. Focusing on the prepayment speed of GNMA mortgage-backed securities, Hayre and Rajan i1999j simulate the points paid on a pool of mortgages by comparing the weighted average coupon rate to the prevailing rate at the time of the mortgage originations. They find that the pools with average coupons higher than prevailing rates, signaling no points or low points, prepay faster than those with lower coupons. Both Pavlov i2001j and Clapp et al. i2001j assume that loans with rates lower than the prevailing market rates must have points. Pavlov i2001j finds that lower transaction costs are associated with higher refinance probability, but the
significance disappears when prepayment is due to a move and default. He concludes that borrowers expecting higher transaction costs choose loans with points to avoid future refinance. Clapp et al. i2001j incorporate borrower characteristics into their analysis, such as age, income, credit score and minority status, and report that points have
significant deterring effect on the probability of moving, but no effect on the probability of refinancing or default.
6
We use a dataset that contains both points information and loan termination information as well as various borrower characteristics, mortgage characteristics, transaction costs and macroeconomic factors. The richness of our dataset enables us to investigate the borrower’s choice of points and her decision to terminate the loan in relation to points. In particular, we address two questions. First, we examine the termination pattern of mortgages with and without points and explore if borrowers had formed accurate expectations about their holding period at the time of origination and made rational decisions regarding the amount of points they chose to pay. Second, we examine refinancing behavior of the borrowers and study if those who chose points in the beginning waited longer, i.e., required larger rate reduction, before refinancing. Given the tradeoff between points and interest rates, the borrowers who paid points will clearly have less incentive to refinance. However, once we control for the difference between the coupon rate and the market rate, the points paid at origination should be irrelevant for the refinancing decisions. We also test to see how such factors as tax incentives and
transaction costs impact the borrower’s choices.
Our results show that most of the borrowers end up taking too many points by over-estimating their holding period of the mortgage. Furthermore, we find that borrowers fail to treat points as sunk costs; borrowers with points are less likely to refinance, and when they do, they refinance “too late.” When we examine the
relationship between points and the other two forms of prepayment, moving and default, we find that points do not impact the likelihood or the timing of borrowers’ moving or default decisions. We also investigate the relationship between borrower characteristics and refinancing probability and find that older borrowers, minorities, borrowers with
7
lower credit scores, less educated borrowers are less likely to refinance. If borrowers expect rates to increase in the future, this increases their propensity to refinance.
Although the economic theory states it very clearly that only marginal cost and benefits are relevant and previously incurred sunk costs should be irrelevant, our results indicate that sunk costs do matter in refinancing decisions of borrowers. One explanation for this behavior is that borrowers dislike admitting that they would be better off had they made different points choices. Instead of simply regretting the past, they may be delaying their refinancing decisions to make their point choices look better. In fact, there is evidence that it is very common for sunk costs to play a role in decision making. Govindarajan and Anthony i1995j and Shim and Sudit i1995j, for instance, report that most firms in their surveys take into account fixed and sunk costs in pricing their products. Our results complement the existing empirical literature on the relevance of sunk costs. There is also experimental evidence that sunk costs are relevant in pricing decisions (e.g., Offerman and Potters, 2005; Dick and Lord, 1998; and Bazerman et al, 1982). Recent theoretical papers by Al-Najjar, Baliga and Besanko i2005j and Eyster i2002j offer models of behavior that provide an explanation for why sunk costs matter.2
The rest of the paper is organized as follows. We discuss the dataset in the next section. In Section 3, we study the determinants of borrowers’ point choices and whether or not borrowers pay too many or too few points. In Section 4, we investigate whether or not borrowers refinance too early or too late, and examine if borrowers treat point payments as sunk costs and not let their point payments influence their refinancing strategies. We offer some concluding remarks in Section 5.
2 Al-Najjar, Baliga and Besanko (2005) and Eyster (2002) also offer a nice review of the literature on sunk
8
2. Data
We use mortgage data provided by Freddie Mac, which include 3,899
observations of individual mortgages originated between January 1996 and December 2003. This dataset contains information on itemized transaction costs including various origination costs, yield spread premiums and discount points. As part of the practice of a control process, this dataset over-samples in loans that ended in default. Because of the fundamental differences in payment structure, valuation, and prepayment behavior
between fixed-rate and adjustable-rate mortgages, adjustable-rate mortgages are excluded from our sample, resulting in 3,785 observations. The detailed breakdown of the data by termination type and loan product type can be found in Table I.1 and I.2. About two-thirds of the sample are refinance mortgages, and the rest are purchase mortgages. A little over one-eighth of the sample took out points at origination. The distribution of points as a percentage of the loan amount is displayed in Table I.3. For those loans with points, the median number of points is 1, or 1 percent of the mortgage origination amount, and the mean is 1.2 points. Table I.4 presents the summary statistics of the variables used in our analysis.
To investigate the prepayment behavior of loans with and without points, we need to consider the three sources of prepayment separately; default, move, and refinance. One reason for doing so is that while default and move decisions are largely determined by exogenous factors that are often outside the control of the borrower, refinance decision is taken strategically by the borrower. Since the driving factors behind cash-out refinance are slightly different from those of regular rate-and-term refinance, we also pay separate attention to these two forms of refinancing. Our general prepayment information comes
9
directly from individual loan records, which show whether a loan is terminated, and if so, the date of termination, and the reason of termination, whether as a result of prepayment or REO (Real Estate Owned sale, the last stage of foreclosure where the property is taken over and put on the market for sale by creditors). From our sample, a total of 2,652 loans were terminated as of June 30th 2005.
To further categorize the terminations into move and refinance, we resort to Freddie Mac’s Conventional Mortgage Home Price Index database, where each month, loans from Freddie Mac and Fannie Mae’s purchases are pooled and matched by property address. This enables us to measure house appreciation between the two transactions and to record and pair consecutive mortgage loans on the same property. Currently there are more than 29 million such pairs in this dataset. We use this “repeat transaction” dataset to match our dataset against the first loan of the pair to further distinguish whether the loan in our dataset ended in a refinance, cash-out refinance, or termination with the sale of the house. This results in 1,370 loans that are identifiable for the four categories, move, refinance, cash-out refinance, or REO sale. The other 1,282 that are shown as prepaid are undistinguishable between the subcategories and are treated as censored observations. Almost half of the identifiable termination resulted from refinancing, with an additional twenty percent from cash-out refinancing. Moving sales take up about ten percent, with the rest 18 percent from REO sales. This particularly large sample of default cases allows us to look at the cases of move and default separately, rather than having them pooled together. From the repeat transaction dataset, we can also observe the actual rate reduction the borrower achieved through refinancing.
10
3. Analysis – Ex Ante
3.1: Is there a tradeoff between points and rates?
Before we carry out any of the analysis, we first test the validity of the assumption that there is a tradeoff between points and rates. Conventional wisdom puts the tradeoff at a reduction of 0.25 percent in the mortgage rate for each point.
Brueckner i1994j uses a regression model with the mortgage rate as the
dependent variable, and origination time, origination region and the number of points as independent variables, and finds a reduction of 0.076 percent for each point. Nothaft and Perry i2002j, using Federal Housing Finance Board’s Mortgage Interest Rate Survey (MIRS) for 1992-1995 origination years, report a tradeoff of 0.078 to 0.095 percent reduction for each point. Our approach is similar to that of Brueckner’s i1994j, except that we are able to control for borrower and loan characteristics as well as the origination time and place. For borrower characteristics, we include borrower’s FICO score for credit worthiness. Higher FICO scores are believed to be associated with more favorable
mortgage terms. We also wish to capture the borrower’s financial savvyness through education level, which is not directly available in our loan data. Instead, we use the census data to establish the population percentage with a college or higher degree for the borrower’s zip code area. We hypothesize that this variable would have a negative relationship with the loan rate as educated borrowers are more likely to engage in
comparison shopping among lenders or have more accurate expectations about mortgage rate movements to achieve a better timing of financing. Two variables are included to capture the default risk of the borrower: monthly debt-to-income ratio and loan-to-value ratio at origination. Lenders often charge a higher mortgage rate as these ratios increase.
11
We identify whether the borrower is a first-time homebuyer to take into consideration lender programs that provide first-time homebuyers with favorable rates to help them qualify. In addition to mortgage product type dummies, we indicate whether the loan in question is for house-purchase or refinance, in case these two groups are offered separate menus of mortgage choices. We also take into consideration the effect of yield spread premiums.3 Other transaction costs as a percent of loan amount are included as well.
We use four alternative specifications of points to catch their sensitivity to interest rates: 1) a dummy variable indicating if the loan has points above 0.25 percent of the loan amount; 2) number of the points as a percent of the loan amount if the number of points is above 0.25; 3) a dummy variable indicating if the loan has points above 1 percent of the loan amount; 4) number of points as a percent of the loan amount if the number of points is above 1.
The regression results can be found in table II. As expected, points are associated with a reduction in mortgage rates. However, as in Brueckner i1994j and Nothaft and Perry i2002j, the tradeoff is smaller than the conventional wisdom. Using the four alternative specifications of points given above, we find the corresponding reduction in the interest rate of 0.036, 0.078, 0.096 and 0.034, respectively, and they are all
statistically significant. There are two possible explanations for the deviation of the tradeoff form the conventional wisdom. One is that the conventional wisdom does not control for loan and borrower characteristics. The other is that borrowers are typically
3 It is a common practice for borrowers to reduce their transaction costs at the point of origination by
agreeing to pay a slightly higher rate. Part of this spread on the higher mortgage rate is paid to the mortgage broker in the form of yield spread premium, for reducing the transaction costs, such as providing broker credit to help with some of the closing costs, or providing no-cost refinances. We use the ratio of the dollar amount of the yield spread premium to the loan origination amount to capture any increase in the loan rate as a result of using this mechanism.
12
given a period of time during which they can lock in their interest rate anytime they wish. As a result, there is often a difference in the observed spectrum of interest rates offered on a given day and the contract rates originated on the same day, the rates that the borrowers locked into and were potentially offered on different days. While our dataset involves the contract rates at the time of origination, the conventional wisdom is based on the rates advertised by lenders at the time of offering. Our results also indicate that the reduction in the interest rate is not proportional to the increase in points.4
Other variables largely have the sign and significance as expected. Balloons, 15-year, and 20-year fixed-rate mortgages bear lower interest rates than 30-year fixed-rates. The borrower’s FICO score has a negative and significant impact on mortgage rates. Our proxy for borrower education, or financial savvy, is shown to have a lowering effect on mortgage rates as well. Higher loan-to-value ratio is shown to incur higher rates. Yield spread premium is positively related to mortgage rates as expected. The coefficients on other transaction costs are also positive.
3.2: Did the borrowers make rational decisions regarding points?
Having established the tradeoff between points and rates, we now examine the number of points the borrowers choose at the origination. If the justification of the choice of points lies in the mortgage payment savings from the corresponding rate reduction, the
4 As a robustness test, we have also calculated the mean effective rates from the Mortgage Interest Rate Survey (MIRS) by origination month, region, and loan product. The MIRS is a purchase mortgage only datasetthat reports in detail nominal mortgage rates, discount points, and effective rates. We match our data with MIRS data by all three criteria: origination month, region, and loan product. For each loan in our sample, we then find the rate reduction over corresponding mean rates from the MIRS data and regress it over the borrower and mortgage characteristic variables. The points are again shown to have significant, but less than the conventional wisdom, rate reduction effects. The rate reduction varies from 0.043 to 0.119 under our alternative points specifications.
13
observed number of points should reflect the expected length of the holding period during which the borrower will enjoy the benefits of the rate reduction. In order to study this question, we define the “minimum payback period” as the number of periods needed for the nominal monthly savings to add up to the dollar value of the points paid. This
definition of the minimum holding period is based on the assumption that the borrower’s discount rate is zero and that each point reduces the interest rate by 0.25 percent.5
Clearly, borrowers have positive discount rates and, as our results in Table II indicate, the reduction in the interest rate is likely to be smaller than 0.25 percent per point. These assumptions assign very generous benefits to points and hence favor the selection of points. Therefore, the actual minimum holding period required to justify points would be longer than the “minimum payback period” calculated here.
Comparing the minimum payback period to the actual length of time the borrower holds the mortgage, we find that borrowers in general over-estimate the length of their holding periods, and consequently end up paying too many points up front. Table III shows how much shorter, in months, the actual holding period was vis-q-vis the minimum payback period. To make a clear distinction between loans with and without points, we excluded all the loans with points less than 0.25. The median length of time the mortgage was prepaid before the minimum payback period is 39.3 months, or nearly 3 years and four months, and the mean is 37.2 months, close to 3 years and two months. Including the 57 observations where points are less than 0.25, 44 of which resulted in terminations, does not change the basic results. The median number of months short of
5 We use 0.25 percent reduction in the annual rate to find out what the monthly payment would be had no
points been taken out. The monthly savings in payments are then calculated comparing the actual payments made with the reduced rate and those hypothesized without the point-rate tradeoff.
14
the minimum holding period is 39.5 and the mean is now 37.5. Only 1.4 percent of the borrowers held their mortgages longer than the minimum payback period.
While the results point to a failure by borrowers to have accurate expectations regarding their holding period of the loan, it should be noted that the data covers a stretch of time marked by historically low mortgage rates that triggered record high refinancing activity. Thus, the results here can be partly attributed to the inability of borrowers to foresee the rapid decrease in the interest rates during the time period under consideration.
Turning to the borrowers that did not take out points at origination, we test whether they would have benefited from taking out points given their actual holding periods. Comparing different amounts of points with the corresponding payment savings, we find that only about 1.5 percent of the borrowers without points would have been better off with some points.
For the loans that have not been terminated by the cutoff date of our data set, 11% of loans without points would have benefited from paying points between 0.25 and 4 percent, and 16% of loans with points have been active long enough that the payment savings would have exceeded the upfront points paid. Relaxing our assumptions
regarding the rate-point tradeoff, the borrower’s tax bracket, and the borrower’s discount rate would yield even less favorable results for selecting any points. For example, if we assume that one point equals 0.125 percentage reduction in the interest rate, then none of the borrowers with positive points, including those who have not terminated their loan by the cutoff date yet, would have enough savings by the cutoff date to justify their points selection. Similarly, assuming a 10% discount rate would imply that only 0.1 percent of those without points that terminated before the cutoff date would have benefited from
15
paying points and only 5.7% of the active loans without points would have benefited from some points. Incorporating tax implications would also make the savings in
mortgage payments smaller because interest part of the payments are tax deductible while points paid on refinance loans would have to be amortized over the life of the loan and cannot be deducted in the year incurred.
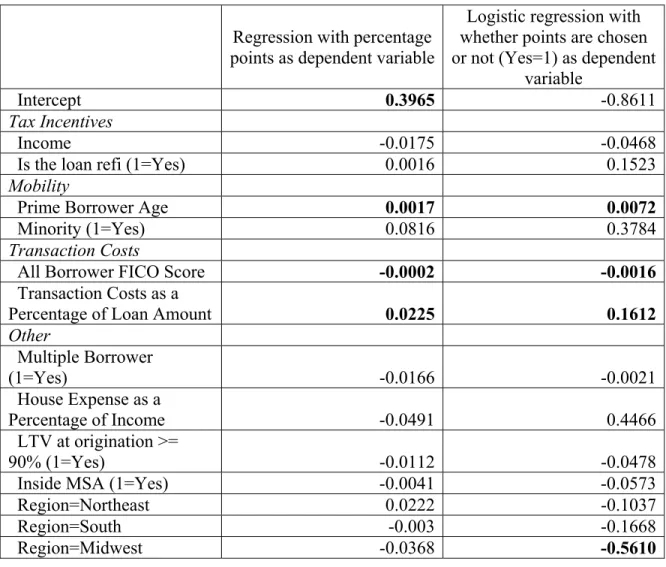
3.3: Who took out points?
We now study whether borrowers with specific socioeconomic traits are more inclined to take out positive points. We regress the number of points as a percentage of the loan amount against a series of borrower characteristics. We focus on the variables that are indicators of borrower mobility, such as income, age and minority status, and indicators of tax incentives, such as income and the purpose of the mortgage.
To control for other financial characteristics that may affect the points choice, we include the monthly housing payments-to-income ratio. This ratio is likely to be
positively correlated with points selection because those borrowers with higher payment-to-income ratios will have more incentives to reduce this ratio, or they might have even been forced to reduce this ratio in order to qualify for the loan, by decreasing their interest rate with points. Furthermore, we include an indicator of whether at the time of origination the loan-to-value ratio (LTV) is above 90 percent, as those with high LTV’s may be restrained in their ability to pay for additional points even though they may wish to do so. We also excluded loans with LTV ratios exceeding 95 percent from our analysis since it is unlikely that borrowers of these loans had the option to choose any points.6
6 With some exceptions, the LTV ratio is typically capped at 95%. This brings up the possibility that
16
We also include variables indicating the location of the residence, including whether or not the house is located inside an MSA, and the regional dummies for Northeast, South, and Midwest, leaving West as the default region.
Lastly, we consider the impact of transaction costs. We calculate transaction costs as a percentage of the loan amount and argue that borrowers with higher transaction costs would have more incentives to avoid future transactions, including refinancing, and therefore have more incentives to take out higher points to reduce their coupon rate. We also include the credit score of the borrower and whether there are multiple borrowers on the loan as a proxy for the relative difficulty of future financing. If a borrower perceives a higher hurdle of refinancing in the future, conceivably she would benefit more from taking out more points with the current loan.
Our results, as shown in table IV, indicate that the age of the borrower has the expected sign and is significant. Older borrowers are more likely to take out more points. Income does not make a significant difference, which does not support the tax incentive argument. Similarly, whether the loan was for a purchase or refinance proved to be insignificant as well, further indicating that tax consideration may not be the major reason for choosing points. Transaction costs are positively correlated with points selection, while the effect of the credit score is significantly negative, both suggesting that avoiding future costly transactions is an important consideration in points decisions.
included 90 (2.4% of the total sample) such observations. We did the analysis without excluding these loans and obtained similar results to those reported here.
17
4. Analysis – Ex Post
4.1: Do points make a difference in the likelihood of loan terminations?
We use the Cox proportional hazard model to study the survival function for mortgages. The model does not require a specification of the underlying baseline hazard function. This is distinctive from studies such as Schwartz and Torous i1989j, where the baseline functions are specified as one of several possible distributions, including, but not limited to, the log normal, log logistic, and Weibull distributions.
We study four types of termination risks: moving, refinance, cash-out refinance, and default. These four types of terminations are mutually exclusive, i.e., loan
termination as a result of one type prevents the other types of terminations from happening. As a result, when studying the possibility of one type of termination, those loans that were terminated for other reasons are treated as censored observations. All the observations that were not terminated by our cutoff date, June 2005, are also treated as censored observations.
The hazard function corresponding to the competing risks of mortgage termination is
!
"
!
"
t t T j J t t T t P t t j # $ % # & ' ( % ) # , lim , ; 0 * + , ,where j denotes one of the four competing risks in this study, moving, refinance, cash-out, or default. Assuming there are no simultaneous causes for terminations, the overall termination probability is
18
!
"
-
!
"
% % 4 1 , ; , ; j j j t t + * , + * , ,where !j is the vector of variables contributing to the termination risk j, and * is the vector of coefficients.
The survivorship function for the mortgage is
!
"
!
"
./0 12 34 %5
t u t F 0 ; , exp , ;+ * , + * .The termination time density function for termination of type j, given * is
!
;+,*"
lim!
,"
,!
;+,*" !
;+,*"
0 t t F t j J t t T t P t f j t j # % % # & ' ( % ) # .The likelihood function is proportional to
!
"
6
7
!
"
!
"
8
6
!
"
7
8
5
!
"
8
% % % 99: ; << = > ./ 0 12 34 % n i j t i i j i i i ji n i i i i i i i ji i i iF t t u du t 1 4 1 0 1 , ; exp , ; , ; , ;+ * + * , + * , + * , ? ?where ti is the observed survival time for the ith mortgage and ?iindicates if the i
th
mortgage was terminated during the observation period. If a mortgage is terminated for a particular cause in the observation period, it will be treated as censored observation in the study of other causes.
We use a proportional-hazard function to model the probability of termination due to cause j as given in the following equation:
!
+ *"
,! "
! "
+ * ,j t; , % j0 t exp j ,where ,j0
! "
t is the baseline hazard function, and exp! "
+j* shows the effect of19
we do not specify the functional form of the baseline function. Instead, the conditional probability of mortgage i being prepaid at time ti while the collection R(ti) is at risk is
!
"
!
"
! "! "
! "
! "--
@ @ % i i l Rt l i t R l l l i i t t * + * + * + , * + , exp exp , ; , ;The partial likelihood is the product over all termination cases ti
! "
! "
! "
! "8 -
@ % i l Rt l i i L * + * + * exp exp ,and the value of * is estimated with the maximum likelihood function L.
Studies of mortgage terminations usually take the contingent claims approach, as illustrated in Hendershott and Van Order i1987j, that the option to refinance the
mortgage can be valued as a call option on the mortgage and the option to default as a put option on the underlying property. In this framework, the factors that influence the borrower’s decision to exercise these options include the face value of the mortgage, market value of the mortgage, and the value of the property. The observed patterns of loan terminations often defy these option value-based predictions. Many studies in the literature have turned to other factors that may explain the observed loan terminations. The focus of attention has been on transaction costs, borrower characteristics, and economic environment. Among the works are Peristiani et al i1997j, Archer et al i1996, 1997j, Caplin et al i1997j, and Green and LaCour-Little i1999j. These studies identify declines in collateral value, credit status and other macroeconomic factors, such as unemployment, as significant factors inhibiting prepayment, and borrower characteristics such as borrower age playing an important role in predicting mobility. In our study, we control for various borrower characteristics, macroeconomic and rates environment,
20
transaction costs, and other mortgage-related characteristics to isolate the effect of points on termination risks. The details of our results can be found in Table V.
Our primary result is that points as a percentage of the original loan amount has a significant negative effect on refinancing and cash-out decisions. Thus, the higher the points a borrower chose, the less likely she will terminate the loan due to refinancing or cash-out. However, points are not a significant factor in default or moving decisions, reflecting the fact that the events of default and moving are most likely caused by exogenous factors outside the control of the borrower. This last result is contrary to the theoretical predictions that the offering of points induces self-selection among borrowers with different mobility rates.
The prepayment patterns of loans with and without points are displayed in Exhibit I, which shows that overall loans with points have lower prepayment rates than loans without points. Exhibit II shows that a similar pattern is repeated in the refinance and cash-out refinance types of terminations. However, as shown in Exhibit III, loans with and without points do not display much difference when we it comes to terminations due to moving or default.
Transaction costs are expected to be an influential factor in refinancing decisions. Higher transaction costs translate to a higher rate reduction that the borrower would need in order for refinancing to be an attractive strategy. Transaction costs are also considered to be partially responsible for the observed ‘woodhead’ behavior of the borrowers, referring to the observation that borrowers choose not to refinance even when the call option is deep in the money. We use all the fees and charges associated with the origination of the current loan, excluding points, as a percentage of the original loan
21
balance, to proxy for the expected transaction costs for a new loan origination. We find that transaction costs reduce the likelihood of refinance and cash-out refinance, but they are not a factor for the probability of moving. We also find that the probability of default increases with transaction costs. One possible explanation for this result is that high transaction costs impede borrowers from taking advantage of refinancing into lower monthly payments, hence increase their chance of running into payment problems.
We also consider variations in transaction costs across different geographical areas. According to the Lehman Brothers fixed income research i2005j, the states of New York, Florida, New Jersey and Texas have the highest refinancing costs as a percentage of the loan amount.7 We include a dummy variable that takes the value of one if a loan is originated in one of these states and find that it has a significant negative impact on the probability of refinancing and cash-out refinancing.
In addition, we consider variations in default costs across states. Six states (CA, MN, MS, MT, WV, ND) do not allow the lender to go after the borrower’s other personal possessions once the loan is in default.8 This reduces the default cost for the borrowers in those states and is expected to increase the incentive to default. This prediction is born out by our result that the dummies for the six states have a positive sign, indicating that the borrowers in these states are more likely to default. We also find a slightly increased probability of cash-out refinancing in those states, possibly suggesting that the borrowers in these states choose to increase their loan-to-value ratios at higher rates since the consequences of a default in those states are less severe.
7 The Lehman Brothers study calculations were based on a loan amount of s200,000.
22
We expect the borrower’s age to be negatively associated with move probability. The evidence on the relationship between the borrower’s age and refinance probability, however, is mixed. While LaCour-Little i1999j and Clapp et al i2001j find no significant impact for the borrower’s age, Nothaft and Chang i2005j show that older borrowers are less likely to engage in refinancing or cash-out refinancing. Our results show that the older the primary borrower at the time of origination, the less likely she will move or refinance or cash-out later on. We find no significant impact for the borrower’s age on the default probability.
We expect the borrower’s credit score to have a positive effect on the refinancing or moving possibilities, as good credit standing makes it easier to qualify for a new loan, while poor credit history restricts the borrower’s ability to refinance or move. Good credit scores should also indicate a reduced possibility of default. But the caveat is that we only have credit information at origination, while throughout the life of the mortgage the borrower’s credit could evolve in either direction. We find that the higher the combined credit score of the borrower, the more likely she will refinance or cash-out. Higher credit scores are also associated with increased move probability. We do not find a significant relationship between the credit score and default probability.
We include an indicator for whether or not one or more of the borrowers are minorities and find that minorities are less likely to refinance or cash-out, corroborating earlier results of Kelly i1995j and Nothaft and Chang i2005j. A study by Anderson and VanderHoff i1999j reports a higher default rate among black households. Their
explanation is that black households have lower home equity accumulation (due to lower house price growth in areas where minorities are more likely to live) and lower default
23
costs (due to their lower income levels). We find no significant relationship between minority status and mobility or default probability.
We also include an indicator of whether there are multiple borrowers present at loan origination. The combined income of multiple borrowers may facilitate qualifying for a refinance or cash-out refinance loan. It may also reduce the probability of default. Our results indicate that the presence of multiple borrowers at origination results in a higher probability that the loan will get refinanced, either regular or cash-out, but a lower probability of default or move.
We proxy for the borrower’s education level and financial savvyness by the percentage of high school graduates in the zip code area where the property is located. The assumption here is that a borrower’s education level is likely to be positively correlated with the education level of the other residents in that zip code area. We find that the education level has a positive impact on the probability of refinance, negative impact on the probability of default, and no distinctive effect on cash-out refinance or moving.
We use the natural logarithm of the borrower’s reported monthly gross income to study the relationship between income and prepayment probability. Consistent with Brueckner i1994j and Archer et al i1997j, we find an increased probability of moving as the borrower’s income increases. We also find a negative relationship between the income level and cash-out refinance probability but no correlation between the income level and regular refinance probability.9
9 To address the possibility that borrowers reported just enough income to qualify for the loan, i.e., the possibility that the borrower’s reported income is less than her actual income, we also merged the
24
We view borrowers with high LTV loans as being constrained against moving or refinance. They are also hypothesized to have higher default rate. Our results show that high LTVs do not have significant effect on the moving or refinance probabilities. But the higher initial LTV does deter cash-out refinance subsequently. A higher initial LTV is also associated with higher probability of default. We also include the dollar amount of the loan balance to capture the increased incentive to refinance, move or default. A larger loan is likely to create bigger savings from refinancing or default and is likely to be associated with higher moving costs. We find an accelerated rate of refinance, cash-out refinance, and moving with larger loan amounts, but the impact on default is negligible.
We use a dummy variable for investment properties to indicate if the residence underlying the mortgage is a second home or an investment property. We suspect that these properties may have a higher turnover rate than owner-occupied properties,
however we do not find a positive relationship between this variable and the possibility of moving. Furthermore, we obtain a decreased probability of both refinance and cash-out refinance associated with investor properties. We also include an indicator of the purpose of the loan, which takes the value of one if the current loan is a refinance loan of a
previous mortgage, and zero if the current loan is for a home purchase. Our results show that whether the loan is refinance or not has no effect on the probability of moving or refinancing. However, if the current loan is a refinance loan, then the borrower is more likely to engage in a cash-out refinancing later.
median family income by census tracts with our data and used the area median income as a proxy for the borrower’s income. The results do not differ substantially from those reported here.
25
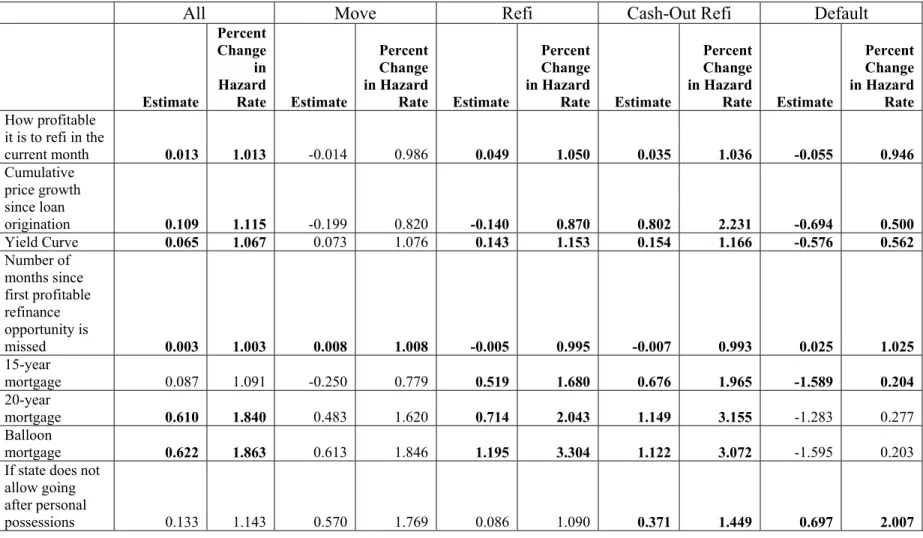
Among the mortgage types we control for, we find that balloons, 15-year and 20-year FRMs all have higher refinance and cash-out refinance risks than the 30-20-year FRMs, and 15-year FRMs have a smaller risk of default than the 30-year FRMs. We also control for whether the current loan is applied through special reduced documentation process, and find it to be linked to higher moving and default probabilities.10
To capture the impact of changes in economic conditions, we use the change in the employment rate. We take the difference between the state unemployment rate and the national employment rate, and then calculate the change in this difference for period t
and compare it to the difference at the time of loan origination. On the one hand, worsening employment situation could prompt households to move to other locations where better prospects may be found. On the other hand, a general economic downturn could prolong the time the property stays on the market in the case of move. Worsening employment situation could also make it harder for the borrower to obtain a refinancing loan (Green and LaCour-Little 1999). It could also contribute to higher default
probability. We find that if the employment situation worsens in the state relative to the country, it reduces the likelihood of refinancing but has no impact on other forms of termination.
To measure the value of the call option as an incentive to refinance, we follow Deng et al i2000j and use the ratio of the market value of the mortgage to the unpaid principal balance at time t. We calculate the difference between the value of the unpaid mortgage discounted at current interest rate and the value of the unpaid mortgage
10 Reduced documentation loans require less paperwork than the traditional loan. They carry higher interest
rates and are ideal for borrowers who are self-employed, who are citizens of another country and borrowers who have unusual property types such as log, earth or dome homes.
26
discounted at its coupon rate, or the book value of the mortgage, and divide it by the book value of the mortgage. The larger this ratio, the more the option to prepay is in the
money, and therefore one should observe a positive relationship between this ratio and the refinancing probability. Our results support this hypothesis with a positive
relationship between this ratio and both the refinancing and cash-out refinancing probabilities. We also find that a higher ratio is related to a lowered default probability, which suggests that if the interest environment is favorable, the chance of default should decrease as terminations due to refinancing will extinguish the probability of default. Moving seems to be an exogenous decision unaffected by the interest rate environment.
For the loans that are terminated for identifiable reasons, we have house values both at the loan origination and the point where the house is sold or the loan is
refinanced. For other loans, we merge the median house prices by state from the monthly Mortgage Interest Rate Survey and assume that the houses underlying the loans in our sample follow the same growth rates as the median price in that state. We find that higher cumulative house price growth accelerates cash-out refinance while reducing the
likelihood of regular refinance, as cash-outs are more motivated by the accumulation of home equity. We also find that higher house price growth deters default, as the put option on the house is more out of the money.
We capture the expectations about future rate movements through the yield curve, the difference between the current long-term yields and short-term yields. In our sample we use the difference between the 10-year constant maturity Treasury (CMT) rate and the 3-month CMT rate. We find that if borrowers expect rates to increase in the future, they are more likely to refinance or cash-out now. Expected future rate increases also decrease
27
the default risk. The reason, as Cappoza et al i1998j argue, is that an expected increase in the interest rate causes the borrower to value the current low-cost mortgage more and to be unwilling to surrender it. The only prepayment decision not affected by rate
movements is moving, further showing that moving is less of a borrower’s decision than a decision triggered by exogenous events.
We use the number of months of forgone refinance opportunity to capture other constraints a borrower may face to obtain a new loan. We measure the months of foregone refinance opportunity as follows. We first identify the month in which the savings from the difference between the coupon rate and the market rate exceed the refinancing costs. We then count the number of months it takes the borrower to refinance. Our results indicate that this burnout measure is negatively related to refinance or cash-out refinance, and positively related to move or default. This suggests that borrowers who forgone numerous refinancing opportunities have done so in anticipation of a move or default.
4.2: Do Borrowers Refinance Optimally?
In the previous section, we reported that points have a negative effect on the borrower’s refinancing probability, even after controlling for financial incentives and the possible deterring factors such as transaction costs. The delayed refinance decision could be the result of three factors: 1) since loans with points have lower coupon rates to start with, it might be more difficult to hit upon lower rates needed to make refinancing of these loans profitable, even though the rate reduction required is the same as that for loans without points; 2) the borrower procrastinates on refinancing for non-financial reasons; 3) the borrower waits for deeper rate reduction, possibly to compensate for the
28
points paid previously that had not reaped its full return yet. As pointed out earlier in the introduction, there is evidence in economics literature that agents dislike regretting their decisions and admitting their mistakes. Instead of simply regretting the past and treating the point payments as a sunk cost, they may be delaying their refinancing decisions to make their point choices look better.
If the first two factors are the case, then we should not observe a higher rate reduction in refinancing cases for borrowers with points, but if the third factor is the case, then we should consistently observe higher rate reductions when borrowers with points refinance. Therefore, it is worth examining the data further for the observations that ended in refinance. We have the interest rate information on 650 of the loans that were refinanced, which are the loans that were purchased by Freddie Mac. Table VI compares the rate reduction and time passage associated with the loans with and without points in three groups: the combined cases of refinance and cash-out refinance loans, refinance loans only, and only loans that were refinanced to the same product as before, e.g., a new 30-year FRM in place of the old 30-year FRM, or a new 7-year balloon in place of the old 7-year balloon. We consider borrowers who refinance into a different mortgage product and those who cash-out as having incentives other than purely rate-reduction driven motives. Exhibit IV displays how the cumulative prepayment rate varies with the rate reduction for loans with and without points. The difference between loans with and without points becomes even more striking for loans that were refinanced into the same mortgage product. As displayed on Table VI, loans with points on average refinance at 0.22 percentage points higher rate differential while experiencing a 3-month delay
29
compared to those without points. The results are significant at 5% and 10% level, respectively.
Since each loan is different in characteristics and the optimal rate required for refinancing is different for each loan, we need to look at individual refinancing decisions. We first calculate the range of optimal interest rate drops needed for refinancing to be in the money by utilizing the option pricing technique. We then compare to see if the actual rate reduction at the time of refinancing falls within this range we calculated. Across the sample we can then compare the percentage that refinanced too early or too late for loans with points versus those without points.
In modeling the optimal refinancing strategy, we assume a binomial interest rate environment where the interest rate either rises or falls from time t to t+1. Let U describe the increase in the interest rate in the up state and let D describe the decrease in the interest rate in the down state. As in Rendleman and Bartter i1980j, Chen and Ling i1989j and Follain et al. i1992j, we assume the logarithm of the ratio of short-term interest rates at time t+1 to the ratio at time t follows a binomial distribution, where the mean Aand variance B2are given by:
! " !
" ! "
6
U D7
N,ln 1 , ln A % & 4! " !
" ! "
6
U D7
N ln 1 ln 2 , , B % 4 4where , is the probability that the interest rate rises in the next period, and N is the number of payments per year, which will be equal to 12 in our calculations. The values of
U and D that describe the interest rate movement over time can be expressed as functions ofA,B2,,and N.
30
!
"
./ 0 12 3 9 4 : ; < = > & %exp A B N1 , , N N U!
"
./0 12 3 4 9 : ; < = > 4 %exp A B N, 1 , N N DThe value of the borrower’s callable mortgage liability at time t is
!
r,T,c0"
M!
r,T,c0" !
V r,T,c0"
M nc t
t
t % 4 ,
where r is the one-period risk-free interest rate at time t, T is the term to maturity, c0 is the coupon rate on the mortgage, Mnc
!
r,T,c0"
t is the value of a non-callable mortgage
that is identical to the mortgage in every other feature, and Vt
!
r,T,c0"
is the value of the option to refinance.The present value at time t for the borrower to hold on to the mortgage, or delay exercising the refinancing option, for another period is:
!
"
6
!
"
7
r c T r V E c T r W t t % & & 1 , , , , 1 0 0 .The value realized from exercising the refinancing option at time t is the difference between the value of the mortgage at existing coupon rate and the unpaid balance of the mortgage, net of refinancing costs:
!
r,T,c0"
M!
r,T,c0"
B!
B0,T,c0"
B!
B0,T,c0"
Gt % t 4 t 4C t ,
where Bt
!
B0,T,c0"
is the unpaid balance of the mortgage at time t and the refinancing costs are assumed to be proportional to the book value of the mortgage by a factor of C . The value of the refinancing option is therefore the greater of the exercising value and holding value of the option:31
!
r,T,c0"
max6
G!
r,T,c0" !
,W r,T,c0"
7
Vt % t t .
The borrower will refinance if and only if the value of exercising the option exceeds that of holding the option. By substituting the actual loan amount, coupon rate and transaction costs to the equation, and assuming alternative values of 0.05 and 0.15 for the standard deviation and alternative values of 0.02 and -0.02 for the mean in the rates model, we arrive at a range of optimal rate reductions needed for refinancing for each loan. Comparing this range with the actual rate reduction, we calculate the percentage of borrowers who refinanced too early or too late and how it relates to the points they paid. Table VII summarizes the percentage of ‘too early’ and ‘too late’ refinancers among borrowers with and without points. We apply Wilcoxon tests to compare whether the distribution of loans with points is the same as the distribution of loans without points with respect to the optimality of timing of refinancing. The three p-values indicate that the two distributions are significantly different at 10% level when we consider those loans that were refinanced into the same product or all refi loans. The difference becomes significant at 5% level when we also include cash-out refinance loans. Thus, we conclude that on average more borrowers with points refinance too late, i.e., wait beyond the interest rate at which refinancing becomes optimal, and fewer borrowers with points refinance too early.
One could argue that one possible explanation for the above result is that borrowers who paid points on the original loan are more likely to refinance into a loan with points, hence enjoy lower interest rates with the refinancing loan. This would make these borrowers appear to be waiting for a larger than optimal rate drop to refinance. However, this does not explain why we see time delay till refinance for these borrowers
32
(as displayed in Table VI and Exhibit II). In addition, we also compared the coupon rates on borrowers’ new loans with contemporary average rates on loans matched by the same geographical region. Controlling for other factors, we find that whether a borrower gets a better discount on the rate at the time of refinancing is not related to whether or not her original loan had points or not. The regression results are summarized in Table VIII.
5. Conclusion
Through a unique dataset that has complete information on transaction costs, points paid, and the subsequent prepayment status of the mortgages, we are able to study the rationality of borrowers’ points selection and their refinancing strategies. We find that borrowers who are less likely to move or refinance take out mortgage loans with more points. However, borrowers generally over-estimate their length of holding the mortgage, and end up paying too many points.
Contrary to prior theoretical predictions, we do not find a significant relationship between points and borrower mobility. That is, point selection by a borrower does not serve as a signal of that borrower’s mobility type. This result indicates that the decision to move arises from exogenous events and a borrower’s mobility type cannot be inferred from the number of points paid by that borrower. Similarly, tax-related incentives do not appear to play a significant role in points selection.
Instead, we find that upfront points are related to the endogenous decisions of refinancing and cash-out refinancing. Borrowers with points are less likely to refinance, and when they do, they refinance “too late.” In other words, borrowers fail to treat points as sunk costs and allow points influence their refinancing decisions.
33
The data in this study covers a period of decreasing interest rates and increasing property values. The time period under consideration should have no impact on whether or not borrowers treat points as sunk costs and correlate their refinancing decisions to the points they paid at origination. However, a part of the refinancing and cash-out
refinancing activity might be related to historically low levels of interest rates and increasing property values. Cash-out refinancing, in particular, gains popularity with the acceleration of house price growth and accumulation of home equity. An obvious
extension of the current study would be to apply it to a period of increasing interest rates and/or decreasing property values.
34
References
Al-Najjar, N., S. Baliga and D. Besanko (2005). “The Sunk Cost Bias in Managerial Pricing Practices,” Working Paper, Kellog School of Management, Northwestern University.
Anderson, R., and J. VanderHoff. (1999). “Mortgage Default Rates and Borrower Race,”
Journal of Real Estate Research 18(2), 279-289.
Archer, W., D. Ling, and G. McGill. (1996). “The Effect of Income and Collateral Constraints on Residential Mortgage Termination,” Regional Science and Urban Economics 26, 235-261.
Archer, W., D. Ling, and G. McGill. (1997). “Demographic Versus Option-Driven Mortgage Terminations,” Journal of Housing Economics 6(2), 137-163.
Bazerman, M. H., R. I. Beekun, and F. D. Schoorman. (1982). “Performance Evaluation in a Dynamic Context: A Laboratory Study of the Impact of a Prior Commitment to the Ratee,” Journal of Applied Psychology 67(6), 873-876.
Brueckner, J. K. (1994). “Borrower Mobility, Adverse Selection, and Mortgage Points,”
Journal of Financial Intermediation 3, 416-441.
Caplin, A., C. Freeman, and J. Tracy. (1997). “Collateral Damage: How Refinancing Constraints Exacerbate Regional Recessions,” Journal of Money, Credit and Banking, December 496-516.
Capozza, D. R., D. Kazarian, and T. A. Thomson. (1998). “The Conditional Probability of Mortgage Default,” Real Estate Economics 26(3), 359-389.
Chari, V. V., and R. Jagannathan. (1989). “Adverse Selection in a Model of Real Estate Lending,” Journal of Finance 54(2), 499-508.
Chen, A. H., and D. C. Ling. (1989). “Optimal Mortgage Refinancing with Stochastic Interest Rates,” AREUEA Journal 17(3), 278-299.
Clapp, J. M., G. M. Goldberg, J. P. Harking, and M. LaCour-Little. (2001). “Movers and Shuckers: Interdependent Prepayment Decisions,” Real Estate Economics, 29 (3), 411-450.
Cox, D. R. (1975). “Partial Likelihood,” Biometrika 62, 269-276.
Cutts, A. C., and R. K. Green. (2005). “Innovative Servicing Technology: Smart Enough to Keep People in their Houses?” Building Assets, Building Credit, Joint Center for Housing Studies and Brookings Institution, 348-377.
35
Deng, Y., J. M. Quigley, and R. Van Order. (2000). “Mortgage Terminations,
Heterogeneity and the Exercise of Mortgage Options,” Econometrica 68(2), 275-307.
Dick, Alan S. and Kenneth R. Lord. (1998). “The Impact of Membership Fees on Consumer Attitude and Choice,” Psychology & Marketing 15, 41-58.
Dunn, Kenneth, and John McConnell. (1981). uValuation of GNMA Mortgage Backed Securities.u Journal of Finance 36, 599-616.
Dun Dunn, K. B., and C. S. Spatt. (1985). “An Analysis of Mortgage Contracting: Prepayment Penalties and the Due-on- Sale Clause,” Journal of Finance 40, 293-308.
Dunn, K. B., and C. S. Spatt. (1988). “Private Information and Incentives: Implications for Mortgage Contract Terms and Pricing,” Journal of Real Estate Finance and Economics 1, 47-60.
Erik Eyster (2002): “Rationalizing the Past: A Taste for Consistency,” Nuffield College, Oxford.
Follain, J. R., L. O. Scott, and T. L. T. Yang. (1992). “Microfoundations of a Mortgage Prepayment Function,” Journal of Real Estate Finance and Economics 5, 197-217. Govindarajan, V. and R. Anthony (1995). “How Firms Use Cost Data in Pricing
Decisions,” Management Accounting, 76, 37–39.
Green, R. K., and M. Lacour-Little. (1999). “Some Truths about Ostriches: Who Never Refinances Their Mortgage and Why They Don’t,” Journal of Housing Economics
8, 233-248.
Green, J., and J. B. Shoven. (1986). “The Effects of Interest Rates on Mortgage Prepayments,” Journal of Money, Credit, and Banking 18(1), 41-50.
Hayre, L., and A. Rajan. (1999). “Anatomy of Prepayments: The Salomon Brothers Prepayment Model,” Advanced Fixed-Income Valuation Tools, John Wiley w Sons, Inc. 216-264
Hendershott, P., and R. Van Order. (1987). “Pricing Mortgages: An Interpretation of Models and Results,” Journal of Financial Services Research 1, 77-111.
Johnson, K. H., R. I. Anderson, and J. R. Webb. (2000). “The Capitalization of Seller Paid Concessions,” Journal of Real Estate Research 19(3), 287-300.
LaCour-Little, M. (1999). “Another Look at the Role of Borrower Characteristics in Predicting Mortgage Prepayments,” Journal of Housing Research 10(1), 45-60. Lehman Brothers. (2005). Mortgage Strategy Weekly, December 5, 2005.
36
LeRoy, S. F. (1996). “Mortgage Valuation Under Optimal Prepayment,” Review of Financial Studies 9(3), 817-844.
Nothaft, F. E., and V. G. Perry. (2002). “Do Mortgage Rates Vary by Neighborhood? Implications for Loan Pricing and Redlining,” Journal of Housing Economics 11, 244-265.
Nothaft, F. E., and Y. Chang. (2005). “Refinance and the Accumulation of Home Equity Wealth,” Building Assets, Building Credit, Joint Center for Housing Studies and Brookings Institution, 71-102.
Offerman, T. and J. Potters (2005). “Does Auctioning of Entry Licenses Induce Collusion? An Experimental Study,” University of Amsterdam.
Pavlov, A. D. (2001). “Competing Risks of Mortgage Termination: Who Refinances, Who Moves, and Who Defaults?” Journal of Real Estate Finance and Economics
23(2), 185-211.
Peristiani, S., P. Bennett, G. Monsen, R. Peach, and J. Raiff. (1997). “Credit, Equity, and Mortgage Refinancings,” Federal Reserve Bank of New York Policy Review July, 83-99.
Rendleman, R. J., and B. J. Bartter. (1980). “The Pricing of Options on Debt Securities,”
Journal of Financial and Quantitative Analysis, 11-24.
Richard, S., and R. Roll. (1989). “Prepayments on Fixed Rate Mortgage-Backed Securities,” Journal of Portfolio Management 15(3), 73-82.
Schwartz, E. S., and W. N. Torous. (1989). “Prepayment and the Valuation of Mortgage-Backed Securities,” Journal of Finance 44(2), 375-392.
Shim, E. and E. Sudit (1995). “How Manufacturers Price Products,” Management Accounting, 76, 37–39.
Stanton, R., and N. Wallace. (1998). “Mortgage Choice: What’s the Point?” Real Estate Economics 26(2), 173-205.
Yang, T. L. T. (1992). “Self-Selection in the Fixed-Rate Mortgage Market,” Journal of the American Real Estate and Urban Economics Association 20(3), 359-391.
37
Table I. Sample Description I.1. Termination Type
Reason for Termination Frequency Percent
Move 146 10.7
Refinance 677 49.4
Cashout Refi 299 21.8
REO Sale 248 18.1
Other/Active thru 12/2004 2415 NA
I.2. Mortgage Product Type
Loan Product Frequency Percent
5-Year Balloon 107 2.8
7-Year Balloon 80 2.1
15-Year Fixed Rate 986 26.1
20-Year Fixed Rate 229 6.1
30-Year Fixed Rate 2383 63.0
I.3. Points Selection
Number of Points Number of Observations Percent of Population
0 3265 86.3 x0 and y=0.25 74 2.0 x 0.25 and y= 0.5 84 2.2 x 0.5 and y= 1 149 3.9 x 1 and y= 1.5 74 2.0 x1.5 and y=2 76 2.0 x2 and y= 2.5 17 0.4 x2.5 and y= 3 21 0.6 x 3 25 0.7
38
I.4. Descriptive Statistics
Variable Mean Minimum Maximum
Gross annual income s68,191 s20,304 s268,608 House price s167,545 s38,000 s584,000 Primary borrower’s age 43 22 88 Credit score 693 533 804 Loan-to-value at origination 74% 24% 95% Mortgage rate 7.00 4.75 9.00 Original loan amount s115,282 s25,700 s300,000 Transaction costs (excluding points) as a percentage of loan amount 1.9 0.0 5.0 Percentage of sample First-time homebuyer 11.2% Multiple borrower 62.4% Minority borrower 17.6% Investor property 7.3% Inside MSAs 68.6%