Food Choice and Nutrition in Fiji
28
0
0
Full text
(2) 1. Introduction The focus of nutrition studies in developing countries has traditionally been on problems of under-nutrition: insufficient calories to meet human requirements or insufficient micronutrients resulting in health problems. These under-nutrition problems are still an important health and development issue in many Pacific Island nations but, paradoxically, these under-nutrition problems exist alongside a growing number of health problems associated with over-nutrition (SPC 2002). In some countries, such as Nauru and Tonga, over-nutrition is now the dominant health problem. In other countries, like Fiji, diseases related to over-nutrition are not as wide spread as in Nauru or Tonga but they are increasing in significance, both economically and socially (Dalton and Crowley 2000). Over-nutrition results in obesity that is in turn related to a range of non-communicable diseases including cardiovascular disease, diabetes, hypertension and some cancers. These diseases are particularly important in the developing countries of the Pacific region for two reasons. First, there is evidence that the citizens of these countries are particularly prone to obesity due to their genetic makeup. Swinburn (1995) has argued that Pacific Islanders possess a “thrifty gene” that enables them to rapidly convert excess calories into body fat. The presence of this gene relates to the historical advantage that this characteristic gives to individuals and groups who are confronted with volatile food supplies. Second, these diseases have the potential to impose substantial economic costs upon the region. The countries of the region are generally low income and resource poor in comparison to developed countries. The growth in the incidence of noncommunicable diseases, such as diabetes and heart disease, has resulted in the diversion of scarce government funds to the treatment of these non-communicable diseases. In capital scarce countries, the real opportunity cost on government funds can be substantial as funds are channelled away from education, infrastructure development, treatment of communicable diseases and other public uses with high social rates of return. The growth in the prevalence of obesity and obesity-related diseases could also be expected to reduce the effective labour force available to support economic growth. Obese workers will tend to be less productive on average than workers without weight problems because they tend to have less durability, use more sick leave, and have shorter working lives. Increases in obesity are inevitably a result of changes in both food consumption patterns and/or rates of physical exercise (Mudur 2003). In Fiji, both factors have probably been important. In terms of food consumption, it has been argued that Fijians have tended to reduce their consumption of nutrient dense foods, such as taro (also known as dalo), which have a high level of basic nutrients relative to their level of calories. These foods with high nutrient density, which were staple items in the traditional Fijian diet, have declined in dietary importance relative to calorie rich foods with low nutrient density, such as mutton and rice (Owen 1999, Coyne 2000).. 2.
(3) Moreover, as incomes have risen in developing countries, the total calorie intake tends to increase also (Gibson and Rozelle 2000). At the same time that total calorie intake has been growing, the extent of physical activity undertaken by people in developing countries has probably been decreasing (Coyne 2000, WHO 2003). This decrease in physical activity could be attributed to the steady shift of the population out of physically demanding employment in rural areas, into more sedentary jobs in urban areas. Fiji is an interesting case to explore from an obesity policy perspective. The prevalence of obesity is widely believed to be increasing and, if international experience is any guide, is likely to continue to do so. At the same time obesity has not reached the epidemic standards of other countries in the region such as Nauru, American Samoa or Tonga. This comparatively early stage of the population in the obesity process, along with the ready availability of a wide a range of foodstuffs, raises the prospect of an effective and efficient policy intervention. This paper analyses the factors driving the growth in obesity in Fiji and explores the potential for governments to influence the extent of obesity by changing the pattern of food consumption. This could take the form of policies that influence the type of food consumed and/or the level of food consumed. While policies aimed at changing the levels of physical activity may be both feasible and important, they are not addressed in this paper. The focus of this paper is on individual food choice, Government food policy and how they interact to influence obesity. The prevalence of obesity in Fiji and the factors determining the extent of obesity are analysed in Section 2 of this paper. This analysis uses data collected from an individual household survey covering food consumption patterns, obesity levels and reasons for food choice. It will be shown that, given the current policy mix, obesity is likely to continue to grow over time. Importantly from a policy perspective, the survey data indicate that that relative food prices are an important factor underpinning food choice in Fiji. Evidence on the trends in relative food prices and the factors driving those trends are presented in Section 3. A framework for addressing policy in this area is developed in Section 4 and some tentative policy directions based on influencing food choice are proposed. The major findings of this study are summarised in Section 5.. 2. Obesity in Fiji Obesity is not a new problem for Fiji. Data from surveys conducted as early as 1958 have shown that substantial proportions of the Fijian population are obese or overweight. Tables 1 and 2 summarise the key features of the available data on obesity in Fiji. The data presented in these tables is based on the Body Mass Index (BMI). The BMI is defined as: Score = weight (kgs)/Height2 (metres). The BMI is a standard measure of nutritional status and scores of 20 to 25 are generally interpreted as a healthy weight. Scores in the rage >25 to <30 are classed as. 3.
(4) overweight while scores of >30 indicate obesity. In the case of Fijians, the recommended standard for a health weight for males is 22 to 27 (females 20 to 25) while a score of greater than 32 is considered to indicate obesity in male Fijians (greater than 30 for females). Somewhat surprisingly, data gathered in surveys from 1958 to 2000 suggested that the average BMI of the population of Fiji has changed little since the late 1950s. This applies to both males and females, and Fijians and Indo Fijians. While there is no evidence of a trend in the means of BMIs, the surveys reported in Table 1 do suggest that substantial numbers of Fijians and Indo Fijians are overweight or obese and that this is not a new phenomenon. Moreover, the data provide evidence that the urban population tends to be more overweight than the rural population. There is consistent evidence of this relationship for male and female Fijians and male Indo-Fijians. The extent of the difference appears to be around 2 units on the BMI scale. A somewhat different impression is gained from an examination of the data on the proportion of people exceeding the healthy weight range. (See Table 2.) Care needs to be taken in interpreting Table 2 because the two earlier studies (1958-70 and 1980) were based on regional samples while the two most recent studies were based on national surveys. The data in Table 2 confirm that, for the last 30 years at least, the population of Fiji has been characterised by substantial number of people who are overweight of obese. A comparison of the data from the 1993 national survey and the 2001 national survey are consistent with the notion that obesity is becoming more common. The most recent survey is consistent with obesity being more prevalent amongst females than males, Fijians than Indo-Fijians and urban dwellers than rural dwellers. These relationships were tested statistically through the estimation of a regression equation based on the data from the 2001 survey. This survey was a random sample drawn from lower middle to upper middle-income earners. Low-income earners were not included in the sample as it was felt they had no effective power to determine their own consumption. This group live in poverty and have few food choices. The sample comprised 116 households containing 346 people aged 18 or over. There were equal numbers of urban and rural households with a similar ethnic split (65 Fijian households and 58 Indo-Fijian households). The basic theoretical model is based on the notion that individual BMIs are determined by individual decisions on calories consumed and the extent of physical activity undertaken and genetic factors such as those linked to ethnicity and sex. However, direct data on income and physical activity were not collected in the survey so the actual estimation model relies on proxies for these variables. The estimation model reflecting these hypothesised relationships and the actual availability of data is: BMI = fn(age, ethnicity, sex, employment, region, urban) where age = age in years ethnicity = dummy variable taking the value of 1 if the respondent is Fijian sex = dummy variable taking the value of 1 if the respondent is male. 4.
(5) employment = a vector of 5 dummy variables used to categorize the employment of the respondents into one of the following categories: trades, manual worker, farm, house duties, professional/administration/sales and no employment. region = a vector of three dummy variables used to categorize respondents on the basis of which of the four Divisions they normally reside in. urban = dummy variable taking the value of 1 if the respondent normally resides in an urban setting. The age variable is expected to have a positive sign reflecting the fact that as people age they tend to undertake less exercise and become wealthier. The higher levels of wealth allow higher calorie intakes. There is strong evidence that Fijians tend to have higher BMI scores than Indo-Fijians. This is probably a reflection of genetic makeup and cultural norms. Similarly, it is expected that women will have higher BMIs than men, reflecting different genetic factors and levels of physical activity. The employment dummy variables reflect the combined influence of income and physical activity associated with different types of employment. The higher income, lower physical activity employment categories such as professional employment would tend to be associated with higher BMI scores. The regional dummies are included to capture regional differences in diet and other cultural factors. Finally, the urban dummy is expected to have a positive co-efficient because urban dwellers tend to have a more sedentary life style than rural residents and they tend to be higher income earners. The regression results are presented in Table 3. The regression model was estimated initially in its full form for the whole of the sample. Variables that were clearly insignificant were then omitted to yield a final model. The final model was reestimated separately for sub-samples based on sex and ethnicity to highlight the impact of these factors on the measured relationships. Again, clearly insignificant variables were omitted from the final models. One of the important points that are revealed from an analysis of the results in Table 3 is that the degree of explanatory power of all models tested was fairly low. The models generally explained around 20 per cent of the variation in BMIs between respondents to the survey. While the degree of explanatory power was low, the significance and signs on the coefficients support basic relationships hypothesised. In terms of the age - BMI relationship, there appears to be a noticeable difference between sexes but not between ethnic groups. BMIs increased with age but the rate of increase differed significantly between men and women. While the BMI of men tended to increase at a linear rate, the BMI of women increased at a diminishing rate. Overall, women tended to have significantly higher BMI scores than men. Model 2 shows that after accounting for the other variables in the model, the BMI of men was 2 units higher than for women. There is some evidence that this relationship is stronger for Indo-Fijians than Fijians but the coefficient on Sex*Ethnicity is only marginally significant. Location in terms of region and urban/rural were found to be significant. Respondents from Region 3 tended to have lower BMIs than those from other regions. This was most marked for women, both Fijian and Indo-Fijian. There was some evidence to. 5.
(6) support the notion that urban environments were associated with high BMI scores and this was most apparent for Fijian females and Indo-Fijian males. The coefficients on the employment category variables supports the notion that people involved in higher paid sedentary jobs tended to have higher BMIs than those in lower paying jobs requiring more manual exertion. An important implication that comes from the models in Table 3 is that as people shift from rural areas where they are relatively poor and engaged in employment that requires substantial physical effort, to urban environments where they will have higher paying jobs that tend to be comparatively sedentary, the BMIs of the Fijian population can be expected to increase. However, the rate of increase that can be expected is not likely to be disastrous. For example, urban dwelling Fijians involved in office work have on average a 2.87 unit higher BMI than rural, manual working counterparts. (1.95 due to being urban and Fijian plus 0.92 (or 3.26-2.34) due to being a Fijian involved in office work.) In the case of Indo-Fijians, there is not significant increase in BMI from being located in an urban rather than rural location but office workers and trades people are both likely to have BMIs more than 3 units higher than Indo-Fijians involved in manual labour. Importantly, the results are consistent with there being considerable variation in the BMIs of all categories of Fijians and Indo-Fijians. This means that while one would expect a 40 year old Fijian female office worker who lived in the urban environment of Suva to be obese on average (average BMI = 31.52), substantial numbers will still be in the healthy weight category. This means differences in individual genetics and behavioural decisions are very important determinants of BMIs. While the individual importance of these factors cannot be isolated in this study, the existing variation is at least consistent with the notion that policies that influence the food consumption and physical activity decisions of individuals can have a significant and substantial impact on the BMI of the citizens of Fiji. Owen et al (2002) reviewed the evidence from the 2001 ACIAR survey on food preferences. They found that Indo-Fijian families lived on a predominantly rice and flour based diet motivated by liking for the product and perceived value. Ease of preparation did not appear to be a factor motivating high consumption of rice and flour based foods but preparation problems and time was the key reason given for the relatively low frequency of consumption of traditional Fijian foods such as taro and cassava. Cassava, rice and bread were the most frequently consumed staples for Fijian families. Perceived value and ease of preparation were the main reasons given for the frequent consumption of these items. Root crops such as taro, yams, kumala and green vudi were consumed less frequently because they were perceived to offer poor value for money spent. In closer examination of the reason for food choice, Owen et al (2001) found that of those Fijian households who usually purchased root crops, nearly 40 per cent indicated that they considered taro was an expensive food while more than 50 per cent that they considered cassava to be an inexpensive food item. These results are consistent with the own price elasticities of demand for basic staple food items being substantially higher than zero. Unfortunately, there are no published. 6.
(7) estimates of the values of the price elasticity of demand for food in Fiji. There is however, some evidence from other developing countries to support the hypothesis that price elasticities for staple food items are high when compared with the elasticities of staple food items in developed countries. For example Timmer and Alderman (1979) estimated own price elasticities of demand for rice in Indonesia ranging from –0.74 for high-income earners up to –1.92 for low income earners. Similarly, Deaton (1988) found similarly high estimates for the price elasticity of demand for food items in the Ivory Coast. Deaton’s elasticities ranged from –0.91 for cassava up to –1.49 for yams.. 3. Relative Food Prices The prices of a range of foods that are widely consumed in Fiji are presented in Table 4. These prices are volatile and they do not all appear to be highly correlated. For example, over the period 1987 to 1993 vegetables such as Rourou, Taro and Cassava increased substantially (79%, 95% and 224% respectively). Over the same period lamb (and mutton) prices increased by only 22%. In Figure 1 trends in the price of Taro relative to the prices some imported and manufactured foods are compared. From this chart it appears that the prices of lamb, rice, canned mutton and coca cola all seemed to be reasonably correlated with each other. Moreover the prices of all four food items fell markedly when compared with taro prices up to 1994. Beyond 1994 taro has tended to become cheaper than these imported foods. The longer-term movements in food prices are probably a reflection of a number of factors including local climatic variability, exchange rate changes and world market price volatility for traded goods, and changes it domestic preferences. To understand what factors have been driving price trends, the trend in prices needs to be contrasted to the trend in consumption. For example, increases in the price of taro between up to 1994 could be due to contraction in supply, caused by disease problems or land shifting into alternative uses, or an expansion in demand due to consumers becoming wealthier. If the increase in price is supply driven (perhaps from a shift in land into other crops) the food policy implications are very different to those associated with a demand driven increase in price (due to increases in consumer incomes). In general terms, a positive correlation between price and quantity in a competitive market implies that demand shifts are outweighing supply shifts1. On the other hand, a negative correlation implies that supply shifts are outweighing demand shifts. When a time plot yields a horizontal line, demand and supply shifts have tended to move in the same direction and have moved by the same amounts. Finally, a vertical time plot shows that shifts in one curve have been balanced by shifts in the opposite direction for the other curve. Data on the consumption of locally produced food is difficult to obtain in Fiji. Government agencies do not collect time series of production or consumption data for foods that are predominantly produced by small holders. This applies to most fruit and 1. One of the general conditions referred to here is that supply and demand curves are conventionally sloped at the range of process that is experienced.. 7.
(8) vegetables consumed. The most reliable time series of food consumption relates to imported foods and locally processed food and this is presented in Table 5 along with the official data series for the consumption of taro and cassava. In the case of lamb, there appear to be two distinct segments to the time period. Up to 1995 both price and quantity are basically stable suggesting little change in supply or demand. Since 1995 prices have increased steadily while consumption has been fairly stable. This later period is consistent demand growth offsetting contractions on the supply side. Lamb (and mutton) is imported and the price quantity pattern reveals that fluctuations in the world sheep meat market and/or exchange rate movements have been important. There is a positive correlation between canned fish prices and consumption. Canned fish prices have increased moderately over time while consumption has fluctuated widely around a strong upward trend. This pattern is consistent with demand shifts in favour of canned fish over the period of 1992 to 2001. In the case of flour products there is a clear picture of stable prices and a steady and strong growth in demand. This is suggests that both supply and demand have been growing steadily together. The data on both taro and cassava need to be treated with caution, as the robustness of the quantity data is questionable. For taro, the period up to 1994 is consistent with strong demand growth (rapidly rising prices and a strong growth in consumption) while the more recent period has probably been dominated by supply growth (lower prices and higher consumption). The period 1992 to 1997 was characterised by strong consumption growth for cassava and no apparent trend in prices. This suggests supply and demand had been growing together. Since 1997, consumption has tended to tapper off as prices have fluctuated. This is probably reflective of small reductions in both supply and demand.. 4. A Policy Framework The trend towards increasing obesity in Fiji is the end result of an amalgam of social, cultural and economic factors. Over time, people are tending to move from relatively low paid, physically demanding lifestyles in the country to relatively highly paid, sedentary lifestyles in the city. As their incomes grow they can afford more food and they are tending to shift their consumption pattern away from foods with high nutrient density towards higher calorie foods. At the same time, their changed lifestyles are tending to reduce their overall calorie requirements. These factors are reinforced by advertising and general promotion of the more processed, high calorie foods. In some countries the trend towards a more obese population has been partly ameliorated by a cultural bias against being overweight. This negative bias is not as strong in Fiji as it is in developed countries. It could even be argued that the traditional Fijian perception of size as an indicator of status and wealth serves to encourage even greater obesity. (Matiangi et al (1995) provide some evidence that the traditional merit attached to size may be diminishing.) Underpinning all these factors is a less than perfect. 8.
(9) understanding of both the implications of personal choices on obesity and the implications of obesity for personal health and well being. In developing policies to reverse or slow this trend, it is important to acknowledge that while obesity may be a problem in a number of countries, the factors that are driving this trend are likely to differ in nature and severity between countries. Moreover, the costs of the problem and resources available to deal with the problem could also be expected to differ markedly both between countries and over time. The implication of these country specific differences is that while the nature and extent of public policy to deal with obesity in Fiji should be informed by the experience of other countries, the optimal policy response should reflect the problems, environment and resources in Fiji. Moreover, the policy mix that is appropriate now may not be appropriate in the future. Obesity is a complex problem and no one policy instrument can hope to adequately address the underlying driving factors. The optimal policy solution is likely to represent a raft of initiatives formulated in the context of the relative importance of the underlying influences promoting obesity and the relative costs of the alternative government interventions. The diagram in Figure 2 represents a simple portrayal of the obesity policy dilemma in Fiji. This diagram represents obesity as an essentially behavioural issue. Individuals on the whole like to consume tasty food and they prefer more to less. They also dislike physical effort. The curve MPB represents the marginal private benefits that individuals derive from recreational eating and or avoiding exercise. In effect it shows that people derive a personal benefit from expanding their BMI. This marginal benefit declines as ones BMI expands and is exhausted once the individual’s BMI reaches J. This means there are no positives from allowing your BMI to grow beyond J. While there are positives associated with an increasing BMI there are also negatives. The curve MPC represents the perceived value of those private costs in the absence of any government intervention. Once an individual’s BMI reaches D, they will perceive that higher BMI scores come at a personal cost. This cost could be lost enjoyment from physical activity, reduced employment activities, loss of self-esteem, or the possibility of increased disease risk. Given this information a rational person would manage his/her diet and exercise so as to achieve a BMI of F. One could expect that people would not plan to grow beyond F as the private costs of doing so would exceed the benefits that come from the associated extra food and/or relaxation. If they found themselves beyond F, perhaps due to some miscalculation, they could be expected to take actions to try to reduce their BMI back to F. MPC represents an individual’s perception of the private costs of obesity in the face of less than perfect information about the consequences of obesity. If the individuals are fully informed they would realise that the true marginal costs of obesity are higher. MPC* represents the fully informed perception of private costs.. 9.
(10) With full information individuals would not plan to exceed a BMI of E. The effect of the new information is to make individuals aware that if their BMI exceeds B, rather than D, they will begin to suffer private costs. The shift from F to E is the policy response that could be expected to come from an active and effective education and information policy. Instruments such as public education, branding, and food nutrition labelling have been pursued in many countries with this objective in mind. In Fiji, there is an active program of educating schoolteachers in basic nutrition principles. The study of basic nutrition is part of the syllabus at all primary and government secondary schools. The government also funds a system of nutrition field staff that operates at the local community level supported by the National Food and Nutrition Centre. Other community education programs exist for diabetes prevention. Education and information programs are also an important part of the health promotion programs in developed countries, such as the USA and Australia. The evidence from these countries suggests that these programs will not prevent obesity. However, given they tend to be relatively low cost, these policies represent an obvious starting point to deal with that part of the obesity trend that flows from ignorance of what causes obesity and what the health consequences really are. It is not clear what impact could be expected from an education and information program in Fiji. The expected impact will depend on the extent to which the following conditions are met: • that information imperfections are corrected; • that the correction of those information imperfections raises demand for good food relative to bad food; • that the supply of good food is price elastic enough to allow a substantial part of the demand shift to translated into consumption changes rather than price increases; and, • that the demand for the good food is price inelastic enough to ensure that any consequent increase in the price of the good food does not substantially dampen down consumption. In developing countries, such as Fiji, education levels and the extent of understanding about nutrition and exercise are probably lower than in most developed countries. Given that the effectiveness of public information programs is likely to be negatively correlated with the existing public health information base, it would be expected that the impact of public health eduction on food demand would probably be higher in Fiji than in developed countries. The extent to which any consequent change in food demand is translated into actual consumption shifts rests primarily on the responsive of both food producers and food consumers to changing food prices. When the production of desirable foods is largely unresponsive to price changes, shifts in demand in favour of nutritionally desirable foods will have little impact food consumption. Under these conditions, the extent of any demand shift motivated by health policy will tend to be translated into higher prices for nutritionally beneficial foods rather than higher consumption. How these higher food prices influence final consumption will, in turn, depend on how consumers respond to any policy induced increase in price. In effect, the prospect of 10.
(11) increasing the consumption of beneficial foods due to education or information initiatives rests on the targeted foods having a relatively high own price elasticity of supply and/or a relatively low own price elasticity of demand. Empirical estimates of either the elasticity of demand or the elasticity of supply for nutritionally beneficial foods (or any foods) in Fiji are virtually non-existent. While there may be a role for public information programs, improved information will only motivate people to aim for food and exercise programs that will maximise their own wellbeing (point E in Figure2). This means that if obesity results in public costs not borne by the individual consumers, they will aim for a BMI score that is higher than the socially optimal level. In Figure 2 the vertical distance between MPC* and MPS* represents costs flowing from the expansion in the BMI of an individual, that the individual does not meet. These costs could include some of the medical costs associated with the increased risk of diseases, such as diabetes and heart disease. Individuals suffer costs from these diseases but the public sector meets additional costs associated with medical care and hospital treatment. The true socially optimal level of obesity in this case is C. Importantly, information will not prompt a rational individual to aim for this level. (This point is acknowledged implicitly by Khaleghian (2003)). The gap between E and C will depend mainly on just how important these external costs are. In Fiji, where public capital is a very scare commodity, the cost of caring for a rising number of citizens with non-communicable diseases associated with obesity is high. Currently, non-communicable diseases account for 39 per cent of the total Fijian health care budget (Dalton and Steven 2000). The cost of diverting more public funds into these health problems is less funding for other health programs, lower funding for education, less investment in development infrastructure and lower funding for law and order. These costs could become substantial as obesity grows over time. For example, in Tonga where obesity rates are substantially higher than in Fiji, around 60 per cent of the total health budget is devoted to treating non-communicable diseases (Dalton and Steven 2000). The extent of this externality will depend on how hospital and medical expenses are funded. If the patients meet all medical and hospital costs, this gap would not exist. However, where these costs are met from public funds and the collection of these funds is not targeted at those sections of society that are likely to fall ill, the gap could be substantial. Fiji fits into the latter category. If it is not politically, fiscally or socially desirable and/or feasible to force individuals to meet most of their health costs, there are limited policy options open to governments to curb the growth in obesity. An obvious step would be to restrict promotion that advocates socially undesirable activities and to encourage the promotion of socially desirable activities (Khaleghian 2003). For example, the imposition of restrictions on the advertising of certain foods on children’s TV programs has been widely suggested in Australia as have programs promoting an active lifestyle. These policies would tend to shift the MPB curve to the left and. 11.
(12) therefore move the private BMI target towards the socially optimal level. However, restricting advertising is politically difficult and its impact is untested. The promotion of healthy lifestyles is not as politically difficult but its likely impact on target groups, such as middle aged Fijian women, is far from clear. The only real alternative would be to use price signals to change the individual’s food consumption and exercise decisions (Khaleghian 2003). In this context, the removal of price distortions that serve to encourage obesity would be a low cost starting point. For example, Torlesse et al (2003) have recently highlighted the potential importance of understanding how government policy influence food price signals in dealing with nutrition problems in Bangladesh. Food prices are linked together through food markets and resource markets. Government intervention in one aspect of the food system can have unintended price impacts in other areas of the system that can, indirectly encourage obesity. For instance, government support for the one industry will tend to shift resources, such as land and labour, into that industry out of other industries. Production in the industry that loses resources will fall and output prices will tend to rise. A current policy initiative in Fiji is to encourage the growth of the dairy industry and this is being achieved in part through tariff protection and extension support. One would expect that if this policy is successful, land will move out of the production of other food items that are produced domestically, and the prices of these other food items will tend to rise. At the same time, the restriction on imported milk products will tend to raise the value of the Fijian Dollar, which will in turn reduce the price of other imported foods. Therefore, one of the end results of supporting the domestic dairy industry is likely to be a change in relative food prices making imported foods cheaper than domestically produced food. Given a relatively high set of own price elasticities of demand for food items, this could have a significant impact on food choice. Policy areas that need to be reviewed to identify potential price distortions include the general distribution of research and extension funds, government production subsidies and trade restrictions and subsidies. One of the distinctive characteristics of the Fijian public revenue system is its relatively high dependence on import duties. While less than 1 per cent of total government revenue in Australia comes from tariffs, excise revenue accounts for nearly 20 per cent of government revenue in Fiji. This dependence seems set to stay despite the recent introduction of a broad-based consumption tax. Further, the potential to expand the income tax base is constrained by the dual nature of the economy. The current set of excise duties involves four tax levels ranging from 25 per cent to zero. This revenue raising system changes relative prices between imported items as well as between imported items and domestically produced goods. As many food items of concern to health authorities are imported, an analysis of the dietary implications of the current system seems warranted. In general terms, the imposition of import duties will create distortions that result in efficiency losses to the economy and an optimal set of import duties would equate the marginal distortion cost across the different import categories. This idea can be seen in the case presented in Figure 3.. 12.
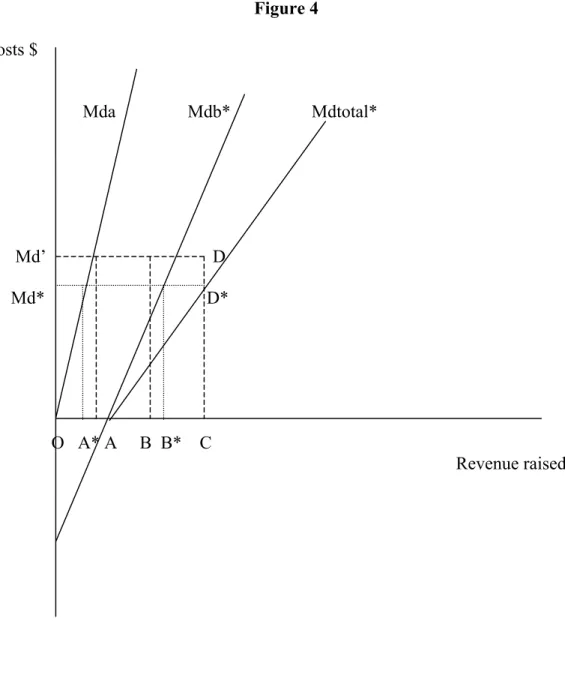
(13) The curves Mda and Mba represent the marginal distortion costs from raising revenue on two import goods, good a and good b. These two curves have been summed horizontally to give Mdtotal, the minimum total cost associated with raising any sum of revenue. For example, if the government needs to raise $C from import duties the optimal spread of the source of the revenue would be $A from good a and $B from good b. The total cost of raising this $C would be equivalent to the area ODC and any change in the relative burdens between goods a and b would raise this cost. Good b has a higher tax burden because the relative slopes of the supply and demand curves mean that import duties tend to produce lower dead weight losses when they are sourced from good b rather than good a. For example, the steeper the demand curve the less will be the production distortion created from a tariff. Therefore an optimal tariff structure would result in more revenue being sourced from products with inelastic demand curves. In the case of Fiji we potentially have the added issue of health budget externalities to consider. Good a is now assumed to be a non-food item with no externality implications while good b is assumed to be a “bad” food. (See Figure 4.) Over some range, the imposition of a tax on good b creates gains in efficiency, not losses. If the government has the same target level of import revenue ($C), the optimal spread of the source of that revenue will now change. Taking into account the externalities will mean the government ought to raise more tax from good b than was the case before and less tax should be raised from good a. Note, both the marginal distortion cost and the total cost of raising the revenue is now lower than before. In effect, to ignore the presence of the externality and only raise B from good b would raise the total social cost of the import duty regime. While there is no evidence that the Fijian government has used import duties to influence food prices with a view to changing dietary choice, in 2000 they did ban the import of mutton flaps in an attempt to stop the consumption of that food. Mutton flaps are high in animal fats and have been seen to reflect the most obvious manifestation of a “bad” imported food. Although the ban on mutton flaps did not totally stop the consumption of the product, the price of mutton flaps did rise. Taxes on food for dietary reasons have recently been considered in developed countries. (For example see Marshall (2000) and Santarossa and Mainland (2003).) However, the relationship between food intake, obesity and disease is complex and care needs to be taken in assessing public intervention. For example, Kennedy and Offutt (2000), among others, have argued that the fat tax proposal is regressive and ineffective. This type of tax regime is likely to be ineffective if its only impact is to shift consumption between food items without changing the overall calorie intake. It is argued that fat taxes are regressive because poorer people spend a higher proportion of their income on food and poorer people tend to suffer most from obesity. In the case of Fiji, the validity of these arguments is far from clear. Shifting consumption from calorie rich foods to nutrient dense foods can be expected to change overall calorie intakes and therefore is likely to reduce obesity. In terms of regressiveness, the poorest sections of society do not suffer from obesity to the same extent as the middle to higher income groups. Furthermore, the poorer. 13.
(14) sections of society tend to consume relatively low levels of foods that are high in fats. On the other hand, some cheap high fat foods may be an important and relatively harmless form of energy for the poor, physically active members of the community. Taxing these foods more heavily may reduce the obesity amongst the middle-income sectors but at the expense of the nutrition of the poorest group. However, in countries such as Fiji, the government is already heavily reliant on a set of potentially distorting food taxes. In this context the question is not whether a fat tax would be ideal, but whether a fat tax would be a better option to the current tax regime. The answer to these questions rests in part on an understanding of what different groups in society actually eat. This basic information is currently not available for Fiji. In this context the proposed national nutrition survey is of critical policy significance. The overall impact of taxes on consumption patterns will be influenced by the own price elasticity of supply as well as the responsiveness of consumers to higher food prices. Taxing food at the retail level will decrease demand for food. The more responsive food supply is to reduced prices that greater will be the impact of the food tax on final consumption. In the context of obesity in Fiji, the undesirable foods are mostly imported and have virtually infinitely elastic supply curves. This increases the likelihood that taxing undesirable foods could be a viable policy. Finally, regardless of what group in society is obese and what group suffers obesity related disease, the diversion of resources out of education, other health activities and other areas that foster economic growth and development will be at the expense of the poor in society. To this extent obesity and its associated costs are highly regressive in terms of their real impact on Fijian society.. 5 Policy Implications and Concluding Comments Obesity appears to be a growing problem in Fiji. The available evidence points to an increase in the average BMI of both Fijians and Indo-Fijians as they change their lifestyles towards one associated with less physical activity and a higher calorie intake. The potential health implications of this trend can be expected to have significant social implications if the growth in obesity is not adequately addressed in the government’s public policy mix. The risk is that scarce public funds will be increasingly diverted from critical development areas such as education and training, and infrastructure development, to deal with the outcome of growing obesity. The nutrition-obesity-disease system represents a complex policy problem that calls for a unique policy response that reflects the problems, costs, social environment and political realities of Fiji. The simple application of the developed country response to the Fijian problem is unlikely to represent a first best response. The social, education and health environment of Fiji is markedly different to that of Australia or the USA. Consequently, specific policy responses need to be developed rather than copied from overseas. This policy development is hindered by a lack of basic information about what, and how, much people eat, why they make their food choice decisions and how 14.
(15) much, and why, they undertake physical activity. Some of this basic policy information has been revealed in this project and more will become available when the results of the national nutrition survey are released. However, basic data collection and analysis remains a high policy priority. One of the findings from this study has been the potential importance of relative prices in driving food choice. In developing countries, people on constrained budgets are highly sensitive to changes in relative food prices. This sensitivity needs to be considered when government is reviewing food, taxation and agricultural policy settings. Food consumption and agricultural production decisions are linked through the prices created in food and resource markets. Government policy development needs to explicitly consider how policy decisions work through markets to influence food prices. The current policy of supporting the growth of the dairy industry is an example of a policy initiative that could have a significant unintended food price impact. Similarly, the structural change that could accompany the adjustment of the sugar industry to future market conditions has the potential to have a substantial effect on relative food prices and hence food consumption decisions. There is no published information on the actual responsiveness of individual household consumption to changes in relative food prices in Fiji. This is basic information that is necessary to facilitate the refinement of food policy decisions. Some priority needs to be given to research that will produce reliable quantitative estimates of these elasticities for different consumer groups in Fiji. Similarly there is an obvious need for more information on the price elasticity of supply for nutritionally beneficial foods such as taro. The effectiveness of nutrition education and information campaigns rests on the targeted foods having relatively elastic supply curves and relatively inelastic demand curves. Therefore, knowledge of both supply and demand elasticities are necessary to assess the likely impact of these information orientated policy interventions. In this paper the main emphasis has been on the role of individual food choice and its implication for obesity. The other aspect of the equation is the level of physical activity. While this is in part determined by employment, it is also determined by individual options and choices. These options and choices are influenced by a diverse range of factors such as government policy towards education, recreation and urban development. An appropriate policy response to obesity will involve a systematic appraisal of how these policy areas interact to influence the physical activity decisions of individuals in all age groups. The optimum policy mix will equate the return at the margin from public expenditure on all those related areas that influence obesity. At the present time the policy infrastructure in Fiji does not readily facilitate an integrated analysis of complex problems such as the obesity-health problem. Policy development in this area involves the co-ordination of a number of different government policy departments/authorities and the incorporation of contributions from a wide range of disciplines. This policy co-ordination could be improved in the long run if formal steps are put in place to explicitly encourage and foster consideration of a wider systems perspective on food policy. To this end, it may be. 15.
(16) worth considering the extension of the roles of the Fijian National Food and Nutrition Centre and/or the Secretariat of the Pacific Community’s Community Health Programme to a more multidisciplinary focus, along the lines of the International Food Policy Research Institute in Washington. Also, consideration could be given to requiring nutrition impact assessments for policy changes. These assessments could be modelled on the environmental impact assessments that are now commonplace in many countries. Ex ante and ex post nutritional impact assessments need to be carried out on all policies that have the potential to influence individual food and physical activity decisions. The ex post evaluation of outcomes is critical when policies are being formed by policy makers with far less than perfect information. Also, it is particularly important when there is a tendency to pick up policy ideas from overseas. There are strong potential parallels between imported plants and animals and imported policies. Importing plants from overseas is risky because they can become weeds in a different ecosystem. Similarly, policies that may work well in one country have the potential to cause damage in another setting characterised by different economic and culture conditions. A formal ex post policy evaluation regime is a potential safe guard against potentially “feral or pest” policies. Further, the establishment of an applied food policy journal focusing on Fijian and Pacific Island issues may be worthwhile. This journal could encourage multidisciplinary interaction between professional field workers and policy staff in the areas health, nutrition, treasury management and agricultural policy in the various Pacific Island countries. In the final analysis it is likely that even the best policies will not stop obesity growing in Fiji. Moreover, the cost of doing so would probably be too great even if it were feasible. Therefore, obesity will probably continue to grow and the role of policy should be to moderate the rate of growth to reflect the costs of obesity relative to the value of alternative uses for public funds. The split between obesity-health management and obesity prevention will be part of the final mix. However, the cost of obesity prevention can be reduced through careful policy analysis. The potential magnitude of the obesity problem is great enough to suggest that the return from this analysis can potentially have a substantial impact of the quality of life of the wider Fijian population.. 16.
(17) References Coyne, Terry (2000), Lifestyle Diseases in Pacific Communities, Secretariat of the Pacific Community, Noumea. Dalton, Andrew and Steven Crowley (2000), “Economic Impact of NCD in the Pacific Islands”, a paper presented at the workshop on Obesity Prevention and Control Strategies in the Pacific, Apia, Western Samoa, September 26-29. Deaton, Angus (1988), “Quality, Quantity, and Spatial Variation of Price”, AmericanEconomic-Review; 78(3), pp.418-30 Gibson, John and Scott Rozelle (2000), "How Elastic is Calorie Demand? Parametric, Nonparametric, and Semiparametric Results for Urban Papua New Guinea", Agricultural & Resource Economics Department. ARE Working Papers. Working Paper 00-022,UC Davis. Kennedy, Eileen and Susan Offutt (2000), “Commentary: Alternative nutrition outcomes using a fiscal food policy”, British Medical Journal, 320, pp. 304-305. Khaleghian, Peyvand (2003), “Noncommunicable Diseases in Pacific Island Countries: Disease Burden, Economic Cost and Policy Options”, a report prepared for The Secretariat of the Pacific Community and The World Bank, Noumea. Marshall Tom. (2000) “Exploring a Fiscal Food policy: the case of diet and ischaemic heart disease, British Medical Journal, 320, pp. 365-373. Matangi, H., B Swinburn, P Craig, T Matenga-Smith, G Vaughan (1995),”Do Pacific Islanders still believe that "Big is Beautiful"? Body size perceptions among Cook Islanders”, Asia Pacific Journal of Clinical Nutrition, 4(4), p. 368 Mudur, Ganapati (2003), “Asia grapples with obesity epidemics”, British Medical Journal, Vol. 326 p515. Owen, Kate (1999), “What do we know of consumers’ preferences and food choices in the islands of the South Pacific?”, contributed paper to the 43rd Annual Agricultural and resource Economics Society Conference, Christchurch, 20-22 January. Owen K., P. Vatucawaqa and J. Chand (2002), “Fijian Preferences for Staple Foods”, a working paper presented to the Fiji Food Choice Workshop, Suva 4-6 June. Santarossa, John M., and David D. Mainland (2003), “Employing an Environmental Taxation Mechanism to Reduce Fat Intake”, in W. S. Chern and K Rickertsen eds., Health, Nutrition and Food Demand, CABI Publishing, Wallingford. SPC (Secretariat of the Pacific Community) (2002), Obesity in the Pacific: Too Big To Ignore, SPC, Noumea.. 17.
(18) Swinburn, Boyd (1995), “Insulin resistance and low metabolic rate: do they cause obesity?”, Asia Pacific Journal of Clinical Nutrition, 4(4), pp. 343-344. Torlesse, Harriet, Lynnda Kiess and Martin W. Bloem (2003), “Association of Household Rice Expenditure with Child Nutritional Status Indicates a Role for Macroeconomic Food Policy in Combating Malnutrition”, Journal of Nutrition, Vol 133, pp 1320-1325. Timmer, C. Peter and Harold Alderman (1979), “Estimating Consumption Parameters for Food Policy Analysis”, American-Journal-of-Agricultural-Economics, 61(5) pp.982-94 WHO (World Heath Organisation) (2003), “PHYSICAL ACTIVITY: Sedentary Lifestyle: a global public health problem”, http://www.who.int/hpr/physactiv/sedentary.lifestyle1.shtml, accessed 10 October.. 18.
(19) Group Fijians urban rural All Fijians Indo-Fijians urban rural All IndoFijians. Group. Table 1 Mean Body Mass Index by Ethnic Group and Gender 1958-70 1980 1993 2001 Male Female Male Female Male Female Male. Female. na 24 na. na 25 na. 26 26 26. 28 26 27. 26 25 25. 28 27 27. 28 25 26. 29 26 27. na na na. na na na. 23 22 22. 24 24 24. 22 21 22. 24 23 23. 24 22 23. 24 25 24. Table 2 Proportion of Adults Overweight or Obese % 1958-70* 1980** 1993** 2001** Male Female Male Female Male Female Male Female. Fijians urban na na na na na rural 35 58 na na na All Fijians na na 32 64 27 Indo-Fijians urban na na na na na rural 4 22 na na na All Indona na 11 38 18 Fijians * BMI>26 ** For Fijians BMI>27 and for Indo Fijians BMI>25. na na 47. 53 29 41. 68 54 61. na na 34. 28 15 22. 39 52 45. 19.
(20) Table 3 Regression Results: Coefficients and test results Variable. Model 1 Full sample. Model 2 Full sample. Model 3 Fijian Male. Model 4 Fijian Female. Constant. 17..51 (0.00) 1.83 (0.51) 0.34 (0.00) -0.003 (0.04) 0.02 (0.60) -2.09 (0.07) 2.51 (0.10) -1.66 (0.37) 0.24 (0.91) -2.44 (0.20) 0.68 (0.76) -2.49 (0.15) -0.54 (0.79) 0.15 (0.87) 2.53 (0.04) 3.45 (0.07) -3.28 (0.17) 3.17 (0.10) -11.63 (0.00) -0.39 (0.82) -3.45 (0.13) 1.18 (0.47) -2.72 (0.20) 0.82 (0.53) -2.88 (0.09) 346 0.23 0.00 0.62. 16.14 (0.00) 2.51 (0.01) 0.33 (0.00) -0.002 (0.05). 27.90 (0.00). 12.17 (0.01). 0.07 (0.03). 0.59 (0.02) -0.005 (0.13). Ethnicity Age Age. 2. Age*Ethnicity Sex Sex*Ethnicity Region1 Region1*Ethnicity Region2 Region2*Ethnicity Region3 Region3*Ethnicity Urban Urban*Ethnicity Admin Admin*Ethnicity Trades Trades*Ethnicity Farm Farm*Ethnicity Manual Manual*Ethnicity Unemployed Unemployed*Ethnicity. Model 5 IndoFijian Male 17.95 (0.00). Model 6 IndoFijian Female 14.55 (0.00). 0.09 (0.01). 0.43 (0.05) -0.003 (0.17). -2.00 (0.02) 1.93 (0.11). -1.97 (0.18) -1.27 (0.03) -2.30 (0.07) 1.95 (0.01) 3.26 (0.03) -2.34 (0.22) 3.28 (0.02) -10.00 (0.00). 2.15 (0.07). -10.90 (0.00). -3.08 (0.01). -6.50 (0.00). -2.04 (0.09) 1.30 (0.22) 3.57 (0.02). 2.86 (0.07). -3.22 (0.03) -1.35 (0.15) 346 0.24 0.00 0.43. -4.18 (0.00) 93 0.23 0.00 0.59. Number of Observations 100 Adjusted R-squared 0.21 Prob(Fstat) 0.00 Prob(White Corrected Heteroskedasticity) Figures in parentheses are probability of individual regression coefficients equalling zero.. 82 0.13 0.00 0.35. 71 0.19 0.00 0.45. 20.
(21) 21.
(22) Table 4 Food Prices and the CPI: 1985 to 2002 CPI Non-Food All Food. 1985 1986 1987 1988 1989 na na 100 na na na na na 100 na na na na 100 na. Bread (long)400g Plain Flour 4kg Rice 5kg Lamb Chops 1kg Chicken (Frozen) 1kg Canned Mutton 340g Canned Fish 425g Fish kawakawa 1kg Cabbage (chinese) 1kg Tomato 1kg Rourou 1kg Dalo 1kg Cassava 1kg Split Peas 1kg Pineapple 1kg Pawpaw 1kg Coca Cola 275ml Butter 500g Ghee 2kg Milk (powdered) 500g Curry powder 150g Ice Cream 2lt Restaurant meal 1 serve. 35.7 197.5 397.4 246 321.3 156.1 65.9 323.2 56 91.5 56.2 54.4 22.3 77.9 49.2 35.4 51.2 162.9 403.3 234.8 61.2 166.8 237.3. 40.3 256.2 523.9 292.4 304.7 186.6 78 318.5 56.6 120.9 53.6 54.9 21.6 95.2 51.4 32.6 59.3 211.1 482.5 341.4 68.8 182 270.4. 44.5 332.6 554.6 302.4 334.1 201.5 82.8 341 66 179.9 53.3 53.1 19.9 100.3 57.1 39.5 61.3 228.2 528.3 355.1 69.6 192.4 294.5. 1990 1991 1992 1993 1994 1995 1996 1997 1998 1999 2000 2001 2002 Na na na na 138.1 na 103 na 116 118.3 119.6 124.7 125.6 Na na na na 133.6 na 104 na 115.6 118 122 127.4 128 Na na na na 146.9 na 101.2 na 116.7 118.8 115 119.7 120.3 46.8 335.8 528 323.3 430.2 207.3 87.7 383 73.3 147.6 61.4 83.9 44.9 99.3 68.5 58.4 65.8 252.9 569.3 345 75.8 241.9 329.8. 47 311.2 509.5 308.5 436.5 231.4 92.1 435.3 86.8 191 54.3 76.8 49.3 90.7 90.5 76.8 73.8 225.9 530.2 306.5 77.8 258.5 339.6. 50.8 354.9 508.1 296.3 426.9 242.2 94.5 470.7 73.4 133.3 65.5 82.3 38.5 80.6 89 82.2 75.7 210.8 610.9 306.2 83.8 265.5 367.6. 54 360 488.2 300.9 419.2 235.5 100.4 540.7 103.2 155.4 100.4 105.9 72.2 80.5 98.7 126.4 75.7 199.2 700 312 87.4 271.6 394.3. 54 386 532 298 438 219 108 510 84 115 76 160 52 85 72 109 80 202 647 295 99 400 403. 54 334.1 551.3 302 428.2 215.6 106.7 510.8 73.6 167.2 75.2 99.2 43.9 88 89.9 81.1 76.7 206 691.4 324.7 101 413.8 396.1. 57.6 378.2 589.7 338.9 441.7 250.1 109.8 484 76.4 228.5 67.5 93 34.3 85 81.3 66.8 64.2 229.3 773.2 325.8 101 435.1 395. 59.4 362.5 553.3 354.3 444.3 241.7 103 533.6 99.3 244 79.8 120.6 70.7 91.2 100.5 98.8 70 225.8 743.5 321.6 103.3 425.4 397.6. 59.3 376.6 656.3 372.4 517.7 239.2 113.4 580.3 92.8 220.2 85.3 106.3 48.9 110.1 105.7 78.6 70 257.2 782.6 323 128.9 486.6 424.1. 59.1 354.1 599 356.7 527.6 243.3 116.7 523.7 134 279.1 74.1 92.3 46 94.7 96.3 75.6 75.6 252.4 827.6 333.4 136.4 370.3 424.1. 58.1 58.2 307.3 356.3 513.3 517.5 368.2 475.3 531.8 528.8 243.4 262.2 107.5 120 626.1 663.2 129.3 117.3 358.7 338.3 80.7 78.2 91.6na 62.1na 95.1na 102.4na 126.8na 80 80 259.2 261.9 787.2 785.5 315.4 377.7 137.4 153.3 412.2 431.5 426.1 435.1. 55.8 375.5 509.8 568 532.3 274.3 120.7 641.8 153.8 347.6 81.8 79.8 64.2 97.8 117.1 100.8 98.3 266.2 784.8 367.9 148.3 435.7 445.5. na = not available. 22.
(23) Table 5 Trends in Apparent Consumption of Food Items Beef lamb Canned fish Dalo Cassava Flour Rice. 1992 3353.3 11939 1197.4 3817.3 7478 36274 51951. 1993. 1994 3366.4 10698 900.4 5053.1 14806 44583 46525. 1995 1996 1997 4053.1 3884.2 4966.9 10828 9470 9296 2444.3 8785.6 7744 4575.8 14807 16445 8411.8 29936 30587 43605 48878 50590 53984 42355. 1998 1999 4940 6065 9781 9479 1285 5214 19344 19961 27187 19596 57078 51715. 2000 3949 11960 8650 26851 25443 44675. 2001 4141 9579 15796 17533 26638 50668. 23.
(24)
(25) Figure1 Food Prices Relative to Taro Price 2 1.8 1.6 1.4. Rice Lamb Canned Mutton Coca cola ice cream. 1.2 1 0.8 0.6 0.4 0.2. 01 20. 99 19. 97 19. 95 19. 93 19. 91 19. 89 19. 19. 87. 0. Price of food items divided by the price of taro.. 25.
(26) Figure 2 Benefits and costs MSC* MPB MPC* MPC. B. C D E. F. J. BMI. 26.
(27) Figure 3 costs $ Mda. Mdb. Md’. Mdtotal. D. O. A. B. C Revenue raised $. 27.
(28) Figure 4 costs $ Mda. Mdb*. Md’. D. Md*. D*. O A* A. B B*. Mdtotal*. C Revenue raised $. 28.
(29)
Figure


Related documents
In our “Present Value” estimates, we used as instruments, the fit and its one period lag of the difference of the weighted present value of the fundament (the mark-up over real
In fact, as indicated in a letter of Michel-Simon to André Thouin dated January 15 of 1799 (folder 68/11 deposited in the archives of the Library of the Natural History Museum of
01-Oct-2018 Version 17 Changed Overview, Standard Features, Preconfigured Models, Configuration Information, Core Options, Additional Options, and Memory sections were updated.
This paper describes our experiences using Active Learning in four first-year computer science and industrial engineering courses at the School of Engineering of the Universidad
Such a collegiate cul- ture, like honors cultures everywhere, is best achieved by open and trusting relationships of the students with each other and the instructor, discussions
• Pour lancer CameraWindow sous Windows Vista ou XP, cliquez sur [Télécharge des images de l’appareil photo Canon avec Canon CameraWindow] sur l’écran affiché lorsque vous
That is, all File Transmission Status File(s), Electronic Front-End Response File(s), and any previously generated Download Log(s) will be transmitted to you... You will be prompted
Other readings (not required): Pearson, Neil D., 2002, Risk Budgeting: Portfolio Problem Solving With Value-at-Risk (New York: John Wiley & Sons), Chapters 11, 12, and 13;
