Volume 17 | Issue 1 Article 28
12-3-2018
Simple Unbalanced Ranked Set Sampling for Mean
Estimation of Response Variable of Developmental
Programs
Girish Chandra
Indian Council of Forestry Research and Education, [email protected]
Dinesh S. Bhoj
Rutgers University
Rajiv Pandey
Indian Council of Forestry Research and Education
Follow this and additional works at:https://digitalcommons.wayne.edu/jmasm
Part of theApplied Statistics Commons,Social and Behavioral Sciences Commons, and the Statistical Theory Commons
Recommended Citation
Chandra, Girish; Bhoj, Dinesh S.; and Pandey, Rajiv (2018) "Simple Unbalanced Ranked Set Sampling for Mean Estimation of Response Variable of Developmental Programs,"Journal of Modern Applied Statistical Methods: Vol. 17 : Iss. 1 , Article 28. DOI: 10.22237/jmasm/1543856083
doi: 10.22237/jmasm/1543856083 | Accepted: June 20, 2017; Published: December 3, 2018. Correspondence: Girish Chandra, [email protected]
Simple Unbalanced Ranked Set Sampling
for Mean Estimation of Response
Variable of Developmental Programs
Girish ChandraIndian Council of Forestry Research and Education Dehradun, India
Dinesh S. Bhoj
Rutgers University New Brunswick, NJ
Rajiv Pandey
Indian Council of Forestry Research and Education Dehradun, India
An unbalanced ranked set sampling (RSS) procedure on the skewed survey variable is proposed to estimate the population mean of a response variable from the area of developmental programs which are generally implemented under different phases. It is based on the unbalanced RSS under linear impacts of the program and is compared with the estimators based on simple random sampling (SRS) and balanced RSS. It is shown that the relative precision of the proposed estimator is higher than those of the estimators based on SRS and balanced RSS for three chosen skewed distributions of survey variables.
Keywords: Impact factor, gamma distribution, lognormal distribution, ranked set sampling, relative precision, response variable, skew distribution, survey variable, Weibull distribution
Introduction
Government and non-government organizations implement development programs such as education programs, women empowerment programs for enhancing gross enrollment ratio in school, or eradication of polio in children up to age five under different phases. These programs are usually implemented in successive phases, such as years, depending upon the volume and scope, as well as the geographical spread of the units on which the program has to be implemented. There are two variables associated with such programs. One variable is called the survey variable,
S. The survey variable changes under the impact of the program over different phases and this changed variable is called the response variable, R.
Baker (2000) discussed various case studies of different countries on developmental programs. In 1995, Argentina implemented a type of employment program under the support and supervision of the World Bank called TRABAJAR. TRABAJAR was introduced in three phases in the years 1996, 1997, and 1998, and these phases were called TRABAJAR I, TRABAJARI II, and TRABAJARI III, respectively, with the aim to reduce poverty by simultaneously generating employment opportunities for the poor and improving social infrastructure in poor communities. This program was meant for workers with relatively low wages or unemployed workers. Baker discussed the TRABAJAR evaluation process by using random selection from household survey data to assess the income gains to TRABAJAR participants. For achieving the goal, Baker considered the variable ‘net income gains’ instead of conventional assessments of workfare programs, which typically measure participants’ income gains as simply their gross wages earned.
The measurement of income or income gain from respondents is difficult in actual practice because the respondents generally hesitate to give exact income gains. Hence, the use of conventional sampling methods such as SRS is not appropriate to evaluate such programs. The income of the participants in a certain community before any phase of the program is implemented is called a survey variable, S. The net income gain of the participants after implementation of the program is referred to as the response variable, R. In this process we can also estimate the impact of the program for each phase of the program. Although the income is difficult to measure accurately we can rank it by using the impact of the program in each phase and then use the ranked set sampling (McIntyre, 1952) procedure to estimate the mean of the response variable. In the next section, we will introduce the linear impacts of the program under successive phases.
In ranked set sampling (RSS), precise estimation of the mean of R also depends on the skewedness of the distribution of the survey variable S (Kaur, Patil, & Taillie, 1997). It is revealed in literature that the S pertaining to developmental programs follows highly-skewed distributions with heavy right tail, e.g. excellence (Simonton, 1999, 2003), gain in sports (Vaeyens, Lenoir, Williams, & Philippaerts, 2008), or academic gain (Granger & Kane, 2004).
In this paper, an attempt is made to estimate the mean of R by using the RSS procedure on the survey variable, S, when S follows a highly skewed distribution. For highly-skewed distributions, the procedure of unbalanced RSS in which allocation of the rank order statistics would be proportional to the standard deviation of the corresponding rank orders is more suitable than the balanced RSS; see Kaur et al. (1997). Accordingly, we propose a systematic allocation model for
the unbalanced RSS when S follows a skewed distribution. In the following sections of the paper, we (i) derived the relations between the means and variances of S and
R by using SRS; (ii) reviewed the balanced and unbalanced RSS procedures in the context of the present problem; (iii) proposed a simple formula to determine the unequal replications; (iv) derived the formulae for relative precisions of our estimator with estimators based on SRS and balanced RSS procedures; (v) presented numerical computations of relative procedures for three highly skew distributions; and (vi) finally, the results of the paper with discussion is presented.
Notations and Assumptions
The impact of the ith phase of the k-phased developmental program follows an arithmetic progression. That is
( )i k:
( )
1I = + −a i d (1)
where a and d are positive real numbers. Impacts have a cumulative nature with respect to the successive phases and therefore will be in ascending order, with the lowest impact at first phase and the highest impact at the kth phase.
The model for the relationship among R, S, and I was proposed by Stokes (1977) and Chen, Bai, and Sinha (2004):
= +
R SI ε (2)
where R, S, and I represent the vectors of R, S, and I, respectively, for all successive phases of the program, and ε is a vector of random error with mean 0 and unknown variance ε2 which is independent of S. It is also known that the impact value for the first phase of R and S are same and equal to 1, which implies that a = 1. Further, the method of estimation of R through S and I under SRS is explained as follows:
Consider (S1, S2,…, Sn), a simple random sample of size n on S with population mean μS and a finite population variance S2 irrespective of the phases. The standard unbiased estimator of μS is
( )
(
( ))
2 srs srs 1 1 ˆ with Var ˆ n S i S S i S n n = =
=R C S = (3) where
(
)
(
2 1)
2 a n d C= + − The unbiased estimator of μR in terms of the Si is given by( )srs
(
(
)
)
1 1 ˆ 1 n i R i a i d S n = =
+ − with ( )(
)
2(
(
)
)
2 2 2 1 srs 1 Var n i S S R R a i d D n n n n = =
= + − = where(
)
(
)(
)
2 1 2 1 2 1 6 n n D=a + n− ad+ − − dBalanced and Unbalanced Ranked Set Sampling Methods
RSS is a method for improving precision in estimation of the population mean using ranking of the units based on some concomitant variable. Ranking of the units is rather easy and inexpensive in comparison to the actual measurement of the units (McIntyre, 1952). For development programs, the impact variable, I, may be used for ranking the units of S. The RSS approach facilitates for the impact evaluation of R by considering the ranking of observations based on the realized impacts of the phases.The procedure to obtain a ranked set sample of size k for balanced RSS involves randomly drawing k subsets, each of size k, from the population. The units are then ranked within each subset by using the judgment, visual inspection, covariates, or any other method not requiring actual measurements. The unit with the lowest rank is measured from the first set, the unit with the second lowest rank
from the second set, and this procedure is continued until the unit with the highest rank is measured from the kth set. The k2 ordered observations in k samples can be displayed as ( ) ( ) ( ) ( ) ( ) ( ) ( ) ( ) ( ) 11 12 1 21 22 2 1 2 , , , , , , , , , k k k k kk S S S S S S S S S K K M K
We measure only k (S(ii), i = 1, 2,…, k) observations and they constitute RSS. These
k observations are independently but not identically distributed. The important feature of RSS is that it is more structured than SRS sample. Hence, it gives a better estimator of the population mean than the one based on SRS. In RSS, k is usually small and therefore, to increase sample size, the above procedure is repeated m≥ 2 times to get a sample of size n = mk. Takahasi and Wakimoto (1968) proved that the relative precision (RP) of balanced RSS with respect to SRS lies between 1 and (k + 1) / 2. Dell and Clutter (1972) also showed that the RSS estimator is more precise than the SRS estimator even in the presence of ranking errors.
Let S(i:k)j (≡S(ii)j) and R(i:k)j, i = 1(1)k, j = 1(1)m, denote the value of S and R,
respectively, for the unit taken for measurement belonging to the jth cycle of the ith
rank order (in our case the ith phase). Under the multiplicative model (2), we have:
( )i k j: ( )i k j: ( )i k: ( )i k: R =S I +
where ε(i:k) is the random error term with mean 0 and unknown variance 2 which
is independent of S(i:k)j.
For fixed i, (1) impact of all m units are same, and (2) realizations corresponding to the ith phase of both the variables R and S are independently and identically distributed with respective means μR(i:k), μS(i:k) and variances R i k2( ): ,
( )
2 :
S i k
, respectively. Under balanced RSS, the unbiased estimator of μR is given below, as proposed by Chandra et al. (2018):
( )bal ( ): 1 1 1 ˆ k m R i k j i j CS mk = = =
where C is given by (3). Using the property of RSS that ( )
( )
: 1 1 E k m S i k j i j S mk = = =
we may verify that E
(
ˆR( )bal)
=R. The variance of the estimator is given by( )
(
)
( ) 2 2 bal : ˆ Var R C S k mk = where ( ) ( ) 2 : 1 2 : k S i k i S k k =
=is the average within rank order variances of S.
The RP of the above estimator with SRS estimator ˆR and sample size n = mk
is ( )
(
)
( )(
)
( ) 2 srs bal 2 2 : bal ˆ Var RP ˆ Var R S S k R D C = = RSS is a cost-efficient method of sampling that gives better estimators of the population mean than SRS. The benefits of RSS can be improved by using appropriate allocation models, especially when the distributions under consideration are highly skewed. The Neyman criterion achieves a substantial gain in precision over the balanced RSS procedure; see Kaur et al. (1997). However, this method depends on unrealistic assumption that the population standard deviations of the order statistics are known. Bhoj (2001) proposed RSS with unequal samples to estimate the population mean.
The RSS for the estimation of the mean of R may further be improved by taking appropriate allocation from each phase. Suppose mi (≠ 0) units are taken for measurement corresponding to the ith phase, i = 1(1)k. This gives total sample size
1
k i i
n=
= m . Using the approach of Takashi and Wakimoto (1968), the unbiased estimator of μR for unbalanced RSS is given by(ubal) 1 1 ˆ k i R i i T k m = =
where ( ): 1 i m i i k j j T CS = =
The variance of this estimator is given by
( )
(
)
2 2( ): ubal 2 1 ˆ Var k S i k R i i C k m = =
(4)Proposed Allocation Model for Response Estimation
The appropriate allocation for the unbalanced RSS with skewed distribution requires that the sample size corresponding to each phase is proportional to its standard deviation as demonstrated by Kaur et al. (1997). It is known that, for positively skewed distributions, the variances of the order statistics tend to increase with increasing the order, i.e. σS(1:k)≤σS(2:k)≤…≤σS(k:k). We also know from (1) that the impact also increases with successive phases. Hence it is appropriate and desirable to propose an alternative model by using the impact variable to determine the unequal allocation model in the RSS procedure. Hence, in this paper, we use
( ):
( )
1i i k
m =I = + −a i d (5)
The resulting sample size for the proposed allocation model will be
(
)
(
)
1 2 1 2 k i i k a k d n m = + − =
=( )
(
)
( )( )
(
)
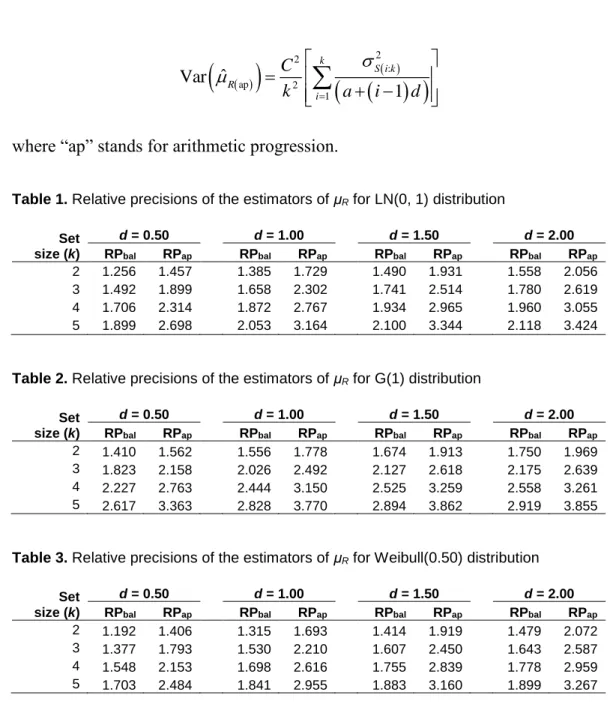
2 2 : ap 2 1 ˆ Var 1 k S i k R i C k a i d = = + −
where “ap” stands for arithmetic progression.
Table 1. Relative precisions of the estimators of μR for LN(0, 1) distribution
Set size (k)
d = 0.50 d = 1.00 d = 1.50 d = 2.00
RPbal RPap RPbal RPap RPbal RPap RPbal RPap
2 1.256 1.457 1.385 1.729 1.490 1.931 1.558 2.056
3 1.492 1.899 1.658 2.302 1.741 2.514 1.780 2.619
4 1.706 2.314 1.872 2.767 1.934 2.965 1.960 3.055
5 1.899 2.698 2.053 3.164 2.100 3.344 2.118 3.424
Table 2. Relative precisions of the estimators of μR for G(1) distribution
Set size (k)
d = 0.50 d = 1.00 d = 1.50 d = 2.00
RPbal RPap RPbal RPap RPbal RPap RPbal RPap
2 1.410 1.562 1.556 1.778 1.674 1.913 1.750 1.969
3 1.823 2.158 2.026 2.492 2.127 2.618 2.175 2.639
4 2.227 2.763 2.444 3.150 2.525 3.259 2.558 3.261
5 2.617 3.363 2.828 3.770 2.894 3.862 2.919 3.855
Table 3. Relative precisions of the estimators of μR for Weibull(0.50) distribution
Set size (k)
d = 0.50 d = 1.00 d = 1.50 d = 2.00
RPbal RPap RPbal RPap RPbal RPap RPbal RPap
2 1.192 1.406 1.315 1.693 1.414 1.919 1.479 2.072
3 1.377 1.793 1.530 2.210 1.607 2.450 1.643 2.587
4 1.548 2.153 1.698 2.616 1.755 2.839 1.778 2.959
The RP with respect to SRS (RPap) with the same sample size k(2a + (k – 1)d / 2 is
(
)
(
)
( )(
)
(
)
2 ap 2 2 : 1 2 RP 2 1 1 S k S i k i k D C a k d a i d = = + − + −
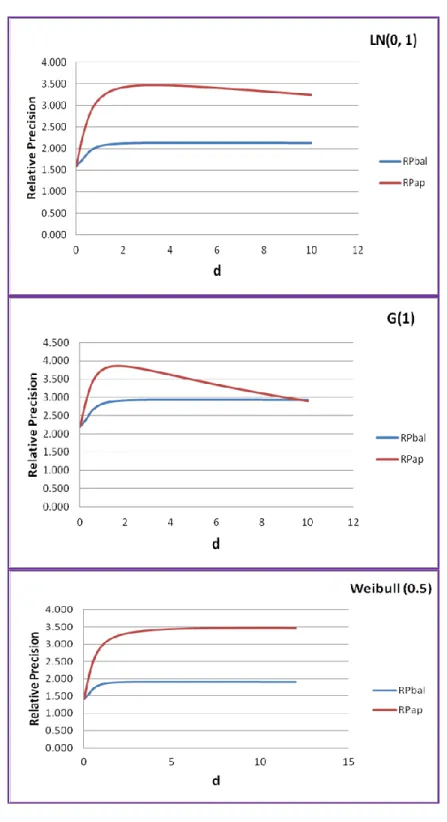
The numerical values of the RP for three highly skewed distributions of S for
k = 2(1)5, a = 1 and four different values of d, 0.50, 1.00, 1.50, and 2.00, are presented. The three distributions are: Lognormal(0, 1) (LN(0, 1)), Weibull(0.5) and standard Gamma(1) (G(1)). The values of variances of order statistics for these distributions are readily available in Harter and Balakrishnan (1996). It is clear from these computations that the relative precisions of our estimator are higher as compared to the estimators based on the SRS and balanced RSS procedures for all values of k and d. The gains in relative precision increase as the set size increases. For a given k, as d increases the relative precisions increase for both estimators based on the balanced and unbalanced RSS procedures up to a certain value of d, and then decrease as d increases. This phenomenon is clear from Figure 1, which plots relative precisions for the three distributions for various values of d when
k = 5 and a = 1.
Conclusions
Relevant personnel in organizations implement developmental programs in a phased manner across geographical regions or a particular region or community and are interested to know the impact of the program in the form of a mean of the response variable. The measurement of the survey variable under interest is very difficult or tedious and therefore the estimation of the mean of the response variable of the developmental programs, if assessed using SRS, will provide imprecise estimates. In such situations, RSS, a cost-effective and precise method of sample selection, provides a better estimate of the characteristics under study. RSS contains information across phases of the program. It is known that the survey variable under study pertaining to the developmental programs follows a skewed distribution.
The unbalanced RSS procedure was proposed for use on the survey variable to estimate the mean of the response variable using the theory of RSS for skewed distributions. The program is implemented in successive phases, which indicates that the impact of the program increases as the phases increase. The assumption of
the constant increase of impact suggests the linear trend of the impact with the phases. The linear impacts of the programs were used under successive phases to determine the unequal replications for each phase. The proposed unbiased estimator of the mean of the response variable is then compared with their competitors using SRS and balanced RSS methods. As is expected, the relative precisions of the proposed estimator are higher than those of the estimators based on SRS and balanced RSS procedures. The numerical gains were computed in terms of relative precisions of the estimator for three highly skewed distributions. The gains in relative precision of our estimator are high compared with the other two estimators for all values of a and d. The relative precision increases with the number of phases for a given value of the impact.
The optimum unbalanced RSS is based on the unrealistic assumption that the population standard deviations of the order statistics are known; see Kaur et al. (1997). A simple and practical approach was proposed to determine unequal replications by using impacts of the program. It works quite well when the survey variable follows positively skewed distributions, assuming the impacts follow the pattern of arithmetic progression.
References
Baker, J. L. (2000). Evaluating the impact of developmental projects on poverty: A handbook for practitioners. Washington, DC: The World Bank. doi: 10.1596/0-8213-4697-0
Bhoj, D. S. (2001). Ranked set sampling with unequal samples. Biometrics, 57(3), 957-962. doi: 10.1111/j.0006-341x.2001.00957.x
Chandra, G., Pandey, R., Bhoj, D., Nautiyal, R., Ashraf, J., & Verma, M. R. (2018). Ranked set sampling approach for estimating response of developmental programs with linear impacts under successive phases. Pakistan Journal of Statistics, 34(2), 163-176. Retrieved from
http://www.pakjs.com/journals/34(2)/34(2)06.pdf
Chen, Z., Bai, Z. D., & Sinha, B. K. (2004). Ranked set sampling: Theory and applications. New York: Springer-Verlag.
Dell, T. R., & Clutter, J. L. (1972). Ranked set sampling theory with order statistics background. Biometrics 28(2), 545-555. doi: 10.2307/2556166
Granger, R. C., & Kane, T. (2004, February 18). Improving the quality of after-school programs. Education Week, 23(23), 76.
Harter, H. L., & Balakrishnan, N. (1996). CRC handbook of tables for the use of order statistics in estimation. Boca Raton, FL: CRC Press.
Kaur, A., Patil, G. P., & Taillie, C. (1997). Unequal allocation models for ranked set sampling with skew distributions. Biometrics, 53(1), 123-130. doi: 10.2307/2533102
McIntyre, G. A. (1952). A method for unbiased selective sampling, using ranked sets. Australian Journal of Agricultural Research, 3(4), 385-390. doi: 10.1071/ar9520385
Simonton, D. K. (1999). Talent and its development: An emergenic and epigenetic model. Psychological Review, 106(3), 435-457. doi: 10.1037/0033-295x.106.3.435
Simonton, D. K. (2003). Scientific creativity as constrained stochastic behavior: The integration of product, person, and process perspectives.
Psychological Bulletin, 129(4), 475-494. doi: 10.1037/0033-2909.129.4.475 Stokes, S. L. (1977). Ranked set sampling with concomitant variables.
Communications in Statistics – Theory and Methods, 6(12), 1207-1211. doi: 10.1080/03610927708827563
Takahasi, K., & Wakimoto, K. (1968). On unbiased estimates of the population mean based on the sample stratified by means of ordering. Annals of the Institute of Statistical Mathematics, 20(1), 1-31. doi: 10.1007/bf02911622
Vaeyens, R., Lenoir, M., Williams, A. M., & Philippaerts, R. M. (2008). Talent identification and development programmes in sport: Current models and future directions. Sports Medicine, 38(9), 703-714. doi: 10.2165/00007256-200838090-00001