Enabling Stream Processing for People-centric IoT
based on the Fog Computing Paradigm
Dimitrios Amaxilatis
CTI and University of Patras,Greece [email protected]
Orestis Akrivopoulos
Spark Works ITC Ltd,Sheffield, UK [email protected]
Ioannis Chatzigiannakis
Sapienza University of Rome,Italy
Christos Tselios
Wireless Telecommunications Lab, University of Patras, Greece
Abstract—The world of machine-to-machine (M2M) commu-nication is gradually moving from vertical single purpose solu-tions to multi-purpose and collaborative applicasolu-tions interacting across industry verticals, organizations and people – a world of Internet of Things (IoT). The dominant approach for delivering IoT applications relies on the development of cloud-based IoT platforms that collect all the data generated by the sensing elements and centrally process the information to create real business value. In this paper, we present a system that follows the Fog Computing paradigm where the sensor resources, as well as the intermediate layers between embedded devices and cloud computing datacenters, participate by providing computational, storage, and control. We discuss the design aspects of our system and present a pilot deployment for the evaluating the performance in a real-world environment. Our findings indicate that Fog Computing can address the ever-increasing amount of data that is inherent in an IoT world by effective communication among all elements of the architecture.
I. INTRODUCTION
The advent of Internet of Things (IoT) and the anticipated exponential increase of interconnected devices, paves the way for the introduction of novel network architectures which aim to enhance the currently deployed cloud computing paradigm. We are gradually moving from vertical single purpose solu-tions to multi-purpose and collaborative applicasolu-tions interact-ing across industry verticals, organizations, and people. With the ever-increasing amount of data that is inherent in an IoT world, the key to gaining real business value is effective communication among all elements of the architecture.
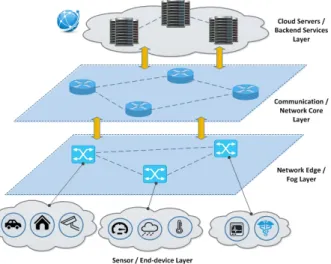
The dominant approach followed by large industries focused SMEs and startups is the development of cloud-based IoT platforms that simplify the interconnection of smart devices, the collection of data generated to the cloud, and the central processing of the information utilizing other cloud-based ser-vices (see Figure 1). Platforms such as AWS IoT1, Xively2 and Arrayent3 provide a cloud-based back-end that helps de-velopers focus on how to accelerate the creation of compelling solutions that integrate with existing business processes and IT enterprise infrastructures. With existing IoT deployments being sparse and incorporating a limited number of sensors this approach performs adequately.
1https://aws.amazon.com/iot/ 2https://www.xively.com/ 3https://www.arrayent.com/
Fig. 1. Typical cloud-based IoT architecture
With the continuous development of IoT technologies, new deployments become denser and utilize a larger number of smart devices [1]. The cloud-based approach needs to address multiple performance issues appearing at all levels of the net-work architecture (as depicted in Figure 1) while transferring massive datasets collected from the sensors and delivered to distant machine clouds: (a) network bandwidth issues at the network edge, (b) network energy consumption as traffic flows through the network core, (c) continuous I/O operations on the data centers where datasets are stored, (d) increased exposure of data across third-party cloud-based services. As stated in [2] minimal possible latency, network bandwidth preservation, increased security and enhanced reliability are elements of paramount importance for any IoT-related application. The necessity for data collection, storage and availability across large areas, the demand for uninterrupted services even with intermittent cloud connectivity and resource constrained de-vices [3], along with the necessity of sometimes near-real-time data processing in an optimal manner, create an amalgam of challenges where only radical and holistic solutions apply.
Fog and edge computing, in general, is an emerging plat-form that provides computational, storage, and control re-sources in an intermediate layer between end-user devices and cloud computing datacenters. The physical proximity of fog
infrastructure with the resource-bound last-mile sensors of any IoT-related application, allows limited latency, less bandwidth consumption, as well as elevated degrees of reliability and security. This approach extends the cloud computing paradigm by migrating data processing closer to the production site, accelerates system responsiveness to events along with its overall awareness, by eliminating the data round-trip to the cloud.
In this paper, we present a new approach that takes ad-vantage of the resources available at the edge of the net-work. Our solution provides a uniform environment where edge and cloud resources can be interchanged without the need to implement additional complex code for managing the infrastructure. Domain experts focus on specifying the rules for data-driven processing and event-based response and let our platform automatically tune the infrastructure for high-performance and high-availability. The resulting system continues to operate even when certain parts of the IoT domain become disconnected or experience periods of low-bandwidth. Data are stored locally at the edges of the network and only the parts that need to be accessible by other systems are forwarded to the cloud. Our platform conveniently removes the burden of having to explicitly to configure every single smart device and manually relocate the point of execution of each different automation task as the demand for data processing and integration increases.
The rest of the paper is organized as follows: in Section II we briefly present recent and relevant developments regarding edge and fog computing. Section III presents the dominant characteristics of our architecture and the issues this new layer tackles towards deploying an end-to-end computing platform and provides technical insights on the operation of our solu-tion. In Section IV we present in detail a pilot deployment of an IoT infrastructure that facilitates a broad range of people-centric IoT applications. In Section V we report on the findings of the performance evaluation that we conducted based on the real-world pilot deployment. Finally, Section VI draws conclusions and summarizes the paper.
II. RELATED WORK
In the past several approaches have been proposed in order to address the potentially huge number of sensor data arriving from the IoT domain, each one of them applied in different parts of the network architecture. Starting from the low-end devices, the approach of in-network aggregation and data management has been proposed where sensor devices follow local coordination schemes in order to combine data coming from different sources and/or within the same time period based on similarities identified using data analysis. Usually these techniques operate in combination with network-level routing protocols and/or lower-level medium access control protocols. For an overview of different techniques and existing protocols see [4]. Since this approach relies on spatial and temporal correlation without taking into consideration seman-tic correlation of the data, very few theoreseman-tical algorithms are
used in real-world deployment since they significantly limit the concurent support of different high-level applications.
As soon as the information reaches the fixed network, several approaches have been proposed for time-series com-pression using different aggregation techniques. One such approach originates from [5] applies different models to identify similarities in the time-series and effectively reduce the total number of data using a “piecewise approximation” technique that replaces every fixed number of points with their arithmetic mean. In [6] follow a different approach where they analyze the data points trying to evaluate their importance using local minima and maxima and subsequently keeping only the most important points. Such approaches have been studied extensively in the past however they require that all the incoming data are collected in order to complete the analysis. Moreover, these techniques do not take full advantage of the benefits of the cloud and the possibility of using multiple servers in order to speed-up the processing.
As Big Data has been introduced, several approaches have been introduced using the map-reduce paradigm [7] (e.g., Apache Spark4) that essentially split the analysis in batches. More recently, new tools have been developed that allow the analysis of the time-series in a streaming way, hence the name Stream Processing Frameworks (among the most well known are Apache Storm5and Flink6). For a survey of possible stream processing optimizations and variations see [8].
Interestingly offloading large datasets to the core network is no longer a necessity [9]. Very recently, new approaches have been proposed that take into advantage edge resources not only for load balancing the server load using only geo-spatial criterial but more importantly by taking into consideration the internal logic of the components that constitute the high-level application [10]. Such solutions confront several of the intrinsic limitations of cloud and alleviate the deployment of services with low or even zero tolerance for latency delays.
III. OUR SOLUTION FORFOG-COMPUTING-AWARE
DEPLOYMENTS
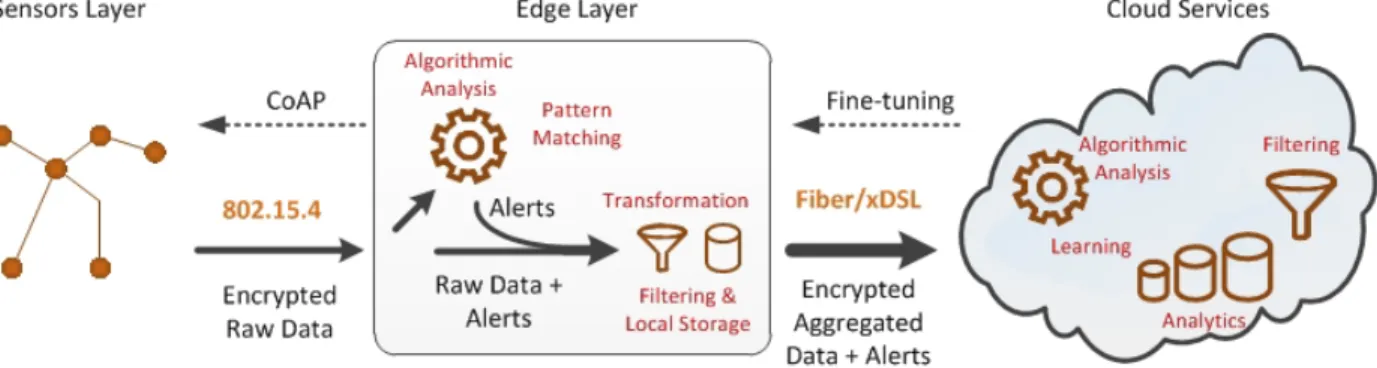
We now proceed by describing in more details the basic building blocks of our IoT platform. We introduce a message bus through which the sensor data generated by the end-devices propagate across the layers of our platform and are transformed and aggregated based on the high-level applica-tion requirements. We introduce a novel mechanism where raw sensor data along with meta-data and alerts (produced by the analysis of the data) are stored at the edges of the network and are delivered to cloud-based storage services on-demand based on the actual needs of the data analytics executed by the high-level applications. Finally, we employ a self-organization mechanism that allows sensor and edge devices to self-describe their capabilities so that virtual networks are formed across the different layers of the network to optimize usage of available resources (see Figure 2).
4http://spark.apache.org/ 5http://storm.apache.org/ 6https://flink.apache.org/
Fig. 2. Information flow across the different layers of the architecture
A. Message Bus, Intermediate & Deep Storage
All data messages retrieved from the IoT end-devices and control messages generated from cloud and edge-devices are circulated over a message bus system that is responsible for distributing the information gathered to the various subsystems responsible for storing and processing the data or generating alerts. The message bus system offers us the flexibility to introduce data processing, transformation, and aggregation mechanisms at different layers of the architecture depending on the needs of the high-end application.
The message bus layer offers us the ability to store data in a scalable way at different layers of the architecture: (a) data are formatted for near-instantaneous retrieval, thus avoiding time-consuming queries and aggregations; (b) a cache-like mechanism is available for providing recent data for a specific sensor devices or collection of end-devices using a single lookup in near-located storage service; (c) older historical measurements are stored in a deep storage service that is used only when measurements that are older than the ones provided by the first service. This decoupling of the data generators and the data storage services allows us to implement a broad range of services that need to optimize different performance criteria.
B. Self-organization of Sensor & Edge resources
In order to be able to move computation to specific edge devices, we provide certain mechanisms for self-configuration and self-organization. In our system, edge devices are capable of self-describing their capabilities using standard M2M proto-cols and are able to form virtual networks based on the needs of the high-level applications. In this way, we completely avoid the need for the preconfiguration of the IoT infrastructure and the fixed routing of data through the various cloud-based services that constitute the resulting system.
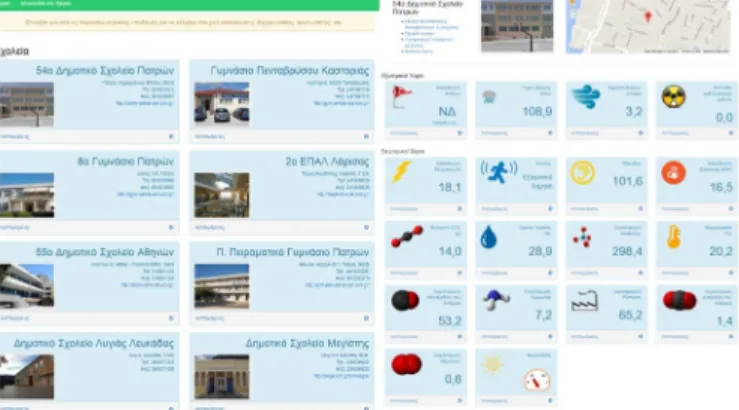
In order to improve the flexibility of storing and managing the context data for the deployed sensors we store the sensor annotations and metadata on a different storage than the raw sensor data or the transformed and aggregated data. This service stores the different deployed sensors and their metadata (e.g., observed properties, units of measurements or locations) as part of a graph database and thus allows us to do complex relation queries like getting the list of available temperature
Fig. 3. An example of the graph data for a single school building.
sensors in multiple locations simply by running a graph traversal query. Figure 3 depicts the end-devices deployed at a specific location (for more details see Section IV).
C. Data Transformation & Aggregation
Domain experts specify the rules for data-driven processing and event-based response using JSR-000335 lambda expres-sions. These specifications are injected into our system through the cloud-based services. The lambda expressions are decom-posed based on the sensor data that they process as well as the time-windows used for processing the stream of data. Given the decomposition of the sensor data and by exploring the sensor annotations graph, we identify the edge-device through which the majority (if not all) end-devices are connected. This edge device becomes the “primary” processing point for the specific lambda expression. Data from each sensor is assigned to the same processing instance based on the unique name of the sensor to avoid duplicate data.
In the sequel, the time-windows defined by the lambda expression are evaluated based on those that are already being executed on the specific edge device. Our goal is to combine the different intervals defined as well as the size of the multiple windows that are concurrently supported in order to fine-tune the intermediate storage available at the edge devices. Essentially we offer data retrieval of specific time points in constant time and data between two-time instants in time relative to the time duration. In this way, data processing
is scalable as multiple lambda expressions can be combined for each type of sensor avoiding re-computation of the same transformations and aggregation functions.
IV. PILOT DEPLOYMENT
In order to evaluate the performance of our system in a real-world environment, we look into supporting people-centric applications [11] for facilitating the educational sector towards improving the energy efficiency of school buildings. We envision an IoT ecosystem that is composed of a variety of business players that collaborate towards bringing together a diverse set of devices for real-time monitoring and manage-ment of school buildings. To do so, we work by following the concept and scope of the IoT as defined by ITU-T in 2012 [12]. The educational sector presents a very interesting and im-portant case for the monitoring and management of buildings, by having a very large number of buildings to operate, situated in a very fragmented manner. In national educational systems we have literally thousands of buildings spread throughout a country, usually, with very different characteristics in terms of construction, age, size, etc. It is reasonable to expect a diverse set of device providers working under the same interoperability framework. Due to this, we are hardware independent: sensors from different manufacturers interoperate with our system.
Clearly, an IoT system deployed at a national scale and op-erating in real-time must handle, store and analyze vast quanti-ties of data collected from the devices. Given the heterogeneity of the hardware devices, data need to be homogeneous across different buildings and should be accessible through open and easy-to-use APIs. For this reason, our platform enables direct comparisons of energy efficiency between buildings and cities, carefully taking into account all the environmental parameters. We integrate the diverse capabilities of IoT devices and provide open interfaces to application developers.
Our platform supports different end-user groups that in-herently exist in the educational sector: students, educators, building administrators and other administrative staff. Our platform provides access to the available information in a way that suits all of these end-users groups. In some cases unifying different school buildings into a single view is necessary to make interaction simpler, visualize data more naturally and create an environment that conveys valuable insights.
Regarding the actual deployment of our prototype, we used 12 school buildings in Greece (see Table I), spread in 7 locations, covering a range of local climatic conditions. Three of the buildings are situated in suburban areas, one in a rural area, two in small islands, while the rest are placed close to city centers. The vast majority of the rooms monitored are used for teaching purposes and the rest for other activities like teacher/staff rooms, etc. The year of construction of these buildings ranges from 1950 to 2000.
A. End-Device Layer
In each of the 12 buildings participating in our pilot study we deploy sensor devices that measure (a) the overall power consumption of the building, (b) the environmental comfort
TABLE I
ASUMMARY OF A FEW KEY FACTS REGARDING OUR DEPLOYMENT Parameter # Description
Schools 12 6 primary, 5 secondary, 1 high school Sensing Points 1055 ≥6 sensors per device
Students 2267 students in all levels Teachers 294 teachers in all levels Sensing Rate 30sec . . . 5min classroom sensors
within each individual class (see below for more details) and (c) the weather condition and air pollution meters of each building. For more details regading the sensor devices see [13]. On the physical and data link layer, all indoor IoT nodes form IEEE 802.15.4 networks and communicate with the Edge devices by establishing ad hoc multihop bidirectional trees, setup in the time of the deployment and maintained throughout the network lifetime. The outdoor nodes are either connected via Power Over Ethernet cables both for power and communication, or via IEEE 802.11 using solar panels. On the transport and session layers, we depend on CoAP [14] for the discovery of resources and transmission of measurements.
1) Power Consumption: The power consumption meters
installed measure the apparent power and average power consumption of a school building. Meters are situated on the general electricity distribution board of each such building. Remark that schools use 3-phase power supply.
2) Environmental Comfort: The Environmental Comfort Meter measures various aspects affecting the well-being of the building inhabitants, such as thermal (satisfaction with sur-rounding thermal conditions), visual (perception of available light) comfort, poor classroom acoustics due to background noise and monitor overall noise exposures and air quality (presence ofCOandCH4). We also monitor room occupancy using PIR sensors.
3) Weather and Atmosphere Stations: The Weather Station provides information for the outdoor atmospheric conditions including precipitation levels, wind speed and direction. The Atmospheric meter monitors atmospheric pressure and con-centration of pollutants, to better understand the pollution near school buildings.
B. People-Centric IoT Usage Scenarios
A main objective of environmental sustainability education and energy efficiency awareness initiatives in schools is to make students aware that energy consumption is largely in-fluenced by the sum of individual behaviors (at home, school, etc.) and that behavior changes and simple interventions in the building (e.g., replacing old lamps with energy-efficient ones) can have a great impact on achieving energy savings.
To this purpose, IoT technologies can definitively support these initiatives by intermediating the interaction of people with the environment to provide immediate feedback and actual measures of the impact of human actions (e.g., by pro-viding a feedback on the consumption of a PC left in standby) and automating the implementation of energy savings policy while maintaining the comfort level perceived by people.
Indeed, IoT technologies allows producing data from the real world in order to feed a plethora of people-centric information, education and involvement initiatives in order to effectively change the ways people live and work inside school buildings and achieve better energy efficiency. This means on the one hand, to better inform people and enable them to make educated decisions, and on the other hand to enable a whole different set of applications, like gamification apps that bridge the virtual world with the real one, towards the end-goal of such systems. We argue that the availability of actual measurements of environmental parameters, such as energy consumption, indoor and outdoor luminosity, temperature, noise, pollution, etc., enables the conception and realization of diverse people-centric application and scenarios.
Education:Teachers use collected data and analytics during the class to explain to pupils basic phenomena related to the parameters monitored.
Students’ engagement: Teachers organize student projects where each student (or group of students) monitors specific environmental parameters at their home, e.g., via participatory sensing or by using low-cost sensors installed at their homes.
End-user programming: Students can develop software ap-plications using the data provided by the platform and utilizing the available APIs or other frameworks (such as Minecraft game modules)
Building management:Collected data can feed applications informing building managers about the energy profile perfor-mance of the building and specific equipment. The availability of data from similar schools and/or similar equipment allows to do some benchmarking and supporting decisions for pre-ventive maintenance or substitution of existing equipment.
Scientific research: Data collected in the schools can be made available to the scientific community, so that studies can be performed on a common dataset and results can be more easily compared.
The level of abstraction introduced by an IoT service architecture on top of sensors provided by different man-ufacturers, together with the capability of performing data analytics and interpreting data with context information (e.g., building profile, education curricula, etc.), definitively widen the scope of application of IoT from the local to a national or international extent. Monitoring school buildings situated in different countries can help, e.g., to identify usage or energy consumption patterns. This, in turn, can be utilized to make comparisons or realize competitions through social networking and game applications (e.g., students of school A compete with students of school B in answering energy awareness questions). This could also help understanding and reflecting on cultural differences with respect to energy efficiency awareness and attitude towards behavioral changes. With respect tointerfacing the systemwith the end-users and the general public, we provide a series of web applications that cover the needs of several end-user groups such as students, educators and administrative staff from each school, the regional government and top-level staff at the national Ministry of Education. The first set of web applications is
Fig. 4. People-centric IoT application developed on top of our platform, depicting a list of the school buildings that can be selected to reveal further details (left), the list of sensors inside a specific school building and their current values (right).
used by students and provide access only to data related to their classroom. The second set targets school staff and ad-ministrative personnel offering access to the respective school building. Finally, a the third set of application provide access to the entirety of the buildings.
As an example consider a single web application that unifies different school buildings into a single view (see Fig. 4) to make interaction simpler, make data visualization more natural and create an environment that conveys valuable insights and clear actions related to general as well as specific aspects of the participating building ecosystem. This people-centric IoT application presents collected information hierarchically as follows:
• At the highest level, a list of all buildings participating is presented, along with certain administrative info.
• The end-user can select a specific building to navigate to more analytic info about this building. A set of average and current values is presented regarding the whole building, followed by a list of each classroom/room.
• End-users can navigate to specific rooms/classrooms and see the list of IoT nodes installed with the respective average/current values.
• The final hierarchical level displays information produced
by each specific sensor.
Facilitating all these diverse application scenaria and sup-porting the different requirements in terms of data interpreta-tion and analytics we implemented a series of lambda expres-sions for processing and transforming data received from the end-devices layer. These lambda expressions are executed at the either at cloud level or at the edge level depending on the traffic of data, the current conditions of the network and the overall load of the system. Our expressions are organized into three categories: (a) expressions that involve linear regression, (b) expressions that employ data mining techniques for clus-tering data, and (c) fast Fourier transformation expressions.
1) Linear Regression: The implementation of the pilot applications that address the people-centric IoT usage scenaria requires employing linear regression for modeling the
rela-TABLE II
TECHNICAL SPECIFICATIONS OF CLOUD-BASEDVMS Specification Azure A1 Azure A4
Processor Xeon E5-2673 Xeon E5-2673 Frequency 2.40GHz 2.40GHz
Cores 1 8
Memory 1792 MB 14 GB
Disk 29GB HDD 240GB HDD
tionship between scalar dependent variables and one or more explanatory variables (or independent variables). Most of the implementations are based on simple linear regressions yet in a couple of cases we also use multivariate linear regressions. For example, consider the prediction of the environmental conditions within a specific class room, or the estimation of the power consumption of a specific building for the next period.
2) Clustering: Across the different applications imple-mented data need to be homogenized using unsupervised learning techniques. We address this need by using the well-established k-means clustering method of vector quantization, originally from signal processing, that is popular for cluster analysis in data mining. k-means clustering aims to partitionn
observations intokclusters in which each observation belongs to the cluster with the nearest mean, serving as a prototype of the cluster. This results in a partitioning of the data space into Voronoi cells. In particular, we use Lloyd’s algorithm to produce a simple implementation that can be applied even to large data sets. As an example consider the unsupervised characterization of the luminosity of each individual class room across all schools, or the classification of the power consumption of each classroom during each day/time-slot.
3) Fast Fourier Transform: The third group of transforma-tion expression relies on the usage of fast Fourier transform (FFT) algorithm to compute the discrete Fourier transform (DFT) of a sequence or its inverse. Fourier analysis converts a signal from its original domain (often time or space) to a representation in the frequency domain and vice versa. An FFT rapidly computes such transformations by factorizing the DFT matrix into a product of sparse (mostly zero) factors. As a result, it manages to reduce the complexity of computing the DFT from O(n2), which arises if one simply applies the definition of DFT, to O(nlogn), where nis the data size.
These expressions are used for feature extraction, for ex-ample, to analyze the power consumption of the school in order to identify whether specific laboratory equipment is still operational although the particular course that is using this equipment is complete. Another example involves the quantification of events of a loud environment or poor air quality.
V. PERFORMANCE EVALUATION
We evaluate the performance of the Fog-computing ap-proach by comparing the performance of the Spark Works IoT platform when executed only on cloud-based infrastructures such as Microsoft Azure against the performance achieved
TABLE III
TECHNICAL SPECIFICATIONS OF EDGE DEVICES Specification Raspberry Pi Zotac Atom
Processor BCM2836 Arm7 i3-3120M
Frequency 900MHz 2.2GHz
Cores 1 2
Memory 736 MB 8 GB
Disk 64GB SSD 120GB SDD
TABLE IV
PERFORMANCE COMPARISON OF EDGE-BASED VS CLOUD-BASED PROCESSING(EVENTS/SEC)
Machine Scenario 0 Scenario 1 Scenario 2
Pi 110 62 60
Atom 8010 5800 4400
A1 1170 870 680
A4 10480 6360 5800
when the aggregation and transformation are executed on low-end devices such as Raspberry PI boards and low-low-end Intel based systems that are located on the edges of the network. Remark that this evaluation strategy is in line with most related works, like e.g., [15]. In terms of cloud-based infrastructure, we select the virtual machines with the most limited resources (see Table II) so that they are relevant to the resources available to the edge devices (see Table III). Clearly, in contrast to the capabilities of the edge-devices that remain fixed and are hard to replace, the cloud-based machines can be easily upgraded to achieve higher performances.
We model the different stream processing requirements of the applications developed in Section IV based on the number of distinct time-windows used (denoted by the parameter l), the total number of historic values (denoted by the parameter
k) and the transformation functions used. As an example consider the web-application depicted in Figure 4 where the administrative personnel requires keeping the maximum and minimum values of the sensor observations based on daily time-intervals (i.e., l = 1) over a history of 7 weeks (i.e.,
k= 49). We call this example “Scenario 1”. Another example is the application developed for assessing the environmental conditions of the classrooms during the teaching activities where aggregates (e.g., average, minimum, maximum) of the sensor observations are generated over five different period intervals: 5-minute, 15-minute, 30-minute, 1-hour, 1-day (i.e.,
l= 5) over a history of 4-hours, 12-hours, 24-hours, 48-hours and 7 weeks (i.e., k= 49). We call this application example “Scenario 2”. We compare the performance of our system on each different platform under the different stream processing requirements and compare it to a reference “pass-through” scenario where the l = 0 and k = 0 (noted as “Scenario 0”).
The results of our first experiment indicate that as the number of distinct aggregation time-windows increases (l) there is a slight degradation of the throughput of the system. In order to better visualize the performance of each different platform, we include Figure 5 where the case of l = 10 is
Fig. 5. Performance evaluation (numbers of events processed per second) of edge-based vs cloud-based stream processing for applications scenarios with different requirement distinct time-windows (l)
also shown. Indeed the fact that Raspberry Pi underperforms the other platforms at such a level was expected, given that the available memory is extremely limited; remark that after the OS is fully-loaded, about 300MB of RAM are available to our application-level process. However, given the actual load generated by the school buildings considered under our real-world pilot presented in Section IV, even this level of throughput is almost sufficient. In particular, consider that in one of the schools of the pilot deployment7 currently includes 106 sensors generating 212 events per second. Each of these events includes the actual sensor value along with a timestamp and thus requires a total of 12 bytes when stored on the cloud-based database. Since we are transmitting these values over the 802.15.4 network using the CoAP protocol, each event requires 1 packet, which translates to 134 bytes. Therefore, the cloud-based approach requires the propagation of all the events to the cloud, so for delivering all the events that are accumulated for a single month we need a total of 1.2GB while for storing them we need a total 108MB. On the contrary, although the Raspberry Pi is not sufficient to handle such load, if we use the Atom-based machine, the Fog-based solution requires to transmit and store just 148KB per distinct stream processing requirements. The particular real-world case demonstrates the benefits of using the edge-devices for transforming and aggregating the sensor values.
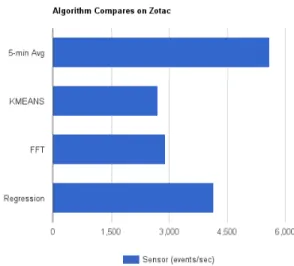
We continue by examining the performance of our system when certain applications require the execution of more com-plex transformation functions (e.g., FFT computations, linear regression, clustering and classification, anomaly detection, etc). Given that the computation resources of a Raspberry Pi are not sufficient to handle the load of a single building, we evaluate the performance of the system based on the Zotac Atom-based edge device. In Figure 6 we measure
7Elementary School of Kastellorizo Island, Dodecanese, Greece
Fig. 6. Performance evaluation (number of events processed per second) of different transformation functions used for stream processing when executed on a Zotac Atom-based edge device
the total number of events processed per second when the stream processing requires the application of each of the three transformation functions described in Section IV. Interestingly the results indicate that computation of the average value over 49 consecutive 5-minute moving windows (involving 10 values each) is a much more demanding process than the execution of any of the three transformation functions on the same total number of sensor values. The results provide a very promising indication of the usage of edge resources even for executing complex transformation and aggregations of the large data arriving from the IoT end devices.
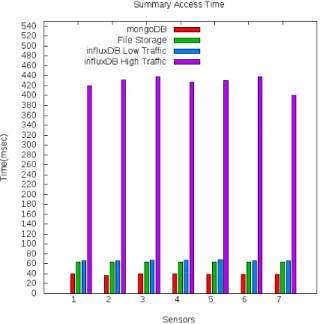
As a final step towards assessing the performance of our system we conduct a comparative study with InfluxDB8, a mainstream solution specifically developed for IoT-based applications that rely on time series. Once again we use the Zotac Atom-based edge device for all the computation required to transform and aggregate the events received from the sensor devices. We evaluate the performance of the aggregates provided to the applications as served directly from the file system of the edge device. We also consider the combination of our Spark IoT platform with a MongoDB9 that is used to serve the files. We also install a local version of InfluxDB on the same type of edge machine and carefully follow all the installation instructions provided by InfluxDB in order to optimize the performance for 7 different type of sensor values (i.e., the actual number of different sensors considered in our pilot deployment). We run several thousand queries in order to calculate the time intervals and then we used the average time of those queries to obtain the information about the efficiency. Figure 7 depicts the results of our comparative evaluation based on the real-world values arriving from the
8https://www.influxdata.com/ 9http://www.mongodb.com
Fig. 7. Performance evaluation (query response time in seconds) of Spark IoT platform stand alone, in combination with MongoDB and versus InfluxDb when executed on a Zotac Atom-based edge device
same school considered above. We start by assuming that 10 different client applications are continuously issuing queries on the edge device for retrieving the aggregate values for the above mentioned “Scenario 2”. Our evaluation indicates that the performance of InfluxDB is heavily affected in contrast to our solution. For this reason, we also include a separate evaluation (under the title “Low Traffic”) where only 1 client is issuing queries to the InfluxDB. We are very pleased to report that our system achieves a constant performance regardless of the number of clients or the sensor type aggregated, in contrast to InfluxDB that is clearly affected by the total number of concurrent clients.
VI. CONCLUSIONS
This paper has presented some of the basic issues a sys-tem architect must consider when designing, implementing and deploying an end-to-end application which includes IoT nodes and cloud computing backend services, that leverages the benefits of the Fog computing approach. Being an in-termediate layer between end-user devices and the remote cloud datacenters, Fog alleviates a series of issues in the areas of scalability, bandwidth consumption reduction, latency decrease and seamless operation. However, one should focus on the actual problems derived from the fundamentals of IoT applications. The huge increase of interconnected devices indicated that holistic solutions are needed for efficiently solve the problems of colossal data transfer between the network nodes. As shown by the evaluation of a functional end-to-end application prototype designed by the latest trends of IoT and Fog Computing, presented in Section V, monitoring a single school building requires significant amounts of storage and throughput to deliver sensor data to the cloud. Considering
that these numbers will increase linearly to the number of interconnected IoT devices and users in general, maybe an even more radical approach than Fog computing is advised.
VII. ACKNOWLEDGMENTS
This work has been partially supported by the EU research project “Green Awareness In Action” (GAIA), funded under contract number 696029 and the research project Designing Human-Agent Collectives for Sustainable Future Societies (C26A15TXCF) of Sapienza University of Rome. This docu-ment reflects only the authors’ view and the EC and EASME are not responsible for any use that may be made of the information it contains.
REFERENCES
[1] “More than 50 billion connected devices.” Ericsson White Paper (284 23-3149): pp. 1-12, Tech. Rep., 2011.
[2] Cisco Systems Inc., “Fog Computing and the Internet of Things: Extend the Cloud to Where the Things Are,” 2015.
[3] M. Chiang and T. Zhang, “Fog and iot: An overview of research opportunities,”IEEE Internet of Things Journal, vol. 3, no. 6, pp. 854– 864, Dec 2016.
[4] E. Fasolo, M. Rossi, J. Widmer, and M. Zorzi, “In-network aggregation techniques for wireless sensor networks: A survey,” Wireless Commun., vol. 14, no. 2, pp. 70–87, Apr. 2007. [Online]. Available: http://dx.doi.org/10.1109/MWC.2007.358967
[5] B.-K. Yi and C. Faloutsos, “Fast time sequence indexing for arbitrary lp norms,” inProceedings of the 26th International Conference on Very Large Data Bases, ser. VLDB ’00. San Francisco, CA, USA: Morgan Kaufmann Publishers Inc., 2000, pp. 385–394. [Online]. Available: http://dl.acm.org/citation.cfm?id=645926.671689
[6] K. B. Pratt and E. Fink, “Search for patterns in compressed time series,” International Journal of Image and Graphics, vol. 02, no. 01, pp. 89–106, 2002. [Online]. Available: http://www.worldscientific.com/doi/abs/10.1142/S0219467802000482 [7] J. Dean and S. Ghemawat, “Mapreduce: Simplified data processing on
large clusters,”Commun. ACM, vol. 51, no. 1, pp. 107–113, Jan. 2008. [Online]. Available: http://doi.acm.org/10.1145/1327452.1327492 [8] M. Hirzel, R. Soul´e, S. Schneider, B. Gedik, and R. Grimm, “A
catalog of stream processing optimizations,” ACM Comput. Surv., vol. 46, no. 4, pp. 46:1–46:34, Mar. 2014. [Online]. Available: http://doi.acm.org/10.1145/2528412
[9] C. Tselios and G. Tsolis, “On QoE-awareness through Virtualized Probes in 5G Networks,” in Computer Aided Modeling and Design of Communication Links and Networks (CAMAD), 2016 IEEE 21st International Workshop on, 2016, pp. 1–5.
[10] A. Papageorgiou, E. Poormohammady, and B. Cheng, “Edge-computing-aware deployment of stream processing tasks based on topology-external information: Model, algorithms, and a storm-based prototype,” in 2016 IEEE International Congress on Big Data, San Francisco, CA, USA, June 27 - July 2, 2016, 2016, pp. 259–266. [Online]. Available: http://dx.doi.org/10.1109/BigDataCongress.2016.40 [11] F. e. a. Boavida, People-Centric Internet of Things—Challenges, Ap-proach, and Enabling Technologies. Springer International Publishing, 2016, pp. 463–474.
[12] I.-T. Y.4000/Y.2060, “Overview of the internet of things,” TELECOM-MUNICATION STANDARDIZATION SECTOR OF ITU, Tech. Rep., 2012.
[13] L. Pocero, D. Amaxilatis, G. Mylonas, and I. Chatzigiannakis, “Open source iot meter devices for smart and energy-efficient school buildings,” HardwareX, 2017. [Online]. Available: http://www.sciencedirect.com/science/article/pii/S2468067216300293 [14] Z. Shelby, K. Hartke, and C. Bormann, “The Constrained Application
Protocol (CoAP),” RFC 7252 (Proposed Standard), Internet Engineering Task Force, Jun. 2014.
[15] A. Papageorgiou, B. Cheng, and E. Kovacs, “Real-time data reduction at the network edge of internet-of-things systems,” in2015 11th Interna-tional Conference on Network and Service Management (CNSM), Nov 2015, pp. 284–291.