Mar
ch 2012
Housing
provide insightful, well-informed and
accessible advice that leads to the best
possible improvement in the wellbeing
of New Zealanders.
Housing Affordability
March 2012
The New Zealand Productivity Commission
The Commission – an independent Crown Entity – completes in-depth inquiry reports on topics selected by the Government, carries out productivity related research, and promotes understanding of productivity issues. The Commission’s work is guided by the New Zealand Productivity Commission Act 2010. Information on the Commission can be found on www.productivity.govt.nz or by calling +64 4 903 5150. Disclaimer: Access to Household Economic Survey and Survey of Family, Income and Employment data used in this report was provided by Statistics New Zealand under conditions designed to give effect to the security and confidentiality provisions of the Statistics Act 1975. The results presented in this report are the work of the New Zealand Productivity Commission, not Statistics New Zealand.
ISBN: 978-0-478-39506-8 (print) ISBN: 978-0-478-39507-5 (online)
Inquiry contacts
Administrative matters: T: (04) 903 5150
E: [email protected] Other matters: Steven Bailey
Inquiry Director
T: (04) 903 5156 E: [email protected] Website www.productivity.govt.nz
Foreword
There are few things more important to New Zealanders than the homes we live in. Housing is a
fundamental determinant of wellbeing, central to health, family stability, and social cohesion. Affordable, quality housing is also important for the New Zealand economy – it is a big and complex sector.
For most New Zealanders, buying a house is their single biggest purchase, and the cost of owning or renting a home takes a large share of household income. If housing is more expensive than it needs to be, then the cost to individuals and families, and the New Zealand economy overall, is significant. Volatility in house prices also has wide-ranging impacts. Finding ways of making the housing market work better for all is therefore critically important. I cannot think of a better first inquiry topic for the Commission.
This inquiry follows a house price boom in New Zealand (and many other countries) over the early 2000s, leading to widespread concern that housing has become unaffordable, particularly for low income earners and those trying to get into their first home.
While the recent house price cycle was significant, home ownership in New Zealand has been declining for many years. At the same time, low income households have been facing serious affordability issues in the housing rental market. This suggests that something more structural has happened in the New Zealand housing market and that there are many dimensions to the affordability problem. Seen in that light, our inquiry has investigated the underlying factors that contribute to the high cost of housing in New Zealand and poor access to appropriate housing for those on lower incomes.
The inquiry has found many obstacles getting in the way of affordable housing. A number of factors are small though cumulatively important. Other factors are more significant, such as land supply restrictions, the problems with achieving scale in new house construction and inefficiencies, costs and delays in regulatory processes. The inquiry has also identified that the current approach to social housing in New Zealand will not provide sufficient support for many New Zealanders in need.
Having identified the underlying problems, we have set out a number of a ways to improve housing affordability. There are, unfortunately, no quick fixes. Rather, a coherent and determined push across multiple policy areas is required in order to meaningfully improve housing affordability. We have also identified excessive costs and impediments in almost every aspect of government’s interaction in the housing sector. This report poses a challenge for central and local government agencies to address the issues we have identified.
In forming its views, the Commission has met with a large number of people, which has been invaluable. Across our issues paper and draft report, we also received a large number of submissions helping us to understand key issues and concerns and ways to potentially address them. We are very grateful for the high level of interest and involvement. In addition, we have also undertaken extensive research and analysis ourselves to help inform our recommendations.
Preparation of the report was overseen by all of our Commissioners, Professor Sally Davenport, Dr Graham Scott and myself. We would particularly like to acknowledge the work and commitment of the inquiry team – Steven Bailey (Inquiry Director), Judy Kavanagh, Terry Genet and Paul Miller – and a number of other Commission staff and external providers that made important contributions to the work.
MURRAY SHERWIN Chair
Terms of reference
The Government has asked the Productivity Commission to undertake an inquiry into
housing affordability.
New Zealand Productivity Commission Inquiry into Housing Affordability
Issued by the Minister of Finance, the Minister for the Environment, the Minister of Housing, the Minister for Building and Construction, and the Minister for Regulatory Reform (‘the referring Ministers’).
Pursuant to sections 9 and 11 of the New Zealand Productivity Commission Act 2010, we hereby request that the New Zealand Productivity Commission (‘the Commission’) undertake an inquiry into housing affordability.
Context
Stability of the home environment is widely considered to be important for social cohesion and family stability. Real house prices in New Zealand are markedly higher than they were a decade ago. The rise in real house prices has been associated with general declines in housing affordability, as indicated by a number of different measures, and in the rate of home ownership. These declines have contributed to increased demand for rental accommodation and additional pressure on the social housing sector. The debt accumulation and wealth effects associated with the rise in house prices may have also exacerbated New Zealand’s last economic cycle. Interest rates and exchange rates were arguably higher than they otherwise would have been during the upturn and there has been greater contraction in demand during the recession. Debt accumulation may also be a factor in ongoing economic risks.
Scope
Having regard to the context outlined above, the Commission is requested to undertake an inquiry to evaluate the factors influencing the affordability of housing (both rental and owner-occupied housing), and to examine potential opportunities to increase housing affordability. For the purposes of this evaluation the Commission should:
Identify and analyse all components of the cost and price of housing.
Identify mechanisms to improve the affordability of housing, with respect to both the demand and supply of housing and associated infrastructure.
Identify any significant impediments to home ownership, and assess the feasibility and implications of reducing or removing such impediments.
Particular attention should be given, without limitation, to the following matters:
a) factors influencing the supply of land and basic infrastructure for residential construction;
b) factors influencing the cost of residential construction, including the effect of standards, specifications, approval and title requirements on the cost of new housing construction;
c) the level and growth of productivity in the land development and residential construction industries, and the effect of government regulations on productivity in these industries;
d) the efficiency of taxes, levies and charges imposed at all stages of the housing supply chain; e) the efficiency of the tax treatment of owner-occupied and rental housing;
f) the influence of changing consumer housing preferences, willingness to pay, and financing costs on housing affordability; and
g) the operation of the overall housing market, with specific reference to the availability of a range of public and private housing types, the demand for housing, and the efficiency of use of the existing residential housing stock.
Consultation Requirements
In undertaking this review, the Commission should consult with key interest groups and affected parties.
Timeframe
The Commission must publish a draft report and/or discussion paper(s) on the inquiry for public comment, followed by a final report, which must be submitted to each of the referring Ministers by 1 February 2012.
BILL ENGLISH, MINISTER OF FINANCE
NICK SMITH, MINISTER FOR THE ENVIRONMENT PHIL HEATLEY, MINISTER OF HOUSING
MAURICE WILLIAMSON, MINISTER FOR BUILDING AND CONSTRUCTION RODNEY HIDE, MINISTER FOR REGULATORY REFORM
Contents
Housing Affordability ... i
Foreword ... iii
Terms of reference ... iv
Overview ... 1
Why is this inquiry important? ... 1
What has happened to housing affordability? ... 3
What are the key features of the housing landscape? ... 5
Where has the Commission found opportunities to improve affordability? ... 9
Concluding comments ... 18
1 The housing affordability inquiry ... 20
1.1 What has the Commission been asked to do? ... 20
1.2 Housing and wellbeing ... 21
1.3 The Commission’s approach ... 23
1.4 Analysing housing markets ... 25
1.5 A holistic approach to housing affordability ... 25
1.6 Guide to this report ... 26
2 The New Zealand housing market ... 28
2.1 The New Zealand house price cycle ... 29
2.2 Housing market drivers ... 32
2.3 The rise of the private rental market ... 36
2.4 Housing investment ... 41
2.5 The quality of the housing stock ... 45
2.6 Ongoing challenges for the housing market ... 47
3 Macro-economic factors ... 49
3.1 Introduction ... 49
3.2 A retrospective ... 49
3.3 Implications ... 55
4 Housing affordability: distribution and trends ... 58
4.1 Introduction ... 58
4.2 Why does housing affordability matter? ... 58
4.3 Affordability for potential home owners ... 59
4.4 Affordability for renters ... 66
4.5 What conclusions can be drawn about housing affordability? ... 68
5 Population and demographic change ... 70
5.1 Introduction ... 70
5.2 Population growth ... 70
5.3 The impacts of demographic change on household formation ... 73
5.4 The impact of population growth and demographic change on underlying demand ... 77
5.5 Implications for tenure choice ... 79
5.6 Implications for house prices ... 80
6 The role of taxation ... 83
6.1 Introduction ... 83
6.2 How does the current tax system apply to housing? ... 84
6.3 Recent tax inquiries ... 87
6.4 Income tax influences on housing affordability ... 88
6.5 GST and territorial government rates – two good taxes? ... 98
7 Urban planning and housing affordability ... 102
7.1 Introduction ... 103
7.2 Matching the demand and supply for housing ... 107
7.3 Increasing the supply of land for housing ... 110
7.4 The impact of urban development policies and processes on housing affordability ... 113
7.5 An immediate way forward ... 121
7.6 Concluding remarks ... 124
8 Paying for infrastructure development ... 126
8.1 Introduction ... 126
8.2 The nature and role of infrastructure ... 127
8.3 Financial and development contributions ... 130
8.4 How do development contributions affect housing affordability? ... 132
8.5 Possible problems with the current system ... 136
8.6 A way forward ... 139
9 Building regulations and affordability ... 151
9.1 Why have building regulation? ... 152
9.2 The regulatory framework for residential building ... 154
9.3 In what ways can building regulations increase the cost of housing? ... 155
9.4 Are housing standards set at the right level? ... 157
9.5 Is there scope to expedite the building consent process? ... 158
9.6 Is there scope to improve the allocation of risk under the Building Act? ... 159
9.7 Is there scope to improve the impact of regulation on innovation? ... 162
9.8 Is there scope to reduce the diseconomies associated with many small BCAs? ... 165
9.9 Measuring the outcomes of regulation ... 166
9.10 Overall assessment ... 167
10 The performance of the building industry ... 170
10.1 Introduction ... 171
10.2 Are building costs increasing? ... 172
10.3 There is evidence of poor productivity ... 181
10.4 What are the barriers to improved productivity? ... 183
11 The private rental market: affordability and outcomes ... 196
11.1 The dynamics of the private rental market – an overview ... 197
11.2 Growth of the private rental market ... 199
11.3 Lower-income households are under stress ... 200
11.4 Quality and tenure issues ... 203
11.5 Improving outcomes from the private rental market ... 205
11.6 A long-term solution ... 214
12 Social housing ... 216
12.1 Introduction – the role of state and community (social) housing ... 217
12.2 The state and community housing sectors ... 217
12.3 Social Housing Reform Programme (SHRP) ... 218
12.4 The future role of the community housing sector... 225
12.5 Funding the community housing sector using the Accommodation Supplement ... 231
12.6 Areas requiring emphasis in the reform programme ... 235
13 Mäori housing ... 238
13.1 Mäori housing needs... 239
13.2 Broader issues in Mäori housing ... 244
13.3 Responses to the housing affordability and wellbeing challenges facing Mäori ... 246
13.4 Building homes on Mäori land ... 250
13.5 Why aren’t homes getting built on Mäori land? ... 253
13.6 Alternative models for managing housing developments on rural Mäori land ... 261
Appendix A Public consultation ... 277
Submissions ... 277
Engagement meetings ... 280
Appendix B The costs of urban form ... 283
B.1 New Zealand ... 283
B.2 United States ... 290
B.3 Australia... 291
B.4 A Generic Decision Tool for Urban Density? ... 294
B.5 Conclusion ... 296
Appendix C Methodology on impacts of Auckland’s Metropolitan Urban Limit on land price .. 297
Appendix D Collaborative models for urban land development ... 300
D.1 New Zealand ... 300
D.2 Australia... 301
Appendix E Charging for infrastructure: international experience... 304
Appendix F Housing initiatives ... 312
References ... 316
Tables
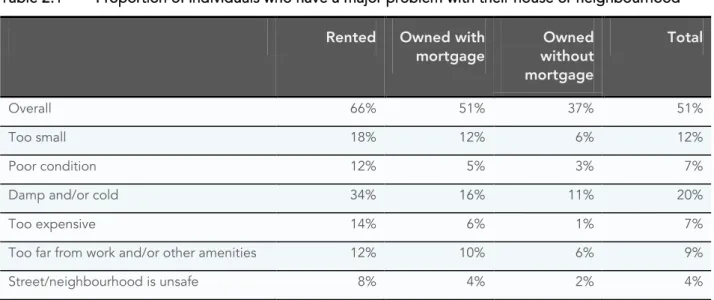
Table 2.1 Proportion of individuals who have a major problem with their house or neighbourhood ... 46Table 5.1 Proportion of home-owners by length of time in New Zealand ... 80
Table 7.1 Typical plan change and planning consent timeframes ... 120
Table 8.1 The share of development contributions in capital expenditure, selected councils, 2010–11 and 2011–12 ... 129
Table 8.2 Development contributions as a share of section prices ... 133
Table 8.3 Dispute resolution mechanisms – key attributes and trade-offs ... 150
Table 9.1 Breakdown of 2011/12 building consent charges by selected territorial authorities ... 156
Table 10.1 Percentage change in key material costs, 1995–2010 ... 175
Table 10.2 Trade prices for building materials in New Zealand and Australia ... 176
Table 10.3 Per square metre building costs in New Zealand and Australia ... 179
Table 10.4 Total building costs in New Zealand and Australia... 179
Table 10.5 Traditional versus integrated project delivery ... 187
Table 10.6 Highest qualifications held by individuals in construction industry occupations (2006) ... 190
Table 10.7 Productivity Partnership skills strategy for the construction sector ... 192
Table 10.8 Government investment in the residential building sector... 194
Table 11.1 Changes in the composition of the private rental market ... 199
Table 11.2 Proportion of individuals aged 65+ in low-income households (after paying for housing costs) by tenure, 2009 ... 205
Table 11.3 Current regulation relating to housing quality ... 206
Table 11.4 House price reductions required to reduce the number of intermediate renter households ... 212
Table 12.1 Projected clients for and supply of community and state housing ... 223
Table 12.2 Example of social service and housing provision ... 225
Table 12.3 Example of Accommodation Supplement reductions absorbing the benefit of reduced rents in the community housing sector ... 231
Table 12.4 Likely results of three options for funding the community sector differently ... 232
Table 12.5 Expenditure available to be reprioritised if entitlement to the AS is cut at various thresholds ... 233
Table 13.1 Profile of demographic groups by financial knowledge ... 242
Table 13.2 Features of microfinance and their applicability to repair loans on Mäori land ... 249
Table 13.3 Strengths and weaknesses of mutual insurance schemes ... 261
Table 13.4 Strengths and weaknesses for using the retirement village approach to licences to occupy on Mäori land ... 263
Table 13.5 Strengths and weaknesses of using the unit titles approach to managing a housing development on Mäori land ... 264
Appendix tables
Table B.1 Evaluation of development scenarios for Auckland... 284
Table B.2 Difference in net present costs between the Favoured and BAU scenarios ... 286
Table B.3 Discounted annual costs of services for expansion, Christchurch 1993 ... 288
Table B.4 Externalities associated with alternative urban development patterns ... 291
Table B.5 Variation in density associated with new residential lots, Australia and US 2008 ... 295
Table C.1 Robust regression results ... 298
Table C.2 Relative price differences on real land values to CBD ... 299
Table D.1 ULDA Strategies ... 303
Figures
Figure 1.1 Multiple determinants of housing affordability ... 24Figure 2.1 House prices, real and nominal... 29
Figure 2.2 The real house price boom in international comparison ... 30
Figure 2.3 Annual change in real house price by Territorial Authority ... 30
Figure 2.4 Convergence in real house prices over the 2000s boom ... 31
Figure 2.5 House price distribution in Auckland and rest of New Zealand ... 31
Figure 2.6 House prices, household disposable income and borrowing capacity ... 32
Figure 2.7 Price responsiveness of housing supply, selected countries ... 34
Figure 2.8 Land prices as a share of house values ... 35
Figure 2.9 House price to rent ratio ... 36
Figure 2.10 Rental affordability and tenure patterns, 1995-2009 ... 37
Figure 2.11 Tenure patterns in New Zealand ... 38
Figure 2.12 Growth in the rental market ... 40
Figure 2.13 Clustering of low-income renters, 1996-2006 ... 41
Figure 2.14 New housing investment, value distribution ... 42
Figure 2.15 House size in New Zealand ... 43
Figure 2.16 The age distribution of rental and owner-occupied dwellings ... 44
Figure 2.17 Dwelling type by number of bedrooms ... 44
Figure 2.18 The share of multi-unit dwellings in Auckland and Wellington ... 45
Figure 2.19 Share of rental and owner-occupied dwellings by capital value ... 47
Figure 3.1 The beginnings of a housing boom ... 51
Figure 3.2 A bank dominant financial system ... 52
Figure 3.3 Financial and non-financial assets (as a percentage of net disposable income 2009 or latest available year) ... 52
Figure 3.4 Housing equity withdrawal ... 54
Figure 4.1 House price ratio ... 59
Figure 4.2 Effective mortgage interest rate, real and nominal ... 60
Figure 4.3 Massey home affordability index ... 61
Figure 4.4 Real repayment stream of a 7% 25 year $100,000 mortgage (inflation=2%) ... 62
Figure 4.5 Real and nominal affordability indices ... 63
Figure 4.6 Housing affordability by income ... 64
Figure 4.7 Housing affordability by age ... 64
Figure 4.8 Affordability by ethnicity ... 65
Figure 4.9 Housing affordability median multiple ratings for New Zealand regions, 2010 ... 65
Figure 4.10 Affordability by region ... 66
Figure 4.11 Rent price component of CPI and overall CPI ... 67
Figure 4.12 Median rent-to-household disposable income ratio ... 67
Figure 4.13 Median rent-to-household disposable income by disposable income quintile ... 68
Figure 5.1 Average annual population growth for OECD countries, 2000-2009 ... 71
Figure 5.2 Net migration and natural increase in New Zealand ... 71
Figure 5.3 Net migration by selected regions ... 72
Figure 5.4 Average annual internal migration ... 72
Figure 5.5 Population growth by region, 2001–2010 ... 73
Figure 5.6 Family structure in New Zealand ... 74
Figure 5.7 Household size and proportion of population 65+ in 2006 ... 74
Figure 5.9 Proportion of population living in households requiring at least one additional bedroom,
by ethnic group ... 76
Figure 5.10 Household formation by region ... 77
Figure 5.11 Household formation projections by region ... 78
Figure 7.1 Growth in section and dwelling prices (house and land package) in selected regions 1992-2011 ... 108
Figure 7.2 Sales and prices in the Auckland real estate market ... 109
Figure 7.3 House Sales and Building in Auckland, 1996-2011 ... 109
Figure 7.4 The impact of the Auckland MUL on land prices ... 116
Figure 8.1 Council revenue 2003–2010 ($ million) ... 129
Figure 8.2 The application of development and financial contributions (2009/10) ... 132
Figure 8.3 The range of development contributions in New Zealand (43 councils) ... 133
Figure 9.1 Building blocks of the regulatory framework ... 155
Figure 10.1 Construction costs, building consents and inflation ... 173
Figure 10.2 Cost components of a standard new house, 2002–2011 (in 2002 $) ... 174
Figure 10.3 Labour costs ... 178
Figure 10.4 New Zealand construction industry productivity growth compared to measured sector (1978=1000) ... 182
Figure 10.5 Estimated size of builders in NZ and Australia and nature of dwellings built ... 183
Figure 10.6 Firm births and deaths as a proportion of total employees in New Zealand industries ... 184
Figure 11.1 Median rent-to-household disposable income by disposable income quintile ... 200
Figure 11.2 Proportion of Auckland renters (by income) spending more than 30% of their income on rent,1996-2009 ... 201
Figure 11.3 House price-to-rent ratio and long-term trends ... 202
Figure 11.4 Accommodation Supplement expenditure (2002 dollars) ... 209
Figure 12.1 Number of AS recipients receiving different payment levels ... 234
Figure 13.1 Percentage of urban Mäori households with incomes under $25,000 and $50,000 a year, at 2006 Census ... 240
Figure 13.2 Percentage of rural Mäori households with incomes under $25,000 and $50,000 a year, at 2006 Census ... 241
Figure 13.3 Percentage of urban Mäori households with incomes over $70,000 a year, at 2006 Census ... 241
Figure 13.4 Percentage of rural Mäori households with incomes over $70,000 a year, at 2006 Census ... 242
Figure 13.5 Number of shareholders and potential houses in a sub-region north of Hokianga ... 256
Appendix Figures
Figure B.1 Distribution of the costs of fringe development, Melbourne 1986 ... 292Figure B.2 Costs of fringe development by household type, Melbourne 1986 ... 293
Figure C.1 Impact of distance to Auckland CBD on real land values between 1995 and 2010 ... 299
KEY
F
FindingsOverview
Why is this inquiry important?
The Government has asked the Commission to evaluate the factors influencing the affordability of housing in New Zealand (both rental and owner-occupied) and to examine potential opportunities to increase affordability.
The context of this inquiry is the recognition that stability of the home environment is important for social cohesion and family stability. There is a concern that real (inflation-adjusted) house prices in New Zealand are markedly higher than they were a decade ago and that this has been associated with general declines in housing affordability and home ownership rates. These declines have contributed to increased demand for rental accommodation and additional pressure on the social housing sector.
The aim of this report is to suggest policy improvements that could enhance the performance of the housing market and the effectiveness with which it meets the needs of New Zealanders. This would be important at any time, but is particularly so in the aftermath of a house price boom between 2001 and 2007 that was unprecedented in recent history and one of the longest and steepest since data began (Figure 0.1). Real house prices almost doubled over this period, which equates to an average increase of 12% per year. The boom has started to unwind but house prices remain above long-term levels.
Figure 0.1 House prices, real and nominal
Source: Quotable Value and Statistics New Zealand Notes:
1. Real house prices are measured as the ratio of actual house prices to the CPI.
Although unprecedented in history, New Zealand’s recent house price boom occurred more or less at the same time as rapid house price expansions in a majority of OECD countries. Indeed, co-movements in real house prices have been unusually strong internationally over the 2000s, suggesting a significant role for global factors in propagating this period of real house appreciation (Box 1).
Box 1 What drove the surge in New Zealand house prices in the 2000s?
The sharp rise in house prices in New Zealand during the 2000s reflected a number of cumulative demand-side factors against a degree of stickiness in housing supply. Internationally, a range of influences came together to encourage a strong increase in credit growth, much of which increased effective demand for housing in a number of OECD countries:
The house price boom was more widely dispersed across the country than previous house price expansions. However, there were important exceptions to this trend – in the Queenstown Lakes District and
metropolitan areas in Auckland and Wellington, houses were among the most expensive in the country in the early 2000s, but these regions still experienced strong real house price appreciations over the boom. In Auckland – home to around one third of New Zealand’s population and 31% and 41% of its housing stock by number and value respectively – this continued a well-established trend of strong real house price increases relative to the rest of the country. As a consequence, the distribution of house prices in Auckland is now markedly different to that in the rest of New Zealand, particularly at the lower end of the Auckland housing market. For example, between 1995 and 2011, the gap between lower-quartile house prices in Auckland vis-à-vis the rest of the country increased by over 260% in real terms. The analogous figures for median and upper-quartile house prices are 230% and 150% respectively (Figure 0.2).
1 The OCR troughed at 4.75% at the beginning of 2002, but rates were under 6.00% from May 2001 to July 2004.
oil exporting countries worked to lower interest rates in global credit markets.
A move from an ‘originate’ strategy to ‘distribute’ strategy (securitisation) reduced the quality of the loan books in the United States without a commensurate increase in capital requirements for relatively risky loans.
A progressive relaxation of credit standards in originating banks also led to a reduction in the quality of banks’ mortgage portfolios.
Although these global factors increased credit availability in New Zealand, the impact on the mortgage market was less pronounced than in the United States. In particular, securitisation was nowhere near as prevalent as in the United States and there was not the same disassociation between lenders and borrowers. Intermediation continued to be the dominant model in New Zealand, implying little incentive for banks to expand loan volumes without paying adequate regard to risk.
On top of these global developments, a number of New Zealand-specific factors also worked to increase housing demand:
Strong natural population growth over the last 30 years.
Net migration flows turned from losses of around 10 000 people per year in 1999-2001 to strongly positive, peaking at over 40 000 people in 2003.
Partly reflecting a higher terms of trade, real GDP per capita increased by around 14% between December 2000 and June 2007. Rising household incomes increased effective demand for house ownership and for ‘trading-up’ to a larger, higher quality or better-located house.
Interest rates were relatively low in 2002 and 2003 when the OCR ranged around 5%.1 This partly reflected subdued inflationary pressure due in part to the falling price of a wide variety of imported goods as low-cost Asian manufacturing increased in scale and scope (Bollard and Smith, 2005). Lower interest rates also saw an adjustment in loan servicing capacity occur.
The New Zealand exchange rate was relatively low up to 2003 but began to increase thereafter as interest rates increased. A lower exchange rate may have increased the attractiveness of New Zealand residential property to overseas buyers.
As a result of house price inflation and financial market innovation, households felt wealthier and found it easier to ‘borrow on the house’ in the form of increased withdrawal of housing equity (Figure 2.5). The released funds were used for housing purposes (upgrading existing homes, ‘trading up’ to better ones and purchasing investment properties) that further fuelled the housing boom and also for spending on consumer goods and services.
Figure 0.2 Distribution of house prices in Auckland and the rest of New Zealand
1996 2011
Source: Productivity Commission calculation based on QV data Notes:
1. House price distributions are shown in constant (2011) dollars (deflated by the CPI).
What has happened to housing affordability?
House buyers
Ten years after the surge in house prices began, national measures of house price-to-disposable income ratios remain elevated and would require sharp falls in house prices to return to long-term averages (Figure 0.3). Affordability measures that include financing costs are currently closer to longer-term averages, owing to interest rates that are low compared with earlier times (Figure 0.4). This is often over-looked.
Figure 0.3 House price to disposable income ratio
Figure 0.4 Massey home affordability index
Source: Massey University Real Estate Analysis Unit. Notes:
1. A low index indicates improved affordability.
These aggregate measures do not necessarily indicate what is happening to affordability for different types of households. Disaggregated measures indicate that:
Affordability pressures are particularly evident in Auckland, reflecting that city’s higher house prices.
Housing affordability is lowest among those who are younger, single, have lower income and wealth, or belong to an ethnic group other than New Zealand European.
During the last house price boom, housing affordability became a constraint for some middle-income groups, whereas it had previously mainly been an issue for those on lower incomes. It is not yet clear if this is a cyclical phenomenon or a structural trend.
Renters
During the house price boom, rents increased at around the same rate as generalised inflation. Across territorial authorities, rents grew in a relatively tight range of 2.3% per year (in Dunedin City) to 8.2% per year (in Buller District). In all cases, rent increases were significantly less than real house price inflation and the ratio of house prices to rents increased markedly, a departure from the long-term broadly stable relationship.
This apparently benign aggregate situation disguises a more difficult position for renters on lower incomes. In particular, people in the lowest two income quintiles spend a much higher proportion of their income on rent than people on higher incomes (Figure 0.5). Even though the situation appears to have improved since the late 1990s, those in the two lower income quintiles still spend, on average, more than 30% of their disposable income on rent, after allowing for government assistance.
Figure 0.5 Median rent-to-household disposable income by disposable income quintile
Source: Productivity Commission and Treasury calculations using Statistics New Zealand Household Economic Survey (HES) data. Notes:
1. HES was not conducted in 1999, 2000, 2002, 2003, 2005 and 2006. Data for these years was interpolated.
2. Income quintiles are based on the entire HES sample.
3. The 2010 quintile 1 figure is excluded because there is some uncertainty about its reliability (Perry, 2011).
When house prices increase, households that have to spend a large proportion of their income on rents will find it hard to save for a deposit for a house. Between 2001 and 2006, as rising house prices pushed the affordability constraint further up the income distribution, the number of ‘intermediate renters’ – households with at least one person in employment who cannot afford to buy a dwelling at the lower quartile price assuming standard bank lending criteria – increased by over 150% to 187,400 households or 58% of all private renters. Driven in part by declining interest rates, the share of intermediate renters is estimated to have declined since 2006. One in three renters – and a large proportion of intermediate renters – lives in Auckland.
What are the key features of the housing landscape?
Many features of the housing landscape influence housing affordability, which implies that opportunities for improving housing outcomes are likely to be found in many places. A number of factors are small though cumulatively important, other factors are more significant. As a backdrop to the Commission’s suggestions for improving housing affordability, the report outlines key features of the landscape that influence the demand for housing, the supply of housing and the institutional framework within which it operates.
Housing is a house/land package
Housing is a house/land package, as land has to be developed and serviced with infrastructure before it is usable for housing. This inquiry therefore examines the determinants of the cost of land, of the
infrastructure needed to service that land, of building materials, and of the costs of assembling those materials to build a house.
Section prices have grown more quickly than house prices over the last 20 years, indicating that
appreciating land prices have been a key driver of house price inflation in New Zealand. This suggests a shortage of residential land in places where people want to live. Land price pressures have been particularly acute in Auckland, where section prices now account for around 60% of the cost of a new dwelling,
compared with 40% in the rest of New Zealand.
Although much of New Zealand’s land area is unsuitable for residential development, the country’s low population density is such that the potential supply of raw land is relatively abundant. While pressure on land prices in the biggest and fastest growing centres is expected, the movements in recent years seem excessive. This implies that policy and planning practices may be constraining the supply of residential land. For example, strong land price pressures in Auckland raise questions about the impact of policies aimed at
increasing density – such as the Metropolitan Urban Limit (MUL) and other planning restrictions – on housing affordability. A major challenge ahead is to improve land release and planning approval processes so that affordability considerations are integrated fully into spatial planning.
A distinctive feature of residential investment in New Zealand, which may be linked to rising land prices, is that new supply has tended to come in the form of large and relatively expensive houses or, to a lesser extent, apartments that are targeted at the top end of the market (Figure 0.6). As such, the majority of new dwellings are currently not targeted at the affordable end of the market, adding to the difficulties faced by intermediate renters seeking to buy a ‘starter’ home.
Figure 0.6 New housing investment, value distribution
Source: Productivity Commission calculation using QV data Notes:
1. For each year, the data show the share of new houses that are valued within each quartile of the value distribution for the existing
housing stock.
Underlying demand has been strong and is projected to continue increasing
Responsive land release and planning processes are likely to be particularly important given projections that underlying demand for housing will be strong, driven by household formation, which depends, in part, on population growth and factors that determine household size. New Zealand’s natural population growth has been strong, while migration flows have been highly variable and often focused on Auckland. Population growth has been unequally distributed across the country, largely as a result of internal migration patterns and the regional preferences of international migrants.
Demographic changes – such as population ageing, cultural and ethnic diversification and a radical transformation in family structures – have also been a feature of recent years and have tended to segment housing markets. Changes in New Zealand’s ethnic structure have increased average household size in some areas while the ageing population structure has tended to reduce it elsewhere. The net effect has been an overall fall in average household size and an associated increase in household formation.
Looking to the future, net household formation in New Zealand is expected to continue to increase as the population continues to grow and households become yet smaller. While the extent to which this
underlying demand for housing becomes effective depends on whether households have the capacity to pay for housing, demographic projections suggest a need for home construction volumes to increase.
The housing market is segmented
Housing growth will not, however, be uniform across the country. There are stark regional differences between housing markets. Statistics New Zealand’s projections suggest that Auckland will have the largest increase, accounting for 60% of New Zealand’s population growth and for almost half the number of new households, followed by Wellington and Canterbury. Auckland is also expected to have the highest growth rate in household formation.
One consequence of this segmentation is that adjustments to changing housing needs and preferences will create market and price pressures that are likely to differ across New Zealand. While a complex web of demographic influences are at work in New Zealand, the outcome overall is that household formation is concentrated in and near Auckland and is likely to remain so for the next few decades. For that reason, the challenge of providing adequate housing is largely an Auckland one. A small number of regional centres will also face challenges, albeit to a lesser degree.
The rental market is important
The stability of rents while house prices were rising over the 2000s boom allowed the rental market to act as a ‘safety valve’ in the face of rising house prices. As house prices increased rapidly, the rental market
expanded to accommodate an increasing number of households that favoured renting over home ownership, given its relative affordability compared to home ownership.
This exacerbated a trend that had been under way for some time (Figure 0.7). Home ownership peaked in the late 1980s/early 1990s, when around 75% of private dwellings were owned by their occupants. Since then, ownership levels have dropped to around 65% – which is about average for the group of OECD countries for which data is available. Currently, around 408 000 households are estimated to live in private residential rental accommodation. The decrease in home ownership since the end of the 1990s has been particularly marked in Auckland, where around 40% of households now rent (Figure 0.8).
Figure 0.8 Regional profile of tenure type
Source: HES, OECD, NZ Census
Investment in the rental market
Most investors in New Zealand’s rental market are relatively small scale. Landlords have been prepared to accept low yields on their rental properties, in part because of expected capital gains in housing and lack of confidence in other investment markets. Although estimates vary, the net cash yield on rental properties over the 2000s house price boom is estimated to be well below 4%. In contrast, capital gains have been relatively strong until recently and New Zealand home owners have, on average over the 2000s, enjoyed superior returns compared to investing in the share market.
However, since the end of the 2000s boom, capital gains on rental properties have diminished significantly. Although difficult to judge, demand pressure may already be working to increase rents in the bigger cities, with recent data indicating that rental households on middle incomes are spending an increasing share of disposable income on rent.
Outside of student accommodation and retirement villages, large-scale landlords have a very limited presence in the New Zealand market. A low cash yield is likely to be one reason why institutions have been reluctant to enter the rental property market. In effect, they have been crowded out by small scale private investors. The large scale of investment required to assemble a suitably diverse portfolio of rental
properties in different locations with different demographic exposures is also often cited as a barrier to institutional investment in the sector. Challenges around capturing any construction scale economies in the sector may also be inhibiting large-scale involvements. Reflecting these barriers, the share of people living in rental properties owned by private businesses, trusts or other organisations has remained low at under 5%, indicative of a very low level of institutional involvement in the sector.
The residential building industry is fragmented with low productivity growth
In a typical year, the residential building industry builds about 24,000 new homes and renovates about 32,000 homes. The industry is essentially a fragmented ‘cottage industry’ dominated by very small
independent builders constructing bespoke homes. Sole traders (with no employees) are the most common firm size and businesses employing more than 20 employees constitute only 9% of total sector
employment. Most builders construct one house at a time: in the year to May 2010, 4,604 firms built just one house during the year. In contrast, only 30 firms built more than 30 homes, while just 5 firms built more than 100 houses. As noted earlier, most new homes are being built for the upper end of the market. Productivity growth is below that of other New Zealand industries and below that of building industries in other countries. Submissions also pointed to problems such as projects exceeding budget and agreed timeframes, non-compliant or defective work, and reliance on lower quality materials which have a shorter life-span and require higher levels of maintenance.
The building materials industry is concentrated but still small scale
Manufacture and distribution of building materials is relatively concentrated in New Zealand, which has prompted claims that the market suffers from a lack of competition. The firms concerned nevertheless appear unable to reach the scale necessary to match international product prices.
Materials account for around half of all residential construction costs. Material costs for a standard home (excluding those installed by sub-contractors) increased by 19% in real terms between 2002 and 2011. However, around one third of this increase is due to changes in the nature of materials used (for example, the introduction of double glazing to meet revised thermal efficiency guidelines in the Building Code) rather than the cost of specific materials. As such, real price increases for individual materials appear to have been relatively modest. Nevertheless, the cost of building materials in New Zealand is significantly higher than in Australia, and is one reason for the higher cost of building construction in this country, with adverse implications for housing affordability.
Councils perform key roles in the housing market
Councils have a major influence on all stages of house construction, as they are responsible for urban planning, including the release of land for development and zoning decisions; providing or arranging for the provision of infrastructure to land that is to be developed; issuing building consents that are required before buildings are demolished, removed, constructed or altered; and ensuring compliance with the Building Code.
The construction and land development sectors are more responsive to changes in housing demand in some parts of the country compared to others. There is also some evidence that, in areas of the country where housing supply is more responsive, an increase in housing demand results in relatively more houses and smaller increases in real house prices, with beneficial implications for housing affordability. Although difficult to show conclusively, differences in supply responsiveness at the territorial authority level may, in part, reflect the efficiency with which local councils implement and enforce regulations governing the land development and building sectors.
Where has the Commission found opportunities to improve
affordability?
The Commission has reviewed these features of the housing landscape in order to identify opportunities to improve the housing sector’s capacity to meet consumers’ preferences for housing that is safe, comfortable and affordable. While housing is largely a private market, the way in which the market operates is heavily influenced by its regulatory and institutional framework. Hence the Commission has focused on ways to improve this framework. While many of the Commission’s proposals apply nationally, there is a particular focus on Auckland, given that the challenge of providing adequate housing for a rapidly growing
population is largely one for Auckland, although a small number of regional centres will also struggle. The Commission has also concentrated on ways to increase affordability for those on lower incomes, where the biggest social issues are found.
Planning
Urban planning requires consideration of a wide range of objectives, including environmental management and economic development goals. Planning practices have not adapted to be able to adequately manage and balance these multiple objectives.
The prevailing approach to urban planning in New Zealand reduces housing affordability in our faster growing cities. The widespread planning preference for increasing residential density, while at the same time imposing restrictions such as minimum lot size and height restrictions, and limiting greenfield
development, places upward pressure on house prices across the board. Constraints on the release of new residential land create scarcity, limit housing choice, and increase house prices. These impacts may be disproportionately felt in particular areas. In Auckland the MUL is a binding constraint on the supply of land for urban growth and has increased section prices within the city. This is indicated by the large differential between land prices 2 kilometres inside and 2 kilometres outside the MUL (Figure 0.9), which suggests that
Auckland Council’s proposed compact city approach, based on containment of the city, undermines the aspiration of affordable housing. An immediate release of land for residential development would ease supply constraints and reduce the pressure on prices. This could be achieved by a combination of bringing significant tracts of greenfield and brownfield land to the market. Auckland Council should show in its final Auckland Plan how it has considered and reconciled affordable housing with its other priorities.
Christchurch Council should also increase the supply of land and councils in other high-growth centres should explore the options for doing so.
Figure 0.9 The price multiple of land 2km within the Auckland MUL to land 2km outside the MUL
Source: Productivity Commission modelling
More generally, a shift in philosophy may be called for, based perhaps on zoning areas from which
development is to be excluded and then allowing market forces to determine appropriate land uses on the balance (subject to complying with environmental standards), with councils using their infrastructure planning as a means to signal where development will take place and under what time-frame.
In New Zealand, the slow pace at which land for housing is planned, zoned, and released contributes to the high price of sections and thereby house prices. Long development lead times have been identified as a problem, taking between two and ten years because of regulatory complexities. Councils should review their regulatory processes with the aim of providing simplified, speedier and less costly consent processes and formalities, to expedite the supply, and reduce the cost, of housing.
However, while councils’ time planning and consenting processes are part of the problem, the regulatory system itself is a factor. Inquiry participants consider that the Resource Management Act (RMA) in particular is overly complex, giving rise to unnecessary costs, duplication, delays, and uncertainty, which may deter new development. The RMA also has limited capacity to adequately consider the benefits of urban development that would lead to affordable housing.
Planning must take account of the RMA, the Local Government Act (LGA) and the Land Transport
Management Act (LTMA). These statutes have different legal purposes, timeframes, processes and criteria. With multiple participants and decision-makers, there is no single mechanism for facilitating engagement, securing agreement among participants and providing information for robust decision-making. The Government should consider the case for reviewing planning-related legislation.
A consequence of local government planning policies is the spillover effects for central government. Unaffordable housing increases the requirement for state-sponsored or subsidised housing while high rentals and house prices increase the need for welfare assistance by way of the Accommodation Supplement to meet housing costs. The other manifestation of housing shortages – overcrowding and dependence on poor quality housing stock – impacts adversely on health, education and community outcomes. This stores up long-term fiscal liabilities and potentially undermines productivity and national wealth. There appears to be an absence of a balanced framework in which the impacts of local government decisions – in this case relating to urban land use – on wider government policies, programmes and
objectives can be examined.
Resolving the issues surrounding the legal, institutional and decision-making frameworks in which urban planning occurs will take time. However, there are a number of measures that councils should progress that
will remove impediments to the supply of housing. Specifically, a more balanced approach to urban planning is required in the interests of housing affordability. Land for housing can come from the development of brownfields sites, by infill development in existing suburbs and by making suitable greenfields sites available, ideally in a complementary manner and in a way that provides for substantial short, medium and long-term capacity.
The Commission recommends that territorial authorities:
take a less constrained approach to the identification, consenting, release, and development of land for housing in the inner city, suburbs, and city edge;
adopt a strategy that allows for both intensification within existing urban boundaries and orderly expansion beyond them;
investigate barriers to densification and consider more flexible approaches to achieve a balance between neighbourhood amenity and new development in existing suburbs;
develop strategies that promote adequate competition between developers for the sale of construction-ready sections.
Paying for infrastructure development
There are two forms of infrastructure charge against new developments in New Zealand: financial and development contributions. The former focuses on the environmental effects of particular developments; the latter are intended to compensate councils for incremental capital expenditure associated with development on such facilities as reserves, networks and community infrastructure.
These charges are applied widely across New Zealand and collected $267m in 2008 (June year), amounting to 4.5% of total local government income (equivalent to 7.5% of rates income). Water supply and waste water infrastructure are funded through development contributions by more councils than other types of infrastructure, and tend to attract the highest charges.
The level of charges varies considerably between councils and between types of infrastructure, but can be significant. While some councils do not apply these charges, in other cases they can exceed $40,000 per developed section; charges of $20,000 per section are not uncommon. Overall, the increase in
development charges is not enough to explain the surge in house prices in the early 2000s (for example, one survey of 10 regions suggested that development contributions made up between about 1% and 10% of median section prices, whereas prices doubled during the boom, as noted earlier), but they affect affordability and because they are charged upfront they oblige households to take on larger mortgages. Charging for infrastructure, if implemented well, encourages efficient locational choices in the development of housing. It requires considerable skill and information, however, to design and implement charges that accurately reflect costs. The Commission has been made aware of concerns about the way in which these charges are applied in New Zealand and suggests some ideas for addressing them.
A strategy for taking advantage of the potential efficiency and equity benefits of development and financial contributions, while reducing current problems, could involve three elements.
The development of a set of best practice development contribution guidelines that would cover when development contributions should be used, how they should be calculated, and how costs should be recovered. The principles in such guidelines should be incorporated into Schedule 13 of the Local Government Act.
A range of measures would help councils to implement the guidelines. These include training about how to implement the guidelines and establishing a quality assurance process to help councils to implement them effectively and share the lessons from experience.
Strengthening the incentives for good practice by increasing the scope to challenge the way in which councils set and administer development contributions. There is a range of options, with differing
degrees of costs and formality. The Commission favours improving the scope for mediation as an initial step, with the scope to challenge in the District or Environment Court a future option that could be implemented if mediation does not deliver sufficient benefits.
Greater discipline around infrastructure charging will put downward pressure on the cost of new residential development, and improve the quality of decision-making around infrastructure funding. They are, however, a small part of the governance framework within which councils operate, and would not fully address issues around how councils arrive at the overall level, composition and timing of infrastructure that they seek to fund through infrastructure charges. Effective governance of infrastructure assets is critical. Analysis of these broader issues would include matters such as:
the appropriate role for councils in planning and providing infrastructure such as the three waters (which in some jurisdictions are not provided by councils);
the appropriate corporate form for the entities that provide infrastructure when this remains within councils; and
reporting and accountability arrangements.
Building regulation
Many inquiry participants raised concerns about quality, timeliness, cost and consistency in their interactions with the building control system. Regulations relating to building construction can affect the cost of building or renovating a house in six main ways.
Imposing standards that buildings must meet with respect, for example, to durability and safety, which exceed levels that consumers would otherwise choose.
There are costs to administer regulation, some of which are passed on to homebuyers.
Inconsistent or slow enforcement of regulatory requirements can delay project completion or otherwise increase project costs.
Regulation can affect the incentives to innovate with new materials or processes.
Regulation can influence how risks are shared between different parties – home owners, architects and engineers, builders and subcontractors, material suppliers and regulators.
The structure of the building consenting and inspection service can influence costs. Small building consent authorities (BCAs) may suffer from diseconomies of scale or be unable to take advantage of efficiency-enhancing technology, adding to the costs of administering building regulations.
The Commission cannot be sure that the benefits justify the costs generated by the building control framework:
There is evidence that the regulatory framework, and its interaction with legal rules, impedes innovation in the building industry and efficiency in the building consents process.
There are strong incentives for BCAs to be risk averse, and this can add to building costs.
There is a widespread perception in the building industry that the building consent process takes too much time, and requires too much documentation and too many building inspections, all adding to the cost of building.
There are opportunities to drive greater consistency and efficiency in the building regulatory system through shared use of technology and consolidation of building consent functions.
Little is known about the quality of New Zealand housing. The information gap compromises efforts to assess whether building outcomes are improving, due to the efforts of the building industry and its interactions with the regulatory framework.
The Government intends to change the industry’s regulatory arrangements, in part to alter the allocation of risks in the building sector. Overall, it is difficult to predict whether the costs the reforms will impose on industry participants will be justified. The Department of Building and Housing (DBH) should report on its evaluation of the reforms five years after introduction.
The Commission has eight suggestions for additional reforms.
To encourage housing standards to be set at a level that maximises their net benefits, the Treasury Regulatory Quality Team should review the quality and robustness of the DBH’s use of Regulatory Impact Statements for changes to the Building Code.
To reduce delay costs with issuing building consents, DBH should publish, for each BCA, the total time taken between receiving applications and finally granting consents, and the number of times each BCA has used the provision to ‘stop the clock’ when it seeks more information. DBH should audit the ‘stop the clock’ information from a sample of BCAs.
Territorial authorities should find ways to expedite the building consent process and improve communication between building practitioners and BCAs.
The joint and several liability rule that applies in the building industry is likely to make BCAs more risk averse, because it potentially exposes them to the full costs of remediating defective building. The Law Commission should consider in its review of joint and several liability the interaction between liability rules and the structure of industries and industry practices, and the impact of joint and several liability incentives faced by regulators.
To reduce the costs faced by builders seeking approval for an innovation as an ‘alternative solution’, DBH should provide more support to assist designers and BCAs about what is required for an alternative solution to comply with the Building Code. DBH should also investigate pathways through which alternative solutions can evolve into mainstream practice.
There has been low uptake of the ‘Multi-proof Building Consent’ – a scheme introduced in 2010 to produce time and cost savings for volume builders by removing the need for the same or similar building designs to be repeatedly assessed for compliance by individual BCAs. DBH should identify the barriers to using this form of consent, and suggest ways to overcome them.
DBH should report on the ways in which the building control system can improve the diffusion of knowledge and information in the building sector, including rapid dissemination of information about defects in materials, designs or building methods.
Urgency should be given to DBH’s programme to lift the performance of BCAs and promote greater consistency and efficiency in the building regulatory system.
The building industry
There is scope to improve the productivity of the residential building sector and so reduce construction costs. Key barriers to productivity growth are the industry’s small scale, low levels of innovation, skill issues and the ‘bespoke’ nature of our homes. Little can be done about market characteristics which reflect consumer preferences and the small size of the New Zealand market. As such, the Commission advocates a multi-faceted approach which includes greater innovation and measures to raise skills levels.
First, the small size of most firms prevents them from taking advantage of scale economies that could lower their costs. Some barriers to expansion, such as the small size of some regional markets and consumers’ preferences for bespoke designs, are inherent in the New Zealand market. Little evidence has been presented to the inquiry about regulatory impediments to the growth of firms, although the Commission’s proposals for freeing up land supply and the consent process may enable new housing developments on a greater scale.
Second, the industry is fragmented vertically and relies on an increasing number of different sub-trades. Sub-contracting, or outsourcing services is common. Houses are often built using a staged step-by-step
approach, with individual trades working sequentially in isolation from each other. This can result in time delays and associated holding expenses caused by sub-contractors not being on site when required, as well as the need for re-work. Improved management skills and practice, together with greater uptake and implementation of collaborative working principles, could help increase the efficiency of building processes and improve industry productivity.
Third, industry procurement practices exacerbate the disconnection between main contractors and sub-contractors. The establishment of best practice guidelines, appropriate to the New Zealand context, would be beneficial. The Building and Construction Sector Productivity Partnership is an appropriate organisation to undertake this work.
Fourth, inquiry participants raised a number of issues relating to low skill levels in the industry. The Building and Construction Sector Productivity Partnership has developed a skills strategy document for the industry that matches closely the issues raised by inquiry participants in this inquiry. Addressing these skills issues will play an important role in lifting industry productivity, along with the phased implementation of
occupational licensing – the Licensed Building Practitioner (LBP) scheme – covering designers, builders, site supervisors and trades-people such as carpenters, roofers, plasterers and bricklayers.
Taxation
Taxation affects the attractiveness of investing in housing and its affordability, although the impacts are difficult to quantify and depend on factors such as tax design and key features of housing markets. In New Zealand, as in many countries, whether housing is ‘tax-favoured’ was debated during the recent upswing in the housing market. Although there have been several reviews of the taxation of housing, significant questions remain unanswered. These include, for example, whether capital gains, and the benefit derived by owner-occupiers from living in their own home, should be included as taxable income.
The current taxation of housing is not ideal:
The tax system favours investment in owner-occupied housing to the extent that these houses are financed by owner-equity, although property taxes (rates) levied by territorial governments and the shift from income taxes to GST act to level up the playing field. Also, to the extent that owner-occupied housing is financed by debt, that debt is taxed heavily, given that tax is applied to the full amount of nominal, not just real, interest in the hands of savers.
Investment properties are subject to GST and local government taxes and returns to equity are taxed. However, the ability of the investor to claim a nominal deduction for borrowing costs, which exceeds real borrowing costs, is a potential tax subsidy.
Capital gains on housing generally fall outside the tax net. These gains were substantial during the recent boom, but it is difficult to predict how large they will be in the future.
House price inflation and leveraging up of rental investments in the early 2000s created opportunities for rental investors to achieve positive economic returns, including capital gains, whilst reporting tax losses. It is likely that there will have been some downward pressure on rental income as a result of the expanding supply of rental properties and landlords seeing less need to maximise rental income, given the perceived capital gains and ‘tax breaks’. In effect, investors may have traded away some portion of those gains by accepting lower rents. It is also possible that, over the longer run, the capital gains and ‘tax breaks’ may come in below what was being anticipated (particularly now that depreciation
deductions have been eliminated). If that proves to be the case, the economics of the rental market ahead could look quite different from in the 2000s, resulting in both less investment and higher rents than in the last decade.
Notwithstanding these features of current tax arrangements, there is not a pressing case for changing the taxation of housing in isolation. Suggestions for reform need to strike a balance between taking the existing tax system as it is and considering how the taxation of housing can be best made to fit within that, and a more ‘first principles’ approach. For example, the current income tax system is a ‘nominal’ system – it taxes ‘nominal’ rather than a measure of ‘real’ (inflation-adjusted) income. Yet a key issue in relation to the
taxation of housing concerns interactions amongst inflation, house prices (capital gains), and interest rates. This issue cannot be addressed in the context of housing alone, since it also, unavoidably, involves aspects of the taxation of personal interest income, business interest expense, and capital gains/losses across all asset classes.
Addressing particular anomalies in isolation from a broad review of the tax system would further complicate the system and could have unintended effects on housing markets and housing affordability.
The private rental market
During the recent house price boom, the private rental market expanded rapidly, and the number of intermediate renters, who might have expected to have transitioned into home ownership, has doubled. While lower income renting households (the two lowest quintiles) spend on average more than 30% of their income on housing, and have done so for a long time, rental affordability has become an issue further up the income distribution – in the $50k-$70K income range – particularly in Auckland.
Importantly, any increase in rents would be felt most acutely in Auckland, where 42% of households rent (including those who rent state houses), as opposed to 32% for the rest of New Zealand.
The Accommodation Supplement – weekly payments administered by the Ministry of Social Development – helps people to pay their accommodation costs. The total annual cost of this programme is just under $1.2 billion. While this programme reduces the pressure on low income households, the bottom 20% of
households still pay more than 40% of their disposable income on rent.
There is evidence that housing quality issues such as dampness, poor sanitation and thermal inefficiency are more prominent in rental housing, and inquiry participants raised concerns about the short duration of tenancy agreements. People who enter retirement while renting may face financial hardship.
There are no obvious policy options that would significantly improve outcomes in rental markets.
Setting minimum standards for rental accommodation, or requiring disclosure about the quality of rental accommodation, could impose large costs. There is a stronger case for voluntary disclosure, although this is more likely to be taken up by landlords at the upper end of the market.
Increasing the Accommodation Supplement would involve a significant cost and the extent to which the Accommodation Supplement works its way into rental prices is unclear.
Assistance programmes designed to help facilitate the transition to home ownership have generally proved ineffective. Better targeting of these programms may improve their effectiveness.
With policy options such as these unlikely to have a significant effect on outcomes, a more viable strategy is to:
focus on the options intended to improve the affordability of housing across the board, which would make it easier for renters to become homeowners while also mitigating the pressures for rent increases;
have a targeted social housing programme to assist those in the greatest need.
Social housing
Government owns 69,000 state houses with a total value of about $15 billion. Most are rented to tenants who pay a subsidised rent which is capped at a certain proportion of their income (income-related rent). The difference between market rents and income- related rents (the income-related rent subsidy) was $564 million in 2010/11. Additionally, Government invests significant amounts in maintaining, upgrading and managing state houses. HNZC returned a $71 million dividend to the Crown in 2010/11.
State housing is not always matched to those individuals or areas where there is the greatest need, and the stock is old and needs upgrading. HNZC’s role has been refocused to providing accommodation “for those who need it for the duration of that need”.