The Astrophysical Journal, 624:946-956, 2005 May 10 © 2005. The American Astronomical Society. All rights reserved. Printed in U.S.A.
ABSOLUTE
PARAMETERS
FOR
EIGHT ECLIPSING
BINARIES
IN
THE LARGE MAGELLANIC
CLOUD:
THE MASS-LUMINOSITY RELATION
1
1 Based on observations obtained at the European Southern Observatory, Paranal, with VLT UT2 (Kueyen); ESO programs 68.D-0328(A) and 70.D- 0191(A).
2 Member of Consejo Nacional de Investigaciones Científicas y Técnicas de la República Argentina (CONICET).
3 Member of CONICET; on leave from Facultad de Ciencias Astronómicas y Geofísicas, Universidad Nacional de La Plata, Argentina.
Jorge Federico González2 and Pablo Ostrov2
Complejo Astronómico El Leoncito, Casilla de Correo 467, 5400 San Juan, Argentina; [email protected] NidiaMorrell3
Las Campanas Observatory, The Carnegie Observatories, Casilla 601, La Serena, Chile AND
Dante Minniti
Department of Astronomy, Pontificia Universidad Católica, Casilla 306, Santiago 22, Chile; [email protected]
Received 2004 May 5; accepted 2005 January 17
ABSTRACT
A simultaneous light and radial velocity analysis of eight Large Magellanic Cloud (LMC) eclipsing binaries is presented. Combining spectroscopic observations obtained with UVES at the ESO Very Large Telescope and light curves available from the MACHO and OGLE databases, accurate masses and radii for the binary components, along with their spectral types and luminosities, are derived. These determinations allow us to construct the first mass-luminosity relation for late O and early B type stars in the LMC. This mass-luminosity relation looks very similar to that of the Milky Way, in spite of the different metallicities. The good agreement achieved in the com parison with recent theoretical isochrones is encouraging regarding the reliability of star models up to 20 M&. Subject headings: binaries: eclipsing — Magellanic Clouds — stars: early-type — stars: fundamental parameters
1. INTRODUCTION
The combination of light and radial velocity (RV) curves allows the determination of masses and radii of double-lined eclipsing binaries. The physical parameters so derived are par ticularly reliable in the case of well-detached systems, where the geometry of stars is nearly spherical and no strong inter action effects are present. If no mass exchange has occurred, stellar sizes and mass estimates for these systems can be com pared with results from numerical evolutionary models of sin gle stars.
The only galaxy for which the mass-luminosity relation has been obtained is the Milky Way. The study of Magellanic Cloud eclipsing binaries is an especially interesting opportunity for ex ploring the behavior of this relation in an environment of met- allicity lower than that of the Milky Way. This would allow to test the models of stellar evolution and the universality of such a relation.
The quality and quantity of photometric data for eclipsing binaries, as well as the number of known systems, has been rapidly increasing in recent years as a consequence of the sys tematic microlensing surveys such as the MACHO, EROS, and OGLE projects (Alcock et al. 1997; Grison et al. 1995; Udalski et al. 1998, respectively). However, the progress in the acquisition of spectra for those systems is comparatively slow because large telescopes and expensive observing time are required.
In 2001 December, we started at the E SO Very Large Telescope a project devoted to obtaining UVES high-resolution spectra in order to derive physical parameters for Large Magellanic Cloud
(LMC) eclipsing binaries selected from the MACHO catalog (Alcock et al. 1997). Since our aim is to establish the empirical mass-luminosity relation for the stars in the LMC, we included in our sample targets showing light curves that are characteristic of detached binary systems.
In this paper we present the results for eight detached eclips ing binary systems already observed. By means of a simulta neous light and RV curve analysis we are able to derive accurate masses and radii for the stars in the observed sample. The com ponents of those binary systems have early spectral types, be tween 08.5 Vand B6 V, and short periods (~3 days). Using the parameters here obtained and those for other well-studied sys tems from the recent literature, we are able to construct a first mass-luminosity relation for the LMC.
2. SPECTROSCOPIC ANALYSIS AND RADIAL VELOCITY MEASUREMENTS
2.1. Observations and Their Reduction
The spectroscopic observations were carried out with the UV-Visual Echelle Spectrograph (UVES; D’Odorico & Kaper 2000) at the ESO-VLT Unit Telescope 2 (Kueyen) during 5 nights spread over two observing runs: 2001 December 5-7 and 2002 December 12-13. The setting used produced a blue spectrum covering the region 3260-4520 A and a red one spanning from 4580 to 6690 A. The spectral resolution (2 pixels) is 58000 and 67000 in the red and blue regions, respectively. The high-gain, 2x2 binning mode was used. These spectroscopic observations were obtained in nearly quadrature phases, according to the pho tometric ephemeris published by Alcock et al. (1997). Individual exposure times ranged from 20 minutes to 1.5 hr. Long exposures were usually split into three parts.
The data were reduced with the standard routines of the IRAF-Echelle package. The spectra are of high quality: S/N per pixel was about 35-50 for the individual spectra. Figure 1 shows a small portion of typical spectra analyzed in this paper, 946
EIGHT ECLIPSING BINARIES IN THE LMC 947 ---- 1---1--- 1--- 1--- 1---1---1--- 1--- TABLE 1
Reference Stars 70.6097.13
Object Spectral Type RV(km s ')
V 78.6827.66 6.5730.3092 79.5017.83 78.6827.66 6.5730.3092 80.7436.52 60.7438.42 79.5017.83 1.4290.113 I 4000 l I I I L 4025 4050 4075 4100 4125 Wavelength (angstroms) I 4150 I 4175
Fig. 1.—Illustrative section of the unsmoothed target spectra. The orbital phases correspond to maximum difference RVi — RV\.
containing H<5 and several He i lines at 4009, 4026, 4121, and 4144 A.
2.2. Spectral Classification and Radial Velocity Measurements
The spectral types were assigned applying the classification criteria described by Walbom & Fitzpatrick (1990) to the ob served spectra. Alternatively, the Digital Spectral Classification atlas by Gray (2000) was used, especially for spectra later than B3 V. Typical uncertainties in our classifications are of 1 spec tral subclass, mostly originating from insufficient S/N, making the evaluation of faint spectral lines difficult.
For the RV measurements of double-lined spectroscopic bina ries, we used the technique TODCOR (Zucker & Mazeh 1994), especially developed for dealing with composite spectra. This method is a double correlation against two templates and has been shown to be useful in deriving reliable velocities of short-period binaries for which the spectral lines of the two components are strongly blended. As in González & Lapasset (2003), we used as templates observed spectra of slowly rotating stars, previously convolved with calculated rotational profiles.
With this aim, we observed with the same instrument five early- type slowly rotating stars with spectral types in the range O9-B4. The RV s of these spectra were determined by measuring between 20 and 30 metallic and helium lines. The root mean square (rms) of the line measures was typically 2 km s 1, and we estimate the probable error o f the final RVs to b e about 0.5 km s 1. Table 1 lists the spectral types and measured RVs of the five reference stars.
For the cross-correlation of the object spectra we used selected spectral windows, including most of the metallic and helium lines and excluding the broad H i lines, interstellar lines, and regions without lines. The resulting RVs for the individual observations are listed in Table 2: MACHO identification num bers, heliocentric Julian Dates, orbital phases, RVs and their er rors for both binary components, and observed-minus-computed differences are given. RV errors were assigned as in González & Lapasset (2003). Since most of the spectra were obtained near quadrature phases, the main source of error is not related to the line blends but to the noise of the data.
2.3. Spectroscopic Radius Ratio
Considering that it is often difficult to obtain the radius ratio from the light curves, especially in binaries without total eclipses,
HR 2806... 09 V 24.3 HR 1855... B0 V 16.8 HD 37042... Bl V 29.5 HR 1443... B2 VI-V 12.0 HR 1288... B4 V 16.5
we attempted to derive an independent value of the radius ratio from our high-resolution spectra. We performed these calculations by means of two procedures using different spectroscopic infor mation: (1) the luminosity ratio derived from the intensity of spec tral lines, and (2) the rotational broadening of the spectral lines.
In the first method we measured the equivalent widths of the most conspicuous helium lines for both components in the best-quality spectra of each binary (e.g., He i 4026, He i 4387, He i 4471). Then we computed the luminosity ratio as the quo tient of the line intensities. In the cases of binaries with compo nents of different spectral types, we corrected the measurements for the variation of the equivalent width of each particular line with the spectral type. The behavior of each spectral line along the temperature sequence was derived by measuring the lines of the reference spectra broadened to v sin i = 140 km s 1, which is a typical value for our objects. In this way we were able to obtain the luminosity ratio at the wavelength of the measured spectral lines, mainly located between 4000 and 5000 A. Fi nally, in order to obtain the bolometric luminosity ratio, we ap plied bolometric corrections using the Schmidt-Kaier (1982) calibration. The bolometric correction for B-type stars depends strongly on the spectral type, and even on the luminosity class. Considering that we need only the difference of the bolometric corrections for the two stellar components, we preferred to use the temperature ratio accurately derived from the light-curve analysis (see § 3). It must be noted that the relative temperature of the components, mainly related to the eclipse depths, does not correlate with the radius ratio that we are attempting to obtain. We used the tabulation corresponding to luminosity class V for all our binaries except star 1.4290.113, for which we adopted the class III calibration. This choice was based on the ultimately computed stellar parameters rather than on the pure spectral types. Finally, the radius ratio was computed from the luminosity ratio and the photometric temperature ratio. Evidently, some corrections ap plied during the calculation ofthe radius ratio depend on the stellar parameters obtained after the orbital analysis. However, this de pendence is not strong, and the calculations converged after a few iterations. Errors were calculated taking into account the error of the line measurements, the error of the photometric temperature ratio, and the uncertainty in the bolometric corrections.
We also computed relative radii from the rotational velocity of the components. We considered the systems to be rotating synchronously, which is a reasonable assumption considering their short orbital periods and the fact that their eccentricities are very low (in most cases indistinguishable from zero). With this assumption, the radius ratio can be calculated as the ratio of the parameter /sin/ of the two components. The rotational velocities were computed by comparing the width of the stellar lines with those of the low-rotation reference spectra previously convolved with different rotational profiles.
The typical uncertainty for the radius ratio derived from rota tional velocities was 0.20, while from line intensities the typical error of that parameter was 0.10. The differences between the two
948 GONZÁLEZ ET AL. Vol. 624 TABLE 2
Observed Radial Velocities
Object HJD - 2,400,000 Phase RVi (km s~') ei (km s_1) rv
2
(km s_1) e2 (km s_1) (O - Ch (km s_1) (O - C)2 (km s_1) 1.4290.113... 52621.6803 0.8014 421 11 111 16 0 -1 52621.7161 0.8171 414 12 128 17 —2 —4 52622.5953 0.2039 128 10 439 18 1 -1 52622.6829 0.2424 119 11 440 14 —2 4 1.4539.37... 52249.5225 0.2966 65 5 493 10 2 -3 52249.5300 0.2991 63 5 488 8 -1 —7 52249.5374 0.3016 69 6 490 8 4 —4 52250.8227 0.7307 468 5 -12 4 1 -3 52250.8302 0.7331 470 6 -15 13 3 -6 52250.8376 0.7356 468 4 -13 11 1 —4 6.5730.3092... 52249.5980 0.4010 134 10 396 11 2 3 52249.6136 0.4098 145 9 365 14 4 -21 52249.6332 0.4210 148 11 354 12 -6 -26 52251.7933 0.6476 417 11 51 11 4 -6 52251.8129 0.6587 423 10 52 13 2 5 52251.8285 0.6676 442 11 26 13 16 -14 52622.7200 0.2800 62 7 494 7 9 5 52622.6325 0.2303 50 6 497 8 0 5 52622.8377 0.3469 89 5 438 9 4 -12 78.6097.13... 52249.8363 0.7359 492 6 82 10 -5 —2 52249.8426 0.7379 499 7 90 9 2 6 52251.5330 0.2819 120 8 511 7 -1 7 52251.5393 0.2840 117 7 500 8 -5 —4 52251.5457 0.2860 126 7 505 9 5 1 78.6827.66... 52249.7301 0.7526 434 11 8 16 -1 -1 52249.7418 0.7579 438 10 4 19 4 -5 52249.7535 0.7633 438 10 7 17 4 -3 52251.7067 0.6579 401 12 55 18 —4 7 52251.7223 0.6650 405 11 54 17 —4 12 52621.8086 0.1683 90 5 462 7 1 0 52621.8236 0.1751 84 5 475 6 -1 8 79.5017.83... 52621.6599 0.2191 83 5 480 11 —2 —4 52621.7543 0.2629 87 5 480 11 4 —7 52622.7410 0.7212 421 3 10 7 2 -10 52622.7878 0.7430 423 4 12 11 1 —4 80.7436.52... 52250.8586 0.7750 533 6 56 10 9 6 52251.6575 0.2551 82 7 553 8 2 -6 52251.6809 0.2691 81 6 561 11 0 3 52621.7744 0.6630 487 4 73 6 —7 -11 80.7438.42... 52250.7602 0.2079 115 10 523 21 -1 8 52250.7836 0.2234 112 10 513 20 0 -6 52251.6039 0.7681 475 10 60 18 1 —4 52251.6313 0.7863 474 10 69 18 -1 4methods were smaller than their uncertainties except for the sys tem 78.6097.13, the more eccentric one, for which the second method gave a radius ratio considerably larger than the first one: 1.35 ± 0.25 and 0.80 ± 0.10, respectively. Considering that this system shows nonnegligible eccentricity, perhaps the assumption of pseudosynchronous rotation does not apply. We then preferred to adopt in this case the radius ratio computed from the spectral line intensities. For the remaining systems, we adopted the average of the values obtained by the two methods, weighted according to their errors. The results of these calculations will be discussed and used for the computation of stellar parameters in the next section.
3. ORBITAL ANALYSIS AND STELLAR PARAMETERS 3.1. Preparation of the Photometric Data
The binary stars analyzed here were selected among the large sample of eclipsing binaries discovered in the LMC as a by
product of the MACHO project (Alcock et al. 1997). Since we aim to derive an empirical mass-luminosity relation for the stars in the LMC, we draw our attention to objects showing light curves indicative of (1) detached systems (thus no strong inter actions are expected between components) (2) having short or bital periods (in order to be able to observe both quadrature phases in observing runs spanning a few nights) and (3) bright enough to achieve high S/N for RV determinations at the high resolution produced by UVES. Of the dozens of available targets, ultimately the fixed observing dates determined which stars could be adequately observed in both quadratures. Note that this de parture from the traditional approach of monitoring the full RV curve, motivated by the need to economize valuable telescope time, works surprisingly well, at least for nearly circular orbits, provided high-quality data are acquired.
It is important to stress that we do not aim for a complete sample in any sense, but to cover the largest possible range in
No. 2, 2005 EIGHT ECLIPSING BINARIES IN THE LMC 949 TABLE 3
Basic Parameters for the LMC Binary Systems
MACHO ID a (J2000.0) & (J2000.0) Fmax Epoch (HJD - 2,400,000) Period (days) 1.4290.113... 05 06 37.8 -69 14 23 16.30 49073.6510 2.273210 1.4539.37... 05 08 28.1 -68 48 26 14.15 49076.4402 2.995450 6.5730.3092... 05 15 41.5 -70 04 39 15.37 49073.7832 1.761014 78.5730.35... 78.6097.13... 05 18 04.7 -69 48 19 14.37 49072.1626 3.107023 78.6827.66... 05 22 35.0 -69 31 44 15.21 49073.4840 2.183358 79.5017.83... 05 11 02.8 -69 13 09 15.49 49075.3379 2.152915 80.7436.52... 05 26 04.4 -69 17 11 15.83 49074.3996 1.664135 80.7438.42... 05 26 21.6 -69 05 45 15.81 49072.8986 1.505947 Note.—Units of right ascension are hours, minutes, and seconds, and units of declination are degrees, arcminutes, and arcseconds.
masses. This philosophy is the same applied to construct the Galactic mass-luminosity relation (Andersen 1991), and it is different from the selection applied to the systems used for the distance-scale measurements (Guinan et al. 1998). However, the high-quality data and results available from the distance scale measurements can also be used to complement this work. The light curves analyzed here were based on the MACHO photometric data available at the MACHO Web site,4 in the two photometric bands Mb (Ac = 5311 A, Az = 1302 A) and Mr
(Ac = 6949 A, Az = 1389 A).
We tuned the orbital periods by a least-squares method using preliminary light curves to fit the observations. These improved ephemerides are given in Table 3, which lists the star identifica tion, coordinates, apparent magnitude, and ephemerides calcu lated in this paper. Star 6.5730.3092 is equivalent to 78.5730.35 because it lies in the overlap region of two MACHO fields. Here after we will refer to this star according to the first identification. During this preliminary analysis some light curves displayed residuals that showed a clear trend with the air mass and/or the
4 See http://www.macho.mcmaster.ca.
Fig. 2.—Illustrative examples of photometric correction to MACHO data. Left'. Residuals of the light curve of 1.4290.113 as a function of air mass. Right'.
light curve of 80.7436.52 without (upper curve) and with (lower curve) pier correction. A 0.3 mag shift was applied to the corrected light curve for clarity. position of the telescope with respect to the pier. In the observa tions taken from the west and east sides of the pier, a given star lands on different CCD detectors of the array, introducing sys tematic differences (Alcock et al. 1999). As an example, Figure 2 shows the dependence of the photometric data on air mass for star 1.4290.113 and the pier position for the star 80.7436.52.
In order to use in our light-curve analysis the highest quality available photometric data, we discarded the observations ob tained at air masses higher than 2. Furthermore, a zero-point cor rection was applied to the observations with opposite pier position. Finally, points lying beyond 4 times the rms of the residuals, which were typically 0.015-0.020 mag, were not considered.
Four of our eight binary stars (1.4539.37, 78.6097.13, 78.6827.66, and 79.5017.83) are also contained in the catalog of variable stars detected by the OGLE program (Zebrun et al. 2001b). We included in our analysis the OGLE photometric curves in the I band.
3.2. Light and Radial Velocity Curve Analysis
The Mb and Mr light curves available from the MACHO database and /-band light curves from OGLE were analyzed
950 GONZÁLEZ ET AL. together with our RV measurements using the Wilson & Devinney
code (Wilson & Devinney 1971; Wilson 1990). The photomet ric data were given unit weight. So, the relative weight of the different light curves is defined by the parameter cr of the Wilson & Devinney DC program, which was set equal to the actual rms of the residuals of the fit.
We used for the bolometric albedos and gravity-darkening coefficients the values corresponding to radiative envelopes, i.e., A = 1.0 (Rucinski 1969) and g = 1.0 (Lucy 1976). The limb darkening was modeled through a square root law (Diaz- Cordovés & Giménez 1992), with the coefficients and tables given by van Hamme (1993 ). The components of the studied binary systems were assumed to be in synchronous rotation. All the above-mentioned parameters (albedos, gravity-darkening co efficients, limb-darkening coefficients, and rotation) were kept fixed.
We adopted the temperature calibration of Schmidt-Kaier (1982), which seems to be in good agreement with determina tions for similar stars in our Galaxy (for example, Harries et al. 1997, 1998; Hilditch et al. 1996; Martins et al. 2002).
However, the temperature scale for early-type stars is a subject where no general consensus has yet been achieved. Recent works, for example Martins et al. (2002) and Bianchi & Garcia (2002), give quite different temperatures for a certain spectral type. If a dif ferent scale were adopted, some of the fundamental parameters derived here would change.
The effective temperatures for the primary components of each binary system were taken according to the corresponding spectral types, and we left the temperature of the secondary as a parameter to be derived in the analysis.
In a first attempt we used the DC program of Wilson & Devinney to fit the following parameters: the semimajor axis a,
the systemic radial velocity Vy, the orbital inclination i, the sur face temperature of the secondary star T2, the gravitational po tentials Q | and (.l2, the mass ratio q. and the luminosity of the primary component Lj. These parameters were grouped in two different sets in order to perform the fit. We first adjusted the parameters in the first group: a, q, and VT After that, those parameters were set as fixed and the fit was improved by allowing the parameters in the second group to vary: i, T2,Q\,Q2, and /_ |. We then recomputed the parameters in the first group, leaving those in the second set as constant, and repeated those steps itera tively until convergence was obtained. Since all our systems are detached, operation mode 2 was selected for the DC program.
This strategy gave good results only for star 6.5730.3092, which presents total eclipses. All the remaining stars display partial eclipses. In such cases, the ratio of the stellar radii could not be derived with accuracy from the light-curve analysis. As an example, Figure 3 shows the sum of the residuals versus the radius ratio for star 6.5730.3092, the only one with total eclipses, and 1.4290.113, which is representative of the seven remaining cases. For star 6.5730.3092 we computed the stellar radii from the light curves as described above. However, for the remaining systems we adopted the spectroscopic radius ratio and we computed with the DC program the sum of the radii, which is a parameter well defined by the light curves. Since the Wilson & Devinney program computes independent correc tions for both gravitational potentials, we proceeded as follows. During the Wilson & Devinney run, we held fixed the gravi tational potential of one component and computed the differ ential correction for the other. For the modified gravitational potential, we computed the corresponding sum of the radii. Then from the latter and the spectroscopic radius ratio we calculated the individual stellar radii, which, translated to gravitational
0.30 C/2 0.10 0.50 0.20 1.00 1.50
r2/rl
2.00Fig. 3.—Light-curve residuals vs. the radius ratio for stars 6.5730.3092 (thick line) and 1.4290.113 (thin line).
potentials, were used for the next run of the Wilson & Devinney program. In this manner, we were able to perform the calculation of the stellar parameters restricting the value of the gravita tional potentials so that the radius ratio always equals the spec troscopic value.
The final fits for spectral types, temperatures, inclinations, semimajor axes, mass ratio, center-of-mass velocity, radius ratio, and sum of radii are listed in Table 4, along with their respective errors. The last rows show the computed absolute parameters, i.e., absolute masses, radii, and luminosities. The computation of the quoted errors is detailed in the next section.
Figures 4-11 represent the observed and computed light and RV curves for each system. In the particular case of star 79.5017.83, and to a smaller extent in star 80.7438.42, the depth of the minima are slightly different in the various photometric bands. For these a better fit is obtained if a small third light is included. Nevertheless, in the absence of any other evidence of the presence of a third light, we preferred to adopt the param eters corresponding to a global fit with the consequent larger errors.
As described by Zebrun et al. (2001a) for OGLE observa tions, the contamination with nearby stars makes it difficult to determine the flux zero point for the DIA (difference image anal ysis) photometry of variable stars in crowded fields. This may affect the amplitude of the light curve and hence constitutes an alternative explanation of the poor fit to the eclipse depth in the case of star 79.5017.83.
The systems 1.4539.37 and 78.6097.13 have orbits with small but nonnegligible eccentricity. The eccentricities result ing from the light and RV curve analysis are e = 0.0253 ± 0.0057 for 1.4539.37 and e = 0.0431 ± 0.0062 for 78.6097.13. The system 1.4539.37 also showed apsidal motion. In fact, the eccentric character of its orbit was noticeable thanks to the large time span of the MACHO and OGLE data, which cover about 8 years. A linear fit to the argument of periastron, performed with the Wilson & Devinney program, yields a rate of apsidal motion of about 6.2 x 10 4 day f corresponding to an apsidal period of 27.7 yr. This interesting system warrants further study.
3.3. Errors
As mentioned above, the temperature of the primary star was not adjusted, but it was derived from the spectral type. The error of this parameter is estimated to be about 10%. This corresponds to 0.5-1.0 spectral subtypes for early-B stars, about 1.2 spectral subtypes for late-0 stars, and 1.6 subtypes for star 1.4290.113, a middle B-type star. The adoption of a different temperature scale
TABLE 4
Orbital and Stellar Parameters Value
Star
Parameter 1.4290.113 1.4539.37a 6.5730.3092 78.6097.13b 78.6827.66 79.5017.83 80.7436.52 80.7438.42 Spectroscopic parameters:
Spectral type 1.... B6 V 08.5 V Bl V 09 V B0.5 HI-IV B2 V Bl V B2 V
Spectral type 2.... B5 V 09 V B2 V 09 V Bl: B2 V B2 V B2 V
L (K)... 14331 34400 25400 33000 27000 22000 25400 22000
'2 A... 0.95 ± 0.12 0.84 ± 0.10 0.63 ± 0.01° 0.80 ± 0.20 0.75 ± 0.08 0.73 ± 0.09 0.90 ± 0.10 0.80 ± 0.09 Light and RV curves:
a... 14.91 ± 0.47 28.26 ± 0.40 15.66 ± 0.24 25.17 ± 0.32 18.66 ± 0.31 17.59 ± 0.24 15.90 ± 0.29 12.67 ± 0.34 r, (km s_1)... 274.2 ± 4.5 255.6 ± 3.1 250.9 ± 2.6 301.7 ± 2.4 250.8 ± 3.0 252.0 ± 2.0 303.2 ± 3.8 292.7 ± 4.4 ' (deg)... 77.1 ± 0.5 78.0 ± 0.8 84.5 ± 1.3 77.9 ± 0.8 81.3 ± 0.8 80.1 ± 1.4 84.3 ± 0.6 77.0 ± 1.7 Ld(K)... 15400 ± 220 31740 ± 1200 24010 ± 410 31380 ± 960 24100 ± 680 18920 ± 690 23740 ± 370 19840 ± 140 '/... 0.920 ± 0.057 0.800 ± 0.022 0.844 ± 0.025 0.893 ± 0.022 0.762 ± 0.025 0.718 ± 0.018 0.870 ± 0.030 0.797 ± 0.040 ''1 + '2... 0.617 ± 0.008 0.426 ± 0.018 0.599 ± 0.008 0.458 ± 0.009 0.498 ± 0.010 0.485 ± 0.017 0.487 ± 0.007 0.564 ± 0.023 Absolute stellar parameters:
M, «,)... 4.50 ± 0.48 18.82 ± 0.90 9.04 ± 0.44 11.76 ± 0.48 10.42 ± 1.07 9.20 ± 0.45 10.45 ± 0.64 6.71 ± 0.63 M2 ... 4.14 ±0.36 15.06 ± 0.64 7.64 ± 0.35 10.51 ± 0.40 7.94 ± 0.68 6.61 ± 0.23 9.09 ± 0.47 5.35 ± 0.38 A («A... 4.72 ± 0.34 6.74 ± 0.47 5.75 ± 0.12 6.49 ± 0.43 5.31 ± 0.28 4.94 ± 0.32 4.07 ± 0.23 3.97 ± 0.28 A (A>)... 4.48 ± 0.34 5.66 ± 0.44 3.64 ± 0.08 5.19 ± 0.42 3.98 ± 0.27 3.60 ± 0.29 3.67 ± 0.23 3.18 ± 0.26 logVi)... 2.92 ± 0.19 4.73 ± 0.18 4.08 ± 0.18 4.64 ± 0.18 4.12 ± 0.18 3.70 ± 0.18 3.78 ± 0.18 3.51 ± 0.18 !<>g< / 2 >... 3.00 ±0.19 4.46 ± 0.19 3.59 ± 0.18 4.36 ± 0.19 3.67 ± 0.18 3.17 ± 0.19 3.58 ± 0.18 3.14 ± 0.19 a Eccentric orbit: e = 0.0253 ± 0.0057, w(rad) = (4.27 ± 6.2) x 10 4 (JD - 2,449,076.44).
b Eccentric orbit: e — 0.0431 ± 0.0062, tc(rad) — 5.96 ± 0.30. c Derived from light-curve analysis.
d The error assigned to is computed for a fixed value of T\.
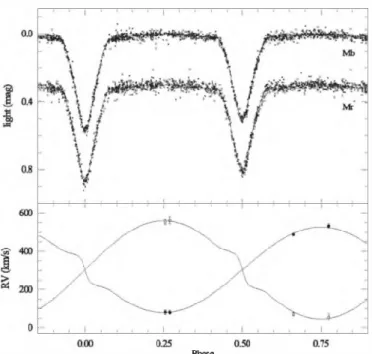
Fig. 4.—Fits of the light and RV curves for the binary system MACHO 1.4290.113. Mr light curve has been shifted by 0.3 mag for clarity.
Fig. 5.—Fits of the light and RV curves for the binary system MACHO 1.4539.37. Observations are split into two samples: plus signs show MACHO ob servations taken between JD 2,448,800 and 2,449,800, and squares show MACHO and OGLE observations between JD 2,450,600 and 2,451,600. Solid thin lines correspond to the adopted solution for JD 2,449,300, while thick lines are for JD 2,451,100 in the case of light curves and JD 2,452,500 in the case of RV curves.
952 GONZÀLEZ ET AL. Voi. 624
Phase
Fig. 6.—Fits of the light and RV curves l'or the binary system MACHO 6.5730.3092.
would certainly modify our results. Although this issue is beyond the scope of the present paper, we acknowledge the temperature - spectral type calibration as a major source of uncertainty in our derived luminosities. On the other hand, the influence of the tem perature on the computed masses and radii is certainly negligible. We consider that in our case, standard errors as provided by the DC program of the Wilson & Devinney method are not good estimates of the real uncertainty of the adjusted parameters. In the case of the spectroscopic parameters (R7, q, and a), the
Fig. 8.—Fits of the light and RV curves for the binary system MACHO 78.6827.66.
reason is that they are based on very few measurements, typi cally two spectra at each quadrature. Consequently, the resid uals of the RV curve, on which the calculation of standard error is based, are expected to be significantly smaller than the mea surement errors. For that reason we preferred to derive the error
Fig. 7.—Fits of the light and RV curves for the binary system MACHO 78.6097.13.
Fig. 9.—Fits of the light and RV curves for the binary system MACHO 79.5017.83.
No. 2, 2005 EIGHT ECLIPSING BINARIES IN THE LMC 953
Phase
Fig. 10.—Fits of the light and RV curves for the binary system MACHO 80.7436.52.
phase box
Fig. 12.—Root mean square of the smoothed residual of the light curves vs. the size of the phase box corresponding to the number m of points used in the smoothing. The straight line corresponds to m~0 5, the expected law for a purely random residual distribution. The data correspond to star 6.5730.3092 in the bands (filled circles) ax\&Mr (open circles).
of those parameters using the measurement errors of the indi vidual RVs instead of the residuals of the fit.
On the other hand, the number of the individual photometric measurements is large, typically between 1500 and 2500. In this case, standard errors are good estimates of the parameter un certainties only if the dispersion of the residuals reflects the purely random distribution of the photometric errors. When the residuals of the light-curve fit do not follow a purely random distribution, the standard errors are not a good measure of the true uncertainties for the adjusted parameters.
In order to assign realistic errors for the photometric pa rameters, we analyzed the distribution of the light-curve resid uals. We computed smoothed residual curves by replacing each point by the average of m points yielded in a given phase
in-Fig. 11.—Fits of the light and RV curves for the binary system MACHO 80.7438.42.
terval around the original point. We carried out the same proce dure for different /«-values and computed the rms of the smoothed residual curves. If the residuals are distributed at random, then the rms of these curves will be proportional to m~°5.
As an example, Figure 12 shows the behavior of the rms of the residual curves as a function of the number m of individual points included in each average. In several cases, the existence of nonrandom modulations of the residuals with the orbital phase of the order of 0.001-0.005 mag could be seen. These values are significantly larger than expected and might be related to small differences between the model and the real binary (presence of star spots, inappropriate limb or gravitational darkening, small or bital eccentricity, departures from the Roche geometry, con tamination from a third light, etc.). From this analysis we derived for each light curve an estimate of the amplitude of the system atic modulations present in the residuals.
In summary, the errors for the photometric parameters (T2, ri + r2, i) were assigned in such a way that include all solutions whose light curves differ from the adopted solution by less than the amplitude of the nonrandom modulations of the residuals.
These final errors are 5-10 times larger than errors computed by the Wilson & Devinney code, but we trust that they provide a more realistic estimate of the uncertainties in the parameters. Finally, for the calculation of luminosities, the uncertainty in 7-| was added to the error in T2 listed in Table 4.
4. RESULTS AND THEIR DISCUSSION: THE LMC MASS-LUMINOSITY RELATION
Figure 13 compares the observed stellar parameters with the oretical models of Bertelli et al. (1994) for chemical composi tion Z = 0.008, Y = 0.25. The mass-radius diagram shows all our binaries as composed by normal main-sequence stars, both components of each system lying approximately on the same isochrone. This lends support to our spectroscopic determina tion of the radius ratio and allows us to estimate the age of the systems.
Stars 1.4539.37 and 80.7436.52 appear to be very young (5 x 10⁶ yr). The oldest star is 1.4290.113, with about 1.25 x 10⁸ yr. The two components of this system are very similar, and their
954 G0NZÀLEZ ET AL. Vol. 624
logM
Fig. 13.—Comparison of observed stellar parameters with evolutionary models in the mass-radius diagram. Symbols with error bars show our results. Pointed lines connect the components of each binary. Thick lines represent the ZAMS and the TAMS; thin lines are isochrones labeled with log(age).
logM
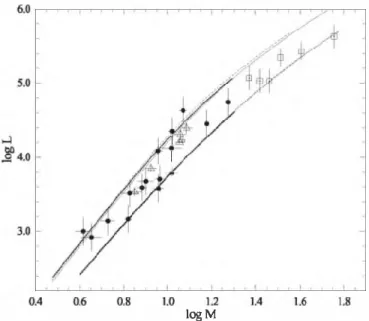
Fig. 14.—Mass-luminosity relation for the LMC. Filled circles show our data. Triangles and squares show other LMC detached binaries from previous works (see text). Lines are theoretical ZAMS and TAMS: dashed line, Bertelli et al. (1994);
thick solid line, Salasnich et al. (2000); thin solid line, Schaerer et al. (1993). sizes are about 0.8 times the radius corresponding to the end of
the main-sequence stage for their masses; the age is almost 90% of their main-sequence lifetime. All the remaining stars are in the range (1.6—4.0) x 107 yr.
The results of the previous sections allow us for the first time to determine an empirical mass-luminosity relation for the LMC valid for masses between 4 and 20 A linear regression fit to our data gives logZ, = 3.09 log A/ + 6.89.
At this point it must be noted that since stellar luminosities were computed from temperahues derived using a spectral type temperature calibration based on Galactic stars, the validity of the obtained mass-luminosity relation is conditioned by the ap plicability of that temperature scale to the LMC stars. Inversely, the absence of any appreciable systematic difference with respect to stellar models for the LMC chemical composition (Fig. 14) might be considered as an indication that the possible system atic errors in the temperature calibration would be well below our observational errors. In other words, in a more strict sense, what can be asserted is that the mentioned agreement of the mass-luminosity relations and the applicability of the Galactic temperatoe scale are mutually consistent.
Although it is beyond the scope of the present paper, we mention that a more reliable study of the incidence of the chem ical composition on the temperatoe scale could be established through the line measurement of synthetic spectra computed for different chemical compositions.
Figure 14 shows our data supplemented with previous works on detached eclipsing binaries in the LMC. In this figure, open triangles show data from the distance-scale projects of Ribas et al. (2000, 2002), Fitzpatrick et al. (2002), and Guinan et al. (1998), while open squares show high-mass binary stars stud ied by Massey et al. (2002 ) in 30 Dor. Binary systems with mass transfer between the components were not included. A very good agreement between the different data sets was found.
Comparison with the mass-luminosity relation established for the Milky Way is shown in Figure 15. We have adopted essentially the mass-luminosity relation from Andersen (1991), supplemented by some early-type binaries from Popper (1980) not included in Andersen (1991) and the more recent works by Holmgren et al.
(1990, 1991), Andersen et al. (1993), Giménez & Clausen (1994), Hill & Holmgren (1995), Clausen (1996), Alencar et al. (1997), Vaz et al. (1997), and Hensberge et al. (2000).
The Milky Way luminosity function is based on disk stars, with mean metallicity likely to be solar (Geisler et al. 1992; Friel & Janes 1993; Friel et al. 2002). Instead, the field LMC stars have a mean metallicity of Z = 0.008 ( Westerlund 1990; Schaerer et al. 1993 ). However, there does not appear to be any difference between the mass-luminosity relations of the two galaxies for the range of masses considered here. This is the first empirical mass-luminosity relation for the LMC, and it is re assuring that massive stars in a different galaxy behave as they do in the Milky Way.
6.0 2.0 1.0 4.0 J 3.0 5.0 ■EC' C'WC 0.4 0.8 1.2 logM 1.6
Fig. 15.—Comparison with the Milky Way mass-luminosity relation. Filled circles show the LMC stars of Fig. 14. Open circles show components of Ga lactic binaries, mainly from Andersen (1991) and Popper (1980). Lines are the ZAMS and TAMS for Padova stellar models with the LMC chemical compo sition (solid lines) and solar composition (dashed lines).
No. 2, 2005 EIGHT ECLIPSING BINARIES IN THE LMC 955 Comparisons with the theoretical mass-luminosity relation
from evolutionary models are also shown in Figures 14 and 15. More-than-reasonable agreement between the theoretical pre dictions and the observations is found. Figure 14 compares the empirical data with the Padova models for Z = 0.008, Y = 0.25
(dashed line, Bertelli etal. 1994; thicksolid line, Salasnich etal. 2000) and with Geneva models forZ = 0.008, Y = 0.264 (thin solid line, Schaerer et al. 1993; Lejeune & Schaerer 2001). The Padova and Geneva models for the LMC composition differ by only A log Z. « 0.02-0.03. Likewise, in the mass range of our stars, the theoretical sequences for solar and LMC chemical composition are very similar, showing a more appreciable dif ference only for less massive stars (see Fig. 15).
It would be valuable to increase the mass range, as well as the number of systems, in order to explore the mass-luminosity re lation with more detail. Particularly, at lower masses (e.g., 2 M&) it would be possible to verify the departure from the Galactic mass luminosity relation predicted by the theoretical models.
Even if our data showed a global agreement with stellar models, the point spread in the M-L diagram (Fig. 14) is more notice able than in the case of the M-R diagram (Fig. 13). In particular, a few stars lie near or even above the terminal-age main sequence (TAMS), in contrast with the M-R diagram. We consider that the luminosity dispersion is mainly related to a poor temperature esti mate and is not attributable to model deficiencies or chemical dif ferences, considering the similitude of the various theoretical curves in Figures 14 and 15.
In order to compare the spread of points in the M-L diagram with our temperature uncertainties, we interpolate in the Padova model grid the temperature corresponding to the observed mass and radius of each star. Then we compute the difference with respect to the observed temperature.
The rms of these differences is about 11%, or 1.0 spectral subtypes. The greater residuals are those of both stars of the system 78.6097.13, for which the interpolated temperatures corre spond approximately to spectral type B1 V, while they were clas sified as 09 V. Omitting this binary, the rms of the 14 remaining stars becomes 8.4%, or 0.7 spectral subtypes. These values are en tirely compatible with our temperature errors.
The case of78.6097.13, with both components lying A log L =
0.4 above the expected luminosity, is not yet clear for us. The apparent magnitude of this binary supports the high luminosity here derived, as can be seen, for example, by comparison with the system 1.4537.37. Since 78.6097.13 is the more eccentric system in the present sample, apsidal motion cannot be ruled out. If the longitude ofthe periastron as computed from the light curves were not appropriate for the dates of the RV measurements (because of apsidal motion, for example), this would affect the mass deriva tions. With the presently available data we are not able to perform a more detailed analysis of this system.
Finally, we comment on the possibility of using these bina ries for the determination of the distance to the LMC. In fact, a large number of stars with known luminosity would allow us, in principle, to obtain the LMC distance with good precision. The absolute dimensions of the 16 stars derived here are suitable to be used for this purpose. However, it is necessary to also have good-quality data about apparent magnitudes and reddening, which are lacking for our binaries.
We estimate the contribution of the radius error to the dis tance modulus uncertainty to be about 0.05-0.10 mag. On the other hand, the error of the temperatures derived here from spectral types (about 10%) introduces an error of about 0.45-
0.50 mag in bolometric magnitudes. The incidence on the dis tance modulus depends on the photometric band, but might be not more than 0.2 mag in the red. However, it must be taken into account that a systematic error might be present as a consequence of the uncertainty in the adopted spectral type temperature calibration. Although it was small, this systematic error would not be reduced by averaging the distance moduli of several binaries.
The interstellar reddening, as well as an independent temper ature estimate, could be derived from UV spectrophotometric ob servations (see, for example, Guinan et al. 1998; Fitzpatrick et al. 2002; Ribas et al. 2002). In addition, absolute multicolor pho tometry of these binaries at maximum phase is necessary for a confident distance determination.
5. CONCLUSIONS
We determined accurate absolute parameters (masses, radii, spectral types, and luminosities) for eight early-type detached eclipsing binaries in the LMC. This work more than doubles the number of such systems analyzed in the LMC.
With these high-quality data we build the first empirical mass-luminosity relation for a galaxy other than the Milky Way. This is particularly interesting because the LMC has a lower mean metallicity than the Milky Way.
The LMC mass-luminosity relation derived from our data is valid for early-type stars ranging from 4 to 20 M&. This first LMC mass-luminosity relation provides key tests for the mass luminosity relation of our Galaxy and for models of stellar evolution.
Even though we expect that this first mass-luminosity relation will be improved with the addition of new systems yet to be ana lyzed, we can already assert that the latest stellar models are in good agreement with the observations, at least for unevolved stars with masses below 20 M&. This result is similar to that obtained by Burkholder et al. (1997) for a sample of Galactic binaries.
This work also constitutes a proof of concept for the procedure, which does not measure full RV curves but takes advantage of the available accurate light curves that allow the planning of ob servations in both quadratures, thus economizing valuable tele scope time. In the near future, new instruments such as FLAMES at the ESO Very Large Telescope (Pasquini et al. 2000) will allow us to populate this mass-luminosity relation with more than a hun dred systems and extend it to fainter candidates, perhaps reaching 2 M&. This will help us to perform a more detailed comparison of the LMC mass-luminosity relation with that of our Galaxy and the theoretical models.
D. M. is supported by Fondap Center for Astrophysics grant 15010003.
This paper utilizes public domain data obtained by the MACHO project, jointly funded by the US Department of En ergy through the University of California, Lawrence Livermore National Laboratory, under contract W-7405-Eng-48, by the National Science Foundation through the Center for Particle Astrophysics of the University of California under cooperative agreement AST 88-09616, and by the Mount Stromlo and Siding Spring Observatory, part of the Australian National University.
We would also like acknowledge the OGLE collaboration for making their data available, and we thank the referee for the useful suggestions that lead to the improvement of the final version of our paper.
956 GONZÁLEZ ET AL. REFERENCES Alcock, C., et al. 1997, AJ, 114, 326
---. 1999, PASP, 111, 1539
Alencar, S. H. P., Vaz, L. P. R., & Helt, B. E. 1997, A&A, 326, 709 Andersen, J. 1991, A&A Rev., 3, 91
Andersen, J., Clausen, J. V., & Giménez, A. 1993, A&A, 277, 439
Bertelli, G., Bressan, A., Chiosi, C., Fagotto, F., & Nasi, E. 1994, A&AS, 106, 275
Bianchi, L., & García, M. 2002, ApJ, 581, 610
Burkholder, V., Massey, P., & Morrell, N. 1997, ApJ, 490, 328 Clausen, J. V. 1996, A&A, 308, 151
Diaz-Cordovés, J., & Giménez, A. 1992, A&A, 259, 227
D’Odorico, S., & Kaper, L. 2000, UVES User Manual, ESO VLT-MAN-ESO- 13200-1825
Fitzpatrick, E. L., Ribas, I., Guinan, E. E, DeWarf, L. E., Maloney, F. P., & Massa, D. 2002, ApJ, 564, 260
Friel, E. D., & Janes, K. A. 1993, A&A, 267, 75
Friel, E. D., Janes, K. A., Tavarez, M., Scott, J., Katsanis, R., Lotz, J., Hong, L., & Miller, N. 2002, AJ, 124, 2693
Geisler, D., Clariá, J. J., & Minniti, D. 1992, AJ, 104, 1892 Giménez, A., & Clausen, J. V. 1994, A&A, 291, 795 González, J. F., & Lapasset, E. 2003, A&A, 404, 365
Gray, R. O. 2000, A Digital Spectral Classification Atlas (Pasadena: IPAC), http://nedwww.ipac.caltech.edu/level5/catalogs.html
Orison, P., et al. 1995, A&AS, 109, 447 Guinan, E. F., et al. 1998, ApJ, 509, L21
Harries, T. J., Hilditch, R. W., & Hill, G. 1997, MNRAS, 285, 277 ---. 1998, MNRAS, 295, 386
Hensberge, H., Pavlovski, K., & Verschueren, W. 2000, A&A, 358, 553 Hilditch, R. W, Harries, T. J., & Bell, S. A. 1996, A&A, 314, 165
Hill, G., & Holmgren, D. E. 1995, A&A, 297, 127
Holmgren, D. E., Hill, G., & Fisher, W. 1990, A&A, 236, 409 ---. 1991, A&A, 248, 129
Lejeune, T, & Schaerer, D. 2001, A&A, 366, 538 Lucy, L. B. 1976, ApJ, 205, 208
Martins, E, Schaerer, D., & Hillier, D. J. 2002, A&A, 382, 999 Massey, P., Penny, L. R., & Vukovich, J. 2002, ApJ, 565, 982 Pasquini, L., et al. 2000, Proc. SPIE, 4008, 129
Popper, D. M. 1980, ARA&A, 18, 115
Ribas, I., Fitzpatrick, E. L., Maloney, F. R, Guinan, E. E, & Udalski, A. 2002. ApJ, 574, 771
Ribas, L, et al. 2000, ApJ, 528, 692 Rucinski, S. M. 1969, Acta Astron., 19, 245
Salasnich, B., Girardi, L., Weiss, A., & Chiosi, C. 2000, A&A, 361, 1023 Schaerer, D., Meynet, G., Maeder, A., & Scalier, G. 1993, A&AS, 98, 523 Schmidt-Kaier, Th. 1982, in Landolt-Bömstein, New Series, Group VI, Vol. 2b,
ed. K. Schaifers & H. H. Voigt (Berlin: Springer)
Udalski, A., Soszynski, I., Szymanski, M., Kubiak, M., Pietrzynski, G., Wozniak, P., & Zebrun, K. 1998, Acta Astron., 48, 563
van Hamme, W. 1993, AJ, 106, 2096
Vaz, L. P. R., Cunha, N. C. S., Vieira, E. E, & Myrrha, M. L. M. 1997, A&A, 327, 1094
Walbom, N. R., & Fitzpatrick, E. L. 1990, PASP, 102, 379 Westerlund, B. E. 1990, A&A Rev., 2, 29
Wilson, R. E. 1990, ApJ, 356, 613
Wilson, R. E., & Devinney, E. J. 1971, ApJ, 166, 605
Zebrun, K., Soszynski, I., & Wozniak, P. R. 2001a, Acta Astron., 51, 303 Zebrun, K., et al. 2001b, Acta Astron., 51, 317