http://dx.doi.org/10.4236/ars.2016.51002
How to cite this paper: Privette III, C.V., Khalilian, A., Bridges, W., Katzberg, S., Torres, O., Han, Y.J., Maja, J.M. and Qiao, X. (2016) Relationship of Soil Moisture and Reflected GPS Signal Strength. Advances in Remote Sensing, 5, 18-27.
http://dx.doi.org/10.4236/ars.2016.51002
Relationship of Soil Moisture and Reflected
GPS Signal Strength
Charles V. Privette III
1, Ahmad Khalilian
2*, William Bridges
3, Stephen Katzberg
4,
Omar Torres
5, Young J. Han
1, Joe Mari Maja
2, Xin Qiao
21Department of Agricultural and Environmental Sciences, Clemson University, Clemson, SC, USA 2Edisto REC, Clemson University, Blackville, SC, USA
3Mathematical Sciences Department, Clemson University, Clemson, SC, USA 4South Carolina State University, Orangeburg, SC, USA
5NASA Langley Research Center, NASA, Hampton, VA, USA
Received 15 December 2015; accepted 1 March 2016; published 4 March 2016
Copyright © 2016 by authors and Scientific Research Publishing Inc.
This work is licensed under the Creative Commons Attribution International License (CC BY).
http://creativecommons.org/licenses/by/4.0/
Abstract
Many agricultural fields across the country have a high degree of variability in soil type and water holding capacity that affects irrigation management. One way to overcome problems associated with the field variability for improving irrigation management is to utilize a site-specific irrigation system. This system applies water to match the needs of individual management zones within a field. A real-time continuous soil moisture measurement is essential for the success of site-specific irrigation systems. Recently the National Aeronautics and Space Administration (NASA) developed sensor technology that records the global positioning system (GPS) signal reflected from the sur-face of Earth, which estimates the dielectric properties of soil and can be used to estimate soil moisture contents. The overall objective of this study was to determine the feasibility of utilizing GPS-based technology developed by NASA for soil moisture measurements and to determine the influence of soil type, soil compaction, and ground cover on the measurements. The results showed strong positive correlations between soil moisture and reflected signals. Other factors (soil compaction and soil type), were not significantly related to reflectivity and did not signifi-cantly change the relationship between reflectivity and soil moisture contents. In addition, ground cover (rye crop) did not significantly reduce reflectivity. Therefore, this system could be used as a real-time and continuous nonintrusive soil moisture sensor for site-specific irrigation scheduling and watershed management.
Keywords
Remote Sensing, Soil Moisture, GPS, Reflectivity, Site-Specific Irrigation
C. V. Privette III et al.
1. Introduction
Site-specific or variable-rate irrigation (VRI) technology is a relatively new concept in agriculture that applies irrigation water to match the needs of individual management zones within a field, significantly reducing water consumption, runoff, and nutrient leaching to ground water. Real-time and continuous soil moisture measure-ments are essential for success of site-specific irrigation systems.
Several different types of sensors, such as tensiometers [1], TDR [2], and multi-sensor capacitance probes [3]-
[5], are currently commercially available for measuring soil water content. However, since these sensors meas-ure soil moistmeas-ure in discrete locations in a production field, a significant number of sensors would be needed to provide a reasonable characterization of the spatial variability normally encountered in irrigated fields in the Southeast USA. Therefore, using currently available soil moisture sensors for implementing site-specific irriga-tion management through variable rate irrigairriga-tion technology could be very expensive and impractical. There is a need to develop advanced sensing technologies that can be installed on top of overhead irrigation systems to continuously map soil moisture as the system moves over the field.
Many researchers [6]-[11] have shown that variation in near surface soil moisture can be successfully esti-mated using remote sensing in the microwave region. The frequency range of 1 - 2 GHz (30 - 15 cm wave-length), is sensitive to variations in the dielectric properties of soil and has better penetration through vegetation at these relatively large wavelengths [12]. The dielectric constant of soil is closely correlated with near-surface soil moisture contents [10]. The global positioning system (GPS) constellation broadcasts a civilian-use carrier signal (L-band) at 1.575 GHz, which has been used for remote soil moisture sensing [13].
In 2002, the National Aeronautics and Space Administration (NASA) developed a GPS-based sensor tech-nology that operates by recording the GPS signal reflected from the surface of Earth [13][14]. Such a system (modified GPS Delay Mapping Receiver—DMR) was used on unmanned aircrafts to accommodate soil mois-ture remote sensing [15], and were tested by NASA researchers at several different locations [13][14]. Since re-flected GPS signals can interfere with direct signals while the GPS satellite ascends or descends at relatively low elevation angles [16], the DMR is programmed to utilize the highest elevation satellite in view, so that the aver-age elevation angle is generally above sixty-five degrees [13].
Strong correlations between GPS reflectivity measurements and soil moisture contents in the top 25 cm of the soil profile (partitioned into 5 cm layers) were reported under bare soil conditions [17]. Preliminary results [18]
showed that many other factors such as soil type, soil compaction, and ground cover could affect the GPS ref-lectivity. Therefore, further testing and refining of the GPS sensor technology, to account for these factors, was needed. The overall objective of this paper was to determine the effects of soil type, soil compaction, and ground cover on soil moisture reflectance values.
2. Methodology
Replicated tests were conducted in a field with three different soil types: Faceville loamy sand, Fuquay sandy loam, and Lakeland sand. Table 1 shows soil characteristics of the test areas. The 2.5-ha field was located near Blackville, South Carolina (Latitude 33˚20"N, Longitude 81˚19"W).
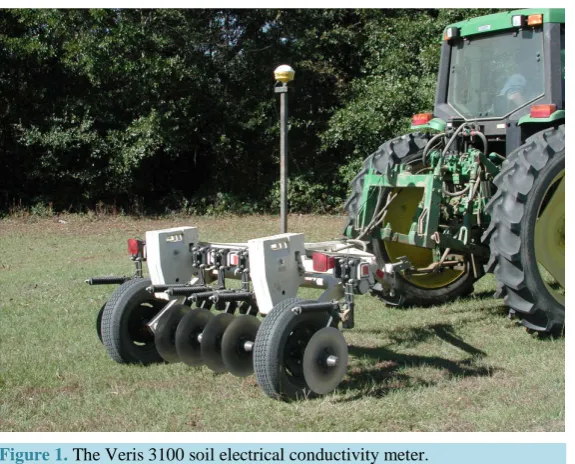
[image:2.595.116.513.647.721.2]Prior to initiation of tests, soil electrical conductivity (EC) measurements were obtained using a commercially available (EC) meter (Veris-3100; Veris Technologies Inc., Salina, KS) to determine variations in soil physical properties across the field. The Veris-3100 resembles a small disk harrow about 2-m wide (Figure 1) and meas-ures soil EC continuously across a field in either the top 0.3 or 0.9 m of soil profile [19]. The implement was operated at 5.5 km/h, which resulted in 10 pairs of measurements (shallow and deep) in a 15.2 m long test plot at a sampling rate of 1 Hz. A geo-referenced EC map was developed using SSToolbox GIS software. The Lake-land soil had lighter texture and lower soil EC while the Faceville soil had higher clay content and higher soil
Table 1. Soil classification and texture of the test areas.
Soil type Family Sand (%) Clay (%)
Faceville Clayey-kaolinitic-thermic, Typic Paleudults 78.3 12.5
Fuquay Loamy-siliceous-thermic, Arenic Plinthic Paleudults 85.5 8.9
Figure 1. The Veris 3100 soil electrical conductivity meter.
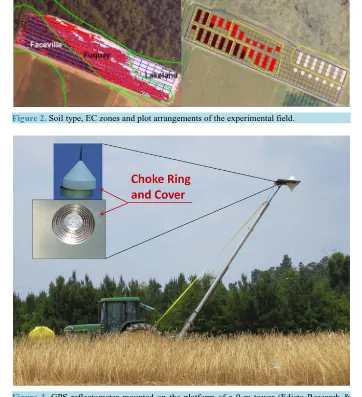
EC. The average EC values for Lakeland, Fuquay, and Faceville soils were 4, 9.2, and 12.9 mS/m, respectively. The test field was divided into three management zones based on soil texture and soil EC values and 21 rec-tangular plots (15.2 m × 7.6 m) were established in each zone (Figure 2). Each zone then was divided into three blocks and the following seven treatments were randomly applied to plots of each block within each zone:
Treatments 1 - 3: Cover crop (“Wrens Abruzzi” rye) at three different densities (CROP); Treatment 4: Non-compacted bare soil (NC); and
Treatments 5 - 7: Bare soil with three levels of soil compaction (COM).
A randomized complete block design with three replications was the statistical model selected for evaluating treatments.
Three levels of soil moisture content were established in each zone to evaluate treatment effects. The field was irrigated by applying 2.5 cm of water to all plots using a traveling gun. The three levels of soil moisture contents were achieved by collecting the reflected GPS signals from the test plots 2.7, and 15 days after irriga-tion. The average soil moisture contents for these three days were 8.0%, 6.8%, and 2.9% (wet bases-wb), re-spectively. There were no rainfalls during this experiment.
Three levels of ground cover were created by planting a cover crop (“Wrens Abruzzi” rye) at three seeding rates (67.5, 102, and 136 kg·ha−1), six months prior to conducting field tests. After collecting the reflected GPS signals, surface vegetation density (ground cover) in each plot was determined by removing the above-ground biomass from a 1 m2 area in each plot. The samples were oven dried (60˚C for 72 hrs) to determine dry matter
[20]. The biomass from three seeding rates averaged at 550, 2530, and 5760 kg·ha−1.
Two weeks prior to collecting GPS reflectometer data, different levels of soil compaction were created by driving a tractor over the test plots. Broadcast compaction was achieved by shifting tractor by the width of the tractor tire every time to cover entire surface of the plots. Treatment 4 had no tracks, while treatments 5, 6, and 7 received 1, 2 and 3 passes with tractor over entire plot, respectively. This task was completed during a single day following 2.5-cm irrigation. Soil compaction data were collected at different depths using a DGPS-based, hydraulically operated penetrometer system mounted on a John Deere Gator [21]. This data was used to quantify geo-referenced soil resistance to penetration. Soil compaction (Cone Index - CI) values were calculated from the measured force required to push a 3.2 cm2 base area, 30-degree cone into the soil [20]. The average CI values (in the top 25 cm of soil profile) for treatments 4, 5, 6, and 7 were 1.4, 2.5, 2.9, and 3.2 MPa, respectively.
C. V. Privette III et al.
Figure 2. Soil type, EC zones and plot arrangements of the experimental field.
Figure 3. GPS reflectometer mounted on the platform of a 9-m tower (Edisto Research & Education Center, Clemson University).
Ground reflectance measurements were taken from each plot along the center of the rectangles using the DMR mounted on the 9-m tower. The resolution (foot print) of the DMR was calculated using equation 1 [13]; where “A” is the footprint of the reflected signal (m2), “h” is height of receiver above the surface (m), “λ” is the incoming signal wavelength equal to 19.03 cm (in this study), and γ is the elevation angle of satellite signal.
2
sin sin
π
sin (sin )
h h
A
λ
γ
λ
γ
γ
γ
= × × (1)
Resolution of DMR changes with the elevation angle and the height of antennas, as indicated by equation 1. The receiver software was set to accept only high elevation angle satellites (greater than 60 degrees) to make the area of reflection specific to the area directly below the receiver. At 9 m height, as the elevation angle changed from 60 to 90 degree, the footprint of first Fresnel zone ranged from 7.2 to 5.4 m2, respectively.
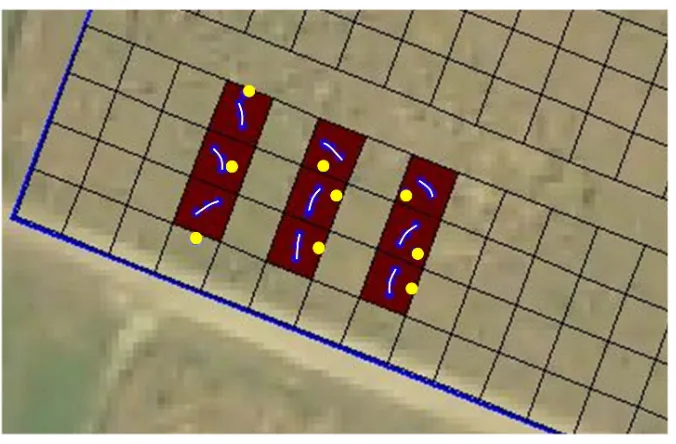
[image:4.595.132.494.87.484.2]Figure 4. An example of the GPS reflected signal path (white lines) with respect to location of the DMR receiver (yellow dots).
data collection with the DMR receiver.
Geo-referenced soil moisture measurements were taken from each plot, using a 5-cm diameter hand-held soil probe. To accurately take soils samples from each plot based on the exact location where the GPS signals were reflected from the ground; the DMR receiver was set up over a bare soil plot and allowed to collect both direct and reflected GPS signals over time. The arc paths then were constructed in each plot, based on the location of the GPS reflectometer, as described by Privette [17]et al. (2011).
The soil cores were divided into 5-cm layers: 0 - 5, 5 - 10, 10 - 15, 15 - 20, and 20 - 25 cm and moisture con-tents were determined for each layer. The corresponding samples from each depth layer in a test plot were com-bined into a single sample. The sample then was placed in tin container, labeled, weighed and oven dried at 105˚C for 24-hours using standard procedures [22].
After the reflectance and soil moisture data were taken, the reflectivity of the GPS signals was post-processed using procedure described by Grant [15]. This algorithm consists of determining the power reflected from the soil surface which is the sum of two components: The first is the reflectivity of the vertically polarized (electric field vector in the plane of incidence) component of the incoming GPS signal and the second is the reflectivity of the horizontally polarized component (electric field vector parallel to the surface) of the electromagnetic field. The receiver software is set to accept only high elevation angle satellites (greater than 60 degrees) to make the area of reflection specific to the area directly below the receiver. As a result of symmetry the two components of the field are, therefore, effectively equal. Automatically added together in the antenna and properly phase shifted by the patch antenna, the summed square of these represent the total reflected power.
Reflectivity is determined by forming the ratio of the total reflected power to the direct power acquired through the upward-looking, satellite-tracking antenna. These antennas are closely matched except in polariza-tion to simplify system calibrapolariza-tion. The antenna gain for both RHCP and LHCP was >4.5 dBic for elevapolariza-tion an-gle between 60 and 90 degrees. The two channels inside the receiver were evaluated using a balanced RF power divider (Model PE2011, Pasternack Enterprises, Inc. Irvine, CA) and recording the signal-to-noise ratio (SNR).
Figure 5 shows a very strong correlation in SNR between two channels (R2 = 0.94 and slope of 1.03).
C. V. Privette III et al.
Figure 5. SNR of top and bottom channels of DMR
measured using the RF power divider.
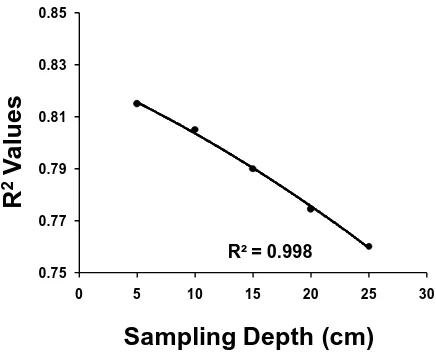
were significant components of the models, then there was evidence that the relationship of reflectivity and soil moisture was inconsistent across different soil compactions, soil types, and crop biomasses. ANOVA F-Tests were used to determine if the parameters associated with the interaction terms were significant. The square root of GPS reflectivity “Reflectivity Index” (RI) was used as the response variable in the statistical model instead of actual reflectivity, because the reflectivity index and moisture appear to have a simple linear relationship. Final-ly, the simple linear regression model for reflectively index verses moisture relationship was performed at five different moisture depths (5, 10, 15, 20, 25 cm) to determine if the strength of the relationship (as measured by the coefficient of determination, R2) differed among the moisture depths. All calculations were conducted using JMP 10.0.0 (SAS Institute Inc., 2012) and all tests used a significance level of 0.05.
3. Results
Figure 6 shows the relationship of soil moisture contents on the Reflectivity Index. A strong positive linear rela-tionship between the reflectivity index and soil moisture content in the top 25 cm of soil was detected (R2 = 0.788). During the reflectivity measurements, soil moisture contents of the field changed between 1% and 12% only, due to high sand contents of test field. The estimated linear model for this relationship is:
RI=0.1389+0.0273M
where RI equals reflectivity index and M is soil moisture contents. The estimated increase in reflectivity per unit increase in soil moisture contents was 0.0273. This indicates that this model has potential for estimating soil moisture contents from reflectivity using inverse regression.
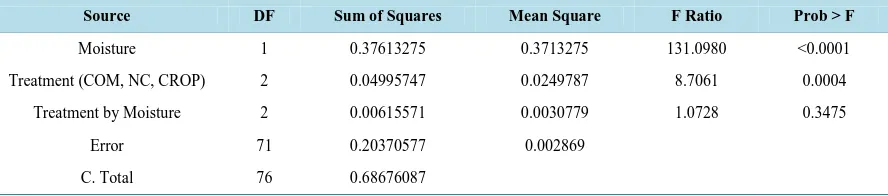
Figure 7 shows the relationship between the reflectivity index and soil moisture contents separated by treat-ments (COM, CROP, NC). Using a multiple linear regression model with the main effect of moisture, the main effect of treatment, and the interaction of moisture and treatment; the interaction term was not significant in the model. This indicated that the slopes of the regression lines for the three treatments were not different. Regres-sion line slopes were 0.02, 0.03, and 0.02 for COM, NC, and CROP, respectively. Table 2 presents the ANOVA F-test results.
[image:6.595.215.417.79.305.2]Moisture Contents (%)
R
e
fl
e
ct
iv
it
y
I
nde
x
Y = 0.0273x + 0.1389 R² = 0.788
0 0.1 0.2 0.3 0.4 0.5
0 2 4 6 8 10 12
[image:7.595.205.422.85.257.2]
Figure 6. Effects of soil moisture contents on reflectivity index.
Figure 7. Relationship of reflectivity index and soil moisture contents separated by-treatments: compacted (COM), no compaction (NC), and ground cover (CROP).
R
e
fl
e
ct
iv
it
y
I
nde
x
0 0.1 0.2 0.3 0.4 0.5
0 2 4 6 8 10 12
Lakeland Fuquay Faceville
Moisture Contents (%)
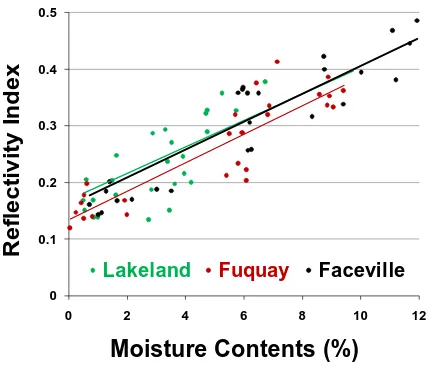
Figure 8. Relationship of reflectivity index and soil moisture
[image:7.595.204.424.287.463.2] [image:7.595.207.421.511.694.2]C. V. Privette III et al.
Table 2. ANOVA results of reflectivity index versus moisture and treatment.
Source DF Sum of Squares Mean Square F Ratio Prob > F
Moisture 1 0.37613275 0.3713275 131.0980 <0.0001
Treatment (COM, NC, CROP) 2 0.04995747 0.0249787 8.7061 0.0004
Treatment by Moisture 2 0.00615571 0.0030779 1.0728 0.3475
Error 71 0.20370577 0.002869
C. Total 76 0.68676087
Table 3. ANOVA table of reflectivity index versus moisture and soil type.
Source DF Sum of Squares Mean Square F Ratio Prob > F
Moisture 1 0.30355215 0.30355215 82.8923 <0.0001*
Soil Type 2 0.01271813 0.006359 1.7365 0.1833
Soil Type by Moisture 2 0.00429694 0.0021484 0.5867 0.5588
Error 73 0.26732662 0.003662
[image:8.595.87.542.480.575.2]C. Total 78 0.77412139
Table 4. ANOVA table of reflectivity index versus moisture and actual compaction measure.
Source DF Sum of Squares Mean Square F Ratio Prob > F
Moisture 1 0.40542071 0.40542071 131.4979 <0.0001*
Compaction 1 0.00093599 0.00093599 0.3036 0.5841
Compaction by Moisture 1 0.00865725 0.00865725 2.8080 0.1002
Error 49 0.15107168 0.003083
C. Total 52 0.58067948
Table 5. ANOVA table of reflectivity index versus moisture and actual crop biomass measure.
Source DF Sum of Squares Mean Square F Ratio Prob > F
Moisture 1 0.56627584 0.56627584 157.4121 <0.0001*
Biomass 1 0.00571571 0.00571571 1.5888 0.2114
Biomass by Moisture 1 0.00058714 0.00058714 0.1632 0.6874
Error 75 0.26980570 0.003597
C. Total 78 0.84252875
Results so far suggested that the relationship of reflectivity and moisture was consistent, but to be sure two additional multiple linear regression models and analyses were developed. One model included the actual com-paction measure of the sample plots in addition to soil moisture and the other included the actual crop biomass measures of the sample plots in addition to soil moisture. Table 4 and Table 5 present the ANOVA F-test re-sults for these models. As in previous rere-sults, the interaction terms were not significant, indicating that slopes of the regression lines across the different compaction measures and biomass measures were not different.
Sampling Depth (cm)
R
2
V
a
lues
R² = 0.998
0.75 0.77 0.79 0.81 0.83 0.85
[image:9.595.205.423.83.261.2]0 5 10 15 20 25 30
Figure 9. Relationship of R2 and sampling depth. The R2 value is for the coefficient of determination of thereflectivity index and mositure linear relationship at a particular depth.
4. Conclusion
A significant relationship was found between reflectivity index and moisture content, specifically the reflectivity index increased by approximately 0.02 as the soil moisture contents increased. In a series of multiple linear re-gression models, the interactions of soil moisture and several factors present in the data set (such as soil com-paction, soil type, and biomass) were found to be non-significant. This provided evidence that the relationship was relatively stable. These results suggest that this technology has potential for estimating soil volumetric moisture contents in the pursuit of site-specific irrigation management.
Acknowledgements
The authors acknowledge the funding support of the South Carolina Space Grant Consortium and the NASA Langley Research Center, Hampton, VA. Technical Contribution No. 6405 of the Clemson University Experi-ment Station. This material is based upon work supported by NIFA/USDA, under project number SC-700498.
Disclaimer
Mention of a trade name does not imply endorsement of the product by Clemson University to the exclusion of others that might be available.
References
[1] Bruce, R.R. and Römkens, M.J.M. (1965) Fruiting and Growth Characteristics of Cotton in Relation to Soil Moisture Tension. Agronomy Journal, 57, 135-140. http://dx.doi.org/10.2134/agronj1965.00021962005700020003x
[2] Mathur, D., Khalilian, A., Owino, T. and Sullivan, M. (2002) Scheduling of Subsurface Drip Irrigation of Cotton Using Time Domain Transmissometry (TDT). ASAE Technical Paper No. 02-2111, ASAE, St. Joseph, MI.
[3] Paltineanu, I. and Starr, J. (1997) Real-Time Water Dynamics Using Multisensor Capacitance Probes: Laboratory Ca-libration. Soil Science Society of America Journal, 61, 1576-1585.
http://dx.doi.org/10.2136/sssaj1997.03615995006100060006x
[4] Sloane, D.H.G. (2007) AquaSpy—A Revolutionary New Soil Moisture Sensor. In: Proceedings of the Beltwide Cotton Conferences, National Cotton Council of America Memphis, Memphis, TN, 1751-1753.
[5] Bellamy, C., Khalilian, A., Farahani, H., Privette, C. and Henderson, W. (2009) Sensor Based Soil Water & Crop Monitoring in Cotton Production. Proceedings of the Beltwide Cotton Conferences, National Cotton Council of Amer-ica, Memphis, TN, 383-387.
C. V. Privette III et al.
[7] Jackson, T.J., Schmugge, T.J. and Wang, J.R. (1982) Passive Microwave Sensing of Soil Moisture under Vegetation Canopies. Water Resources Research, 18, 1137-1142. http://dx.doi.org/10.1029/WR018i004p01137
[8] Jackson, T. and Schmugge, T. (1992) Surface Soil Moisture Measurement with Microwave Radiometry. 43rd Con-gress of the International Astronautical Federation, IAF 92-0122, 749-751.
[9] Wigneron, J.-P., Calvet, J.-C., Pellarin, T., Van de Griend, A.A., Berger, M. and Ferrazzoli, P. (2003) Retrieving Near-Surface Soil Moisture from Microwave Radiometric Observations: Current Status and Future Plans. Remote Sensing of Environment,85, 489-506. http://dx.doi.org/10.1016/S0034-4257(03)00051-8
[10] Larson, K.M., Small, E.E., Gutmann, E., Bilich, A., Braun, J. and Zavorotny, V. (2008) Use of GPS Receivers as a Soil Moisture Network for Water Cycle Studies. Geophysical Research Letters, 35, L24405.
http://dx.doi.org/10.1029/2008GL036013
[11] Larson, K.M., Braun, J.J., Small, E.E., Zavorotny, V.U., Gutmann, E. and Bilich, A.L. (2010) GPS Multipath and Its Relation to Near-Surface Soil Moisture Content. IEEE Journal of Selected Topics in Applied Earth Observations and Remote Sensing, 3, 91-99.
[12] Njoku, E.G. and Entekhabi, D. (1996) Passive Microwave Remote Sensing of Soil Moisture. Journal of Hydrology,
184, 101-129. http://dx.doi.org/10.1016/0022-1694(95)02970-2
[13] Katzberg, S., Torres, O., Grant, M. and Masters, D. (2006) Utilizing Calibrated GPS Reflected Signals to Estimate Soil Reflectivity and Dielectric Constant: Results from SMEX02. Remote Sensing of Environment, 100, 17-28.
http://dx.doi.org/10.1016/j.rse.2005.09.015
[14] Masters, D., Axelrad, P. and Katzberg, S. (2004) Initial Results of Land-Reflected GPS Bistatic Radar Measurements in SMEX02. Remote Sensing of Environment, 92, 507-520. http://dx.doi.org/10.1016/j.rse.2004.05.016
[15] Grant, M., Katzberg, S. and Lawrence, R. (2005) GPS Remote Sensing Measurements Using Aerosonde UAV, NTRS: 2006-08-03 Document ID: 20050234606; Report Number: AIAA Paper 2005-7005.
[16] Zavorotny, V.U., Larson, K.M., Braun, J.J., Small, E.E., Gutmann, E.D. and Bilich, A.L. (2010) A Physical Model for GPS Multipath Caused by Land Reflections: Toward Bare Soil Moisture Retrievals. IEEE Journal of Selected Topics in Applied Earth Observations and Remote Sensing, 3, 100-110. http://dx.doi.org/10.1109/jstars.2009.2033608
[17] Privette III, C.V., Khalilian, A., Torres, O. and Katzberg, S. (2011) Utilizing Space-Based GPS Technology to Deter-mine Hydrological Properties of Soils. Remote Sensing of Environment, 115, 3582-3586.
http://dx.doi.org/10.1016/j.rse.2011.08.019
[18] Khalilian, A., Privette III, C.V., Han, Y.J. and Katzberg, S.J. (2010) Environmental Enhancement Utilizing Space- Based GPS Technology Developed by NASA to Determine Hydrological Properties for Watershed Management. Un-published Research Report to South Carolina Space Grant Consortium, College of Charleston, Charleston, #NNG05GI68G.
[19] Lund, E.D., Christy, C.D. and Drummond, P.E. (1999) Practical Applications of Soil Electrical Conductivity Mapping. In: Stafford, J.V., Ed., Precision Agriculture ‘99—Proceedings of the 2nd European Conference on Precision Agri-culture, Denmark, 11-15 July 1999, SCI, Sheffield, 771-779.
[20] ASAE Standards (2006) ASAE S313.3: Soil Cone Penetrometer and ASAE S358.2: Moisture Measurement—Forages. American Society of Agricultural & Biological Engineers, ASABE, St. Joseph.
[21] Khalilian, A., Han, Y.J., Dodd, R.B., Sullivan, M.J., Gorucu, S. and Keskin, M. (2002) A Control System for Variable Depth Tillage. ASAE Paper No. 021209, ASABE, St. Joseph.
[22] Bolton, M. (1979) A Guide to Soil Mechanics. Halsted Press Book, John Wiley & Sons, New York.