Munich Personal RePEc Archive
Business services and the changing
structure of European economic growth
Kox, Henk L.M. and Rubalcaba, Luis
CPB Netherlands Bureau for Economic Policy Analysis
4 July 2007
Online at
https://mpra.ub.uni-muenchen.de/3750/
Business services and the changing structure of European economic
growth
Abstract:
A pervasive trend that characterised the past two decades of European economic growth is that the share in the economy of commercial services, and particularly business services, grows monotonically, and this mainly to the expense of the manufacturing sector. The structural shift reflects a changing and increasingly complex social division of labour between economic sectors. The fabric of inter-industry relations is being woven in a new way due to the growing specialisation in knowledge services, the exploitation of scale economies for human capital, lowered costs of outsourcing in-house services, and the growing encapsulation of manufacturing products in a ‘service jacket’. Business services, which inter alia includes the software industry and other knowledge-intensive business services (KIBS), play a key role in many of these processes.
We argue that in recent decades business services contributed heavily to European economic growth, in terms of employment, productivity and innovation. A direct growth contribution stems from the business-services sector’s own remarkably fast growth, while an indirect growth contribution was caused by the positive knowledge and productivity spill-overs from business services to other industries. The spill-overs come in three forms: from original innovations, from speeding up knowledge diffusion, and from the reduction of human capital indivisibilities at firm level. The external supply of knowledge and skill inputs exploits positive external scale economies and reduces the role of internal (firm-level) scale (dis)economies associated with these inputs. The relatively low productivity growth that characterises some business-services sectors may be a drag on the sector's direct contribution to overall economic growth. The paper argues that there is no reason to expect a “Baumol disease” effect as long as the productivity and growth spill-overs from KIBS to other economic sectors are large enough.
Finally, the paper pinpoints some policy 'handles' that could be instrumental in boosting the future contribution of business services to overall European economic growth.
JEL Classification: E32, L2, L8, L16, O3, O4, O52
*)
Contact: h.l.m.kox@cpb.nl, phone : +31.70.338.3413, fax: +31.70.338.3350, CPB Netherlands Bureau for Economic Policy Analysis, The Hague, Netherlands, www.cpb.nl
CPB Memorandum
CPB Netherlands Bureau for Economic Policy Analysis
Sector : VI
Number : 183
Authors : Henk Kox*) and Luis Rubalcaba (University of Alcala, Madrid)
Contents
1 Introduction 3
1.1 A positive definition of business services 3
2 The growth of European business services 5
2.1 The magnitude of BS growth 6
2.2 Causes of structural growth 7
2.3 Human-capital characteristics of BS employment growth 18
2.4 "Offshoring" tendencies and BS replacement growth 19
2.5 Growth of European BS industry: conclusions 21
3 The contribution of business services to European economic growth 23
3.1 The direct growth contribution of business services 23
3.2 The indirect growth contribution of business services 28
3.3 Is the 'Baumol disease' looming? 32
3.4 Measuring the contribution of business services to economic growth 33
3.5 The contribution by BS industry to European growth: conclusions 36
4 Policy issues related to the future role of business services in the European economy 37
4.1 Potential market failures in the BS sector 38
4.2 Scope for EU-wide policies in business services markets 45
1
Introduction
This paper analyses the position of business services in European economic growth, putting emphasis
on two aspects: (a) what has caused the fast growth of the European business-services industry, and
(b) how has the business-services industry contributed to overall economic growth?
The European economy is in a process of structural change. Two major trends characterised the
period of the past two decades. One is that the share of manufacturing in the economy is shrinking.
The other trend is that services, and particularly business services, account for a monotonically
increasing share of the European economy. Both structural shifts are linked to each other in several
ways. We argue that one of the drivers of change is the exploitation of scale economies for human
capital and −linked with that− the growing specialisation in knowledge services. Other relevant
drivers are the growing tertiarisation of all production processes (including manufacturing) and the
lowered costs of outsourcing in-house services functions. The business services industry plays a key
role in such structural change, a role that has remained under-explored in the literature so far.
The paper is divided in four parts. The first one deals with conceptual issues, offering an analytic
definition of business services. The second section surveys the literature that explains the very strong
growth of business-services industry in recent decades, confronting some popular views with a
number of stylised facts. The theory contending that the growth of business services industry is just
an optical illusion caused by outsourcing of other industries may be true for some low-skilled services
functions, but for the rest this theory fits uneasy with some of the empirics. We propose an alternative
explanation according to which the growth of business services represents a qualitatively new stage in
the structure of production, driven by scale economies with regard to knowledge and skill inputs.
Firm-level diseconomies with regard to such inputs are reduced by having them delivered externally,
thus exploiting external scale economies. The third section covers the contribution by the
business-services industry to overall economic growth through spillovers in the form of knowledge
dissemination, original innovations and productivity effects in other parts of the economy. In the
fourth and final section we address some market failure issues where policy intervention could
perhaps boosting the future contribution of business services to overall European economic growth.
1.1 A positive definition of business services
The container concept business services covers a broad spectrum of services that are mainly traded in
business-to-business transactions. These intermediary services range from software development to
temporary-labour agencies, from equipment rental to legal consultancy, and from translation services
From Adam Smith’s times onwards, services have been defined by what they are not – no goods, non-
material, intangible, no agriculture, no manufacturing.1 Hill, in a seminal article (1977), did away
with this negative approach towards services. In ‘On goods and services’ he emphasised a difference
between goods and services. Goods are physical objects that can be appropriated and therefore are
transferable between economic units. However, a service provided by an economic unit, represents "a
change to the condition of" a person or goods belonging to another economic unit. The service is
defined as a positive result.2
Business services are predominantly delivered to companies, other production organisations and
government agencies. Hence, viewed from the angle of their destination, business services are
primarily intermediate inputs; they can complement or substitute existing in-house service functions
of client firms.3 Often the business service is co-produced interactively with the client. Building on
Hill’s definition of services we define BS by their role for clients:
Business services is a set service activities that - through their use as intermediary inputs -
affect the quality and efficiency of the production activities, by complementing or
substituting the in-house service functions.
The definition implies that business-services firms supply activities that in many cases could also
have been produced in-house by the client. Service elements are pervasive in all production processes.
Functional services like planning, design, monitoring, customer contacts and evaluation are close to
the very heart of almost any production process. Also, there are lots of auxiliary services in most
firms, like cleaning, human resources management, personnel recruitment, training, security,
maintenance, facility management and catering. All these functional services can be provided by
employees on a firm’s own payroll, or they can be bought from outside providers. In the latter case,
we speak of business services as an independent industry.
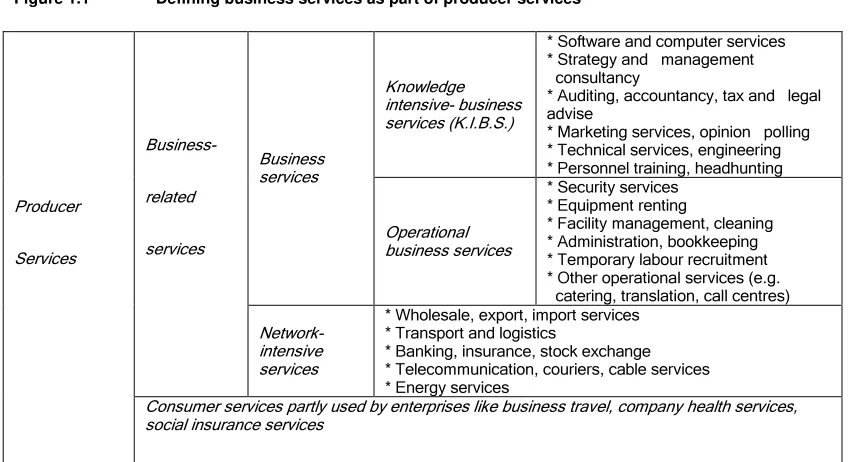
Figure 1.1 presents an operational taxonomy of business services based on the aforementioned
definition. Business services are distinct from network-intensive services that in most cases can be
produced in-house only at the expense large scale diseconomies. Figure 1.1 distinguishes between
knowledge-intensive business services (KIBS) and operational business services, based on the
average degree of human-capital intensity of the labour force.
Statistical classification problems for business services are larger than average for the commercial
services sector. The fact that most business services in the EU nowadays are classified in the residual
category Other Business Services (NACE 74) exemplifies the relatively short history of business
1 For brief history of the concept see Rubalcaba and Kox (2007: Introduction), and also Schettkat and Yocarini (2003). 2 See also Martini (1990), Rubalcaba (1999) and Gadrey et al. (1998) for positive definitions of services.
3 Even though some business services – such as notary or architectural services – supply part of their production to individual
Figure 1.1 Defining business services as part of producer services
Knowledge intensive- business services (K.I.B.S.)
* Software and computer services * Strategy and management consultancy
* Auditing, accountancy, tax and legal advise
* Marketing services, opinion polling * Technical services, engineering * Personnel training, headhunting
Business services
Operational business services
* Security services * Equipment renting
* Facility management, cleaning * Administration, bookkeeping * Temporary labour recruitment * Other operational services (e.g. catering, translation, call centres)
Business-
related
services
Network-intensive services
* Wholesale, export, import services * Transport and logistics
* Banking, insurance, stock exchange * Telecommunication, couriers, cable services * Energy services
Producer
Services
Consumer services partly used by enterprises like business travel, company health services, social insurance services
services as an independent economic sector. The functional industry classifications (NACE, ISIC) do
not start from a positive definition of business services. They use a negative statistical approach based
on classification as residual: what is not in ..., not elsewhere classified.4 The relative newness of the
sector, the continuously evolving product differentiation, and also the lack of interest shown by
statistical authorities resulted in opaque and non-analytic classifications.
For brevity reasons and to avoid endless repetition in the rest of this paper, we will henceforth use the
abbreviation 'BS' for business services and 'BS industry' or 'BS sector' for the business-services
industry.
2 The growth of European business services
The most direct contribution of the BS sector to economic growth comes from its own dynamism and
expansion. BS industry appears to be an ‘early mover’ over the business cycle (cf Rubalca and Kox
2007: Ch.1), but we will disregard the cyclical aspects here. After proving some key data on the
growth of the European BS industry we concentrate on the explanations for the structural
business-services growth.
4 The NACE category Other Business Services is subdivided in sectors. The last 3-digit sector (NACE 748) again uses a negative
2.1 The magnitude of BS growth
The BS sector has experienced a remarkably strong growth process in the past two decades, in terms
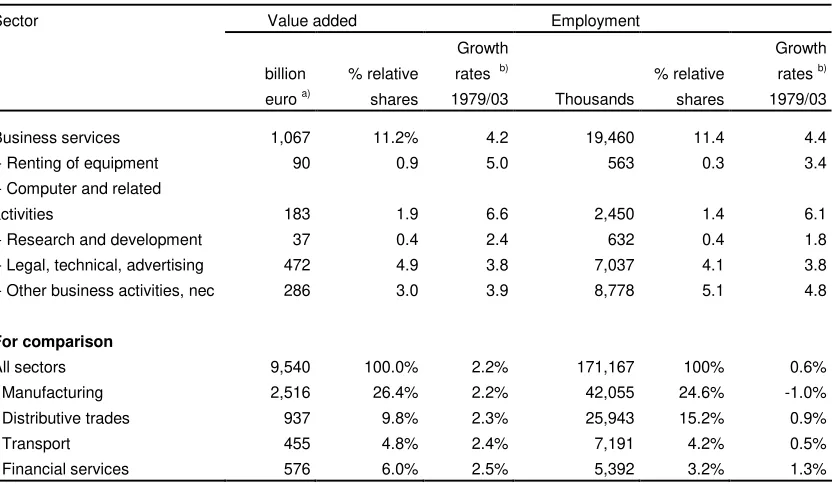
of both employment and value added. As shown in Table 2.1, business services nowadays count as
one of the largest economic sectors in the European economy, larger than such sectors as transport,
communication, hotels and restaurants taken together. With a 4.2 per cent annualised growth rate of
value-added between 1979 and 2003, BS was the most dynamic sector after telecommunications. In
terms of employment, the growth of business services (4.4 per cent) far outstripped the growth of all
other sectors.
Table 2.1 Key data on the growth of business services, European Union (EU15), 2003
Value added Employment Sector
billion euro a)
% relative shares
Growth rates b)
1979/03 Thousands
% relative shares
Growth rates b) 1979/03
Business services 1,067 11.2% 4.2 19,460 11.4 4.4 - Renting of equipment 90 0.9 5.0 563 0.3 3.4 - Computer and related
activities 183 1.9 6.6 2,450 1.4 6.1 - Research and development 37 0.4 2.4 632 0.4 1.8 - Legal, technical, advertising 472 4.9 3.8 7,037 4.1 3.8 - Other business activities, nec 286 3.0 3.9 8,778 5.1 4.8
For comparison
All sectors 9,540 100.0% 2.2% 171,167 100% 0.6% - Manufacturing 2,516 26.4% 2.2% 42,055 24.6% -1.0% - Distributive trades 937 9.8% 2.3% 25,943 15.2% 0.9% - Transport 455 4.8% 2.4% 7,191 4.2% 0.5% - Financial services 576 6.0% 2.5% 5,392 3.2% 1.3%
Notes: a)
Current prices. b)
[image:7.595.85.501.279.521.2]Annual exponential growth rates. Value added at constant prices 1995. Sources: data OECD National Accounts data (STAN), and data compiled by Groningen Growth and Development Centre GGDC (cf. O’Mahony and Van Ark, 2003).
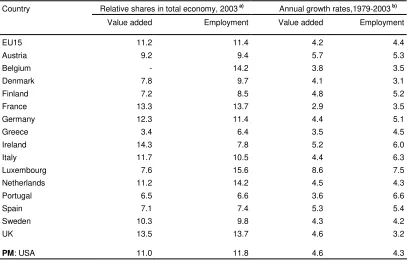
Table 2.2 shows some differences between EU countries.5 Countries with consistent high growth rates
are Austria, Ireland, Luxemburg and Spain, while France, Belgium and Denmark are witnessed
relatively low growth rates for value added and employment. Interestingly, the EU15 countries and
the USA had similar employment growth rates in business services over this long period, but the
average value-added growth in the USA was higher. This differences implies that productivity growth
in the EU business-services sector was weaker than in the USA.
Table 2.2 The growth rate and the share of business services value added and employment. Selected countries, 1979-2003
Relative shares in total economy, 2003a)
Annual growth rates,1979-2003 b) Value added Employment Value added Employment Country
EU15 11.2 11.4 4.2 4.4
Austria 9.2 9.4 5.7 5.3
Belgium - 14.2 3.8 3.5
Denmark 7.8 9.7 4.1 3.1
Finland 7.2 8.5 4.8 5.2
France 13.3 13.7 2.9 3.5
Germany 12.3 11.4 4.4 5.1
Greece 3.4 6.4 3.5 4.5
Ireland 14.3 7.8 5.2 6.0
Italy 11.7 10.5 4.4 6.3
Luxembourg 7.6 15.6 8.6 7.5
Netherlands 11.2 14.2 4.5 4.3
Portugal 6.5 6.6 3.6 6.6
Spain 7.1 7.4 5.3 5.4
Sweden 10.3 9.8 4.3 4.2
UK 13.5 13.7 4.6 3.2
PM: USA 11.0 11.8 4.6 4.3
Notes: a) Current prices. b) Annual exponential growth rates. Value added at constant prices 1995. Sources: data OECD National Accounts data (STAN), extended and compiled by GGDC, see Table 2.1.
Summarising the empirical evidence, over the past decades employment in business services grew
faster than in the total European economy and also faster than in the rest of the European services
sector. The countries of northern and central Europe display stronger employment growth in business
services than those in southern Europe. In absolute terms, job creation in the BS sector in all countries
represented a major shift in market-sector employment. The growth difference between business
services and the rest of the economy was smaller for value added than for employment.
2.2 Causes of structural growth
The spectacular growth performance of the BS industry may have several causes, some of which are
shared more broadly by a larger group of services sectors. Literature surveys yield a panoply of
explanatory factors for the relative expansion of services industries. The explanations operate at
different levels of analysis (micro, meso, macro). Several factors can operate at the same time, though
at different levels of analysis. Most explanations can be brought under one of the following three
headings. The first group relates to shifts in the structure of final demand (Engel’s ‘law’, changing
division of labour (technology, organisation). Finally, another group of explanations focuses on the
shifts caused by diverging productivity growth rates of individual industries.6
Business services are foremostly intermediary inputs, so that changes in final demand tend to be
of only secondary or indirect importance. This paper zooms in on the second group of explanations,
in particular the division of labour between industries. In this area, we compare two dominant
explanations for structural growth of business services. The first theory, defended inter alia by Rajan
(1987) and Lewis (1988), states that the BS growth is an optical illusion. They state that existing
service activities and jobs in other industries are simply replaced by similar activities in BS industry.7
The second theory defends that structural growth of business services is a new development phase in
the social division of labour. It builds on Adam Smith’s classic view that specialisation and scale
effects form the very heart of economic progress.8 We subsequently deal with both explanations.
If the entire growth of BS industry would be based on a simple shift of existing in-house services jobs
from other sectors to BS firms then we could indeed speak of a purely administrative shift: a
"changing of nameplates". It is inherent in our definition of business services (section 1) that many
services supplied by BS firms could also have been produced internally by firms in other industries.
On average about 40 per cent of all persons employed in manufacturing work in occupations that are
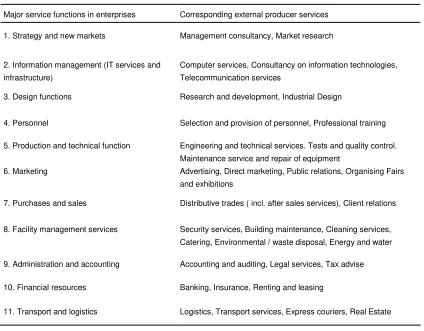
more or less (business)service-related.9 Table 2.3 sketches a range of intra-company service functions
that may or may not be up for outsourcing to BS firms.
The proposition that the growth of business services merely represents only an administrative change
can be analysed in the same way as an analogue problem in international trade theory. Viner (1950)
investigated whether economic integration between countries leads to additional trade (trade creation)
or whether it represents a re-channelling of trade patterns (trade diversion).10 Following Viner’s
distinction, we can distinguish two types of BS growth:
• Displacement growth (trade diversion) occurs when services hitherto produced in-house by other industries are outsourced to BS firms, without a change in the nature of the services.
• Trade creation occurs when BS firms provide products to client firms that are different (higher quality, more specialised) from the in-house services that the client firms produced in-house
beforehand, or that are even completely new.
6 Fuchs (1968), Rubalcaba (1999), Aiginger (2001), Kox (2001), Schettkat and Yocarini (2003), Miles (2007) and Gregory et al.
(2007) present comprehensive literature surveys on the growth factors.
7 Rajan (1987) and Lewis (1988) find empirically that business-services growth is due to employment substitution inside the
companies as a result of subcontracting the required services outside the company. The characteristics and significance of their statistical results have, however, been called into question by Perry (1992).
8 The theory has been developed further by inter alia Stigler (1951), Edwards and Starr (1987) and Francois (1990).
9 The following count as services-related occupations are: legislators, senior officials and managers, professionals and associate
professionals, clerks, service workers and shop and market sales workers, as well as drivers, sales and services elementary occupations and transport workers (Wölfl 2004).
Table 2.3 Internal service functions and externally delivered producer services
Major service functions in enterprises Corresponding external producer services
1. Strategy and new markets Management consultancy, Market research
2. Information management (IT services and infrastructure)
Computer services, Consultancy on information technologies, Telecommunication services
3. Design functions Research and development, Industrial Design
4. Personnel Selection and provision of personnel, Professional training
5. Production and technical function Engineering and technical services. Tests and quality control. Maintenance service and repair of equipment
6. Marketing Advertising, Direct marketing, Public relations, Organising Fairs and exhibitions
7. Purchases and sales Distributive trades ( incl. after sales services), Client relations
8. Facility management services Security services, Building maintenance, Cleaning services, Catering, Environmental / waste disposal, Energy and water
9. Administration and accounting Accounting and auditing, Legal services, Tax advise
10. Financial resources Banking, Insurance, Renting and leasing
11. Transport and logistics Logistics, Transport services, Express couriers, Real Estate
It is an empirical question which of both growth-types accounts for most of the recent growth of
business services. Given the heterogeneity of firms and their in-house services this in fact requires a
broad survey-based research method using firm-level microdata. To our knowledge such a study does
not yet exist. We therefore turn to second-best research methods based on sector-level data.
2.2.1 Is replacement growth the best explanation?
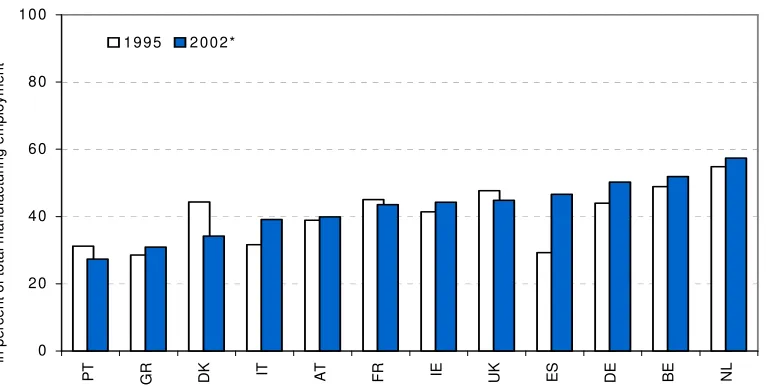
A first test is whether the share of services jobs in manufacturing has diminished over time.
Figure 2.1 shows that since 1995 it has indeed declined in the UK, Denmark and France. However, it
has increased in all the other EU countries, especially in Spain, Italy and Germany. These data
therefore do not confirm the existence of an overall trend towards a lower share of service-related
jobs in manufacturing. The test is not conclusive, because the employment structure in manufacturing
may be subject to other tendencies that affect the number of services jobs. For example, an increasing
2002).11 This in itself could cause a persistent increase in the number of service jobs in
[image:11.595.100.483.195.390.2]manufacturing.
Figure 2.1 Share of employment in service-related occupations in the manufacturing sector (as % of total employment of manufacturing, 1995 and 2002)
0 2 0 4 0 6 0 8 0 1 0 0
P T G R D K IT A T F R IE U K E S D E B E N L in p e rc e n t o f to ta l m a n u fa c tu ri n g e m p lo y m e n t
1 9 9 5 2 0 0 2 *
Note: Services-related occupations cover ISCO classes 100-500, 830, 910, 933. Data for Germany are from 2001. Data source: EU Labour Force Survey 1995, 2002 (figure reproduced from Pilat and Wölfl , 2005).
Since the late 1980s, many empirical studies applied some form of input-output analysis to
analyse growth factors for services sectors, often at a rather high aggregation level and mostly
for one specific country.12 Most of the intermediate deliveries from business services appear to
go to manufacturing, the BS industry itself, and the public sector (e.g. Ecorys 2004). A test to establish the growth sources of the BS sector can be based on input-output analysis. A rough
approximation method is the following. Assume a simple input-output system with three sectors:
business services industry B, other market industries M and the non-market sectors Q. The
input-output system is:
(1)
11 For instance, producers of photocopying machines now sell x months of problem-free photocopying instead of only the hardware,
just as producers of airplane engines sell y hours of problem-free flying. This means an increase of manufacturing jobs into downstream production stages (sales, consulting, maintenance, insurance, leasing).
12 Cf. the empirical growth studies on producer and business services by Buyers and Lindale (1996), Kitschier (1988), Shatter
(1987), Fontaine (1988), Oosterhaven and Hoen (1998), Klodt et al. (1997), Peneder et al. (2000), Wölfl (2004), Perry (1990), De Bandt (1995, 1999), Kox (2001), Pilat and Wölfl (2005), Coe (2000), Savona and Lorentz (2006).
in which x is a vector of gross production, R is the Leontief inverse matrix (3 x 3 dimension) of
intermediate deliveries, and y is a vector of final demand. The growth of gross production between
period 1 and period 0 is given by:
(2)
The change in final demand can be expressed in terms of the final demand in period 0 and a row
vector (f) that gives growth perunages of total final demand per sector, so that:
(3)
The base year shares of final demand are used as weights for the growth rates. The framework can be
applied straightforwardly for tracing the causes of the structural growth-rate difference between the
B sector and the M sector:
(4)
After filling in all elements from the full input-output system, the structural growth rate difference
between the B sector and the M sector can be decomposed like in equation (3):
(5)
Using this decomposition we may break down the sources of structural BS growth. Specifically, it
may give the relevance and relative importance of the following growth sources:
a) final demand in BS grows faster than in both other sectors if y•B >(y•M ,y•Q).
b) BS benefits more than other market industries from privatisation (public procurement) in the
public sector if ∆rBQ >∆rMQ.
c) the BS sector increases its share in total intermediary deliveries of Other market Industries
if [∆rBM −∆rMM]yMo >0.13
d) Controlling for the aforementioned effects, BS growth would be replacement growth if the
absolute fall in value added of Other Industries is about equal to the growth of intermediary
BS deliveries to Other Industries.
13 This finding could indicate replacement growth if it goes along with an at least equivalent shrinking of value added in the M sector.
E.g. when the M sector outsources in-house services to the B sector predominantly for reasons of (labour) cost-saving.
o o M M B B M B x x x x x
x − = ∆ − ∆
• • ∆ − ∆ + +∆ − ∆ + + ∆ − ∆ + +∆ − ∆ + + ∆ − ∆ + +∆ − ∆ + = − • • • • • o o o o o o o o o o 0 o o M MQo B BQo Qo M MQ MQo B BQ BQo Qo Q M MM B BM Mo M MM MMo B BM BMo Mo M M MB B BB B M MB MBo B BB BBo Bo B M B x r x r y x x r x r r y y x r x r y x x r x r r y y x r x r y x x r x r r y y x x o o o
o R f y R f y
y R
x=∆ + +∆
∆ y R y R y R y R y R x x
x= − o = − o o =∆ o + o∆ +∆ ∆
If replacement growth would indeed be the dominant reason for the growth of business services then
we should find that the last two conditions (c,d) are satisfied. Moreover, the importance of growth
source c for Business Services must be larger than that of the growth sources a and b together.
The aforementioned growth decomposition analysis has not yet been applied to the structural growth
of European business services for the period starting in 1990 due to data comparability problems.14
Savona and Lorentz (2006) apply growth decomposition for 13 sectors in four countries. On the basis
of their results, Figure 2.6 shows that in each of the countries the BS sector registered a higher growth
rate of intermediate demand than two benchmark sectors. The graph shows that intermediate demand
was relatively strong for business services in the 1980s and early 1990. This indicates – in terms of the aforementioned growth factors – that factor c indeed has been relatively important for BS. In the last time period, the role of intermediate demand is getting more in line with the two benchmark
sectors (smaller growth-rate difference). Savona and Lorentz find that most of the growth in business
services came from intermediate demand (factor c), but we do not know to whether this arose from
new services products or from replaced services. Savona and Lorentz also find that a substantial part
of BS growth came from final demand (factor a). The latter finding is clearly at odds with the
replacement hypothesis. The same holds for the empirical result that BS industry itself has become
the most intensive user of BS inputs (e.g. ECORYS 2004). This can hardly be reconciled with the proposition that the growth of business services is mostly due to displacement growth. The available
evidence suggests that displacement growth can at best explain a limited part of BS growth.
Ruyssen (1990) in a study for the European Commission found that the role of BS subcontracting is
seldom just a transfer of employment between sectors. It often involves a new division of work
between the client company and the service-providing company. Several studies indicate that a shift
has taken place from pure replacement outsourcing to service-upgrading, particularly with regard to
the human-capital content of the services product.15
14 Amounts must be expressed in constant prices and correction is necessary for that part of growth that is due to growth in final
output of Other Industries. The test can be done for most EU countries as soon as comparable input-output tables in constant prices for the 1990s are available. A large ongoing EU project, EUKLEMS (http://www.euklems.net/), in CPB which among many national statistical and research institutes co-operate, may yield these results in some years.
Figure 2.6 Growth rate difference of the share of intermediate demand in total output: business services compared to manufacturing industries and financial services. (Germany, UK, Netherlands and USA, data for three sub-periods) a)
Note: a) For manufacturing we used two sub-sectors (machinery industry and electrical-equipment industry) that both have substantial intermediate deliveries. Source: calculated from data in Savona and Lorentz (2006).
2.2.2 BS growth and structural change
The development of business services as an industry forms a step in the process of labour division.
Many studies conclude that the output increase in (business) services has to more to do with overall
changes in the productive system than with just a redistribution of activities between manufacturing
sector and the services sector. Specialised knowledge-intensive business functions that in the past
were regarded as core competences of firms −and therefore not subject to outsourcing− are
increasingly outsourced to specialised outside firms, or are continued in close co-operation with the
latter.16 In the past 15 years, more knowledge-intensive business functions have become eligible to
outsourcing. A very important enabling factor was the ICT revolution that substantially lowered the
information and communication costs between geographically dispersed business processes. This
made it much easier to outsource and co-ordinate knowledge intensive parts of in-house service
16 Examples are customer relations, marketing, management information systems, quality control, logistic management, R&D
functions, recruitment of top management, project management, invoicing, administrative organisation, human resource management, professional training, engineering, computer services and legal affairs.
-4 -2 0 2 4 6 8 10 12 14
Germ. 1978-85 Germ. 1986-89 Germ. 1990-95 Neth. 1977-80 Neth. 1981-85 Neth. 1986-98 UK 1979-83 UK 1984-89 UK 1990-98 USA 1977-84 USA 1985-89 USA 1990-97
activities. The BS sector has benefited from this process of structural change in a double way. Firstly,
the ICT revolution partly came from within the BS industry (software development and IT services).
And secondly because the surge in outsourcing created new business opportunities for other branches
in business services. The complexity of inter-sectoral and intra-sectoral division of labour also has an
international dimension through the rise of 'offshoring'. Particularly since the turn of the century we
witness a steep growth of international outsourcing of knowledge-intensive services for cost reasons
(Grossman and Rossi-Hansberg 2006; Baldwin 2006; Van Welsum and Vickery 2006). It gives rises
to new international trade flows in knowledge-intensive business services, or shortly: KIBS (Lesher
and Nordås 2006; Markusen and Strand 2007). To the extent that there are large scale economies
involved in co-ordinating the internationally dispersed knowledge-service activities we would expect
that the process goes along with an increase in the ratio between intra-company and arm’s length
trade in services. The specialisation by some knowledge-based firms is such that even the size of most
national markets is not even large enough for them. Sometimes, routinised elements within
knowledge services are further split up so that parts of the process can be done in less-developed
countries, benefiting from the wage-rate differences.
The increasingly complex social division of labour with regard to knowledge services allows several
types of product and process innovations, more knowledge specialisation, and better use of
specialised inputs. Scale bottlenecks with regarding knowledge-intensive specialisations at the firm
level become less relevant, as outsourcing makes it possible to benefit from external scale advantages
in these areas. A popular way of obtaining the most from advanced business-related services is the
combination of both in-house and external services. The expertise and specialist knowledge of
external KIBS firms can better be absorbed and optimised if the outsourcing firm also employs highly
skilled people.17
These structural changes give an impetus to aggregate economic growth with repercussions that go
beyond the BS sector. This can be illustrated on the basis of macro-economic production functions. A
macro-economic production function is a specific national production constellation, i.e. a particular
relation between sectors that together form the national economy. Alternatively, we may also view
this as a particular way in which the social division of labour in the economy is organised. Figure 2.7
plots two macro-economic production functions with on the vertical axis the total value added of all
industries, and on the horizontal axis the aggregated production inputs (like labour) used to produce
this value added.18
Initially, the relation between industries and sectors is reflected in macro-economic production
function 1. It represents all the production possibilities that are within reach by a certain state of
technology and by a given social division of labour between sectors. By using production inputs Fo it
yields value-added level Yo. By increasing the amount of production inputs to F1 value added grows
to Y1 as output shifts upwards from A to B along production function 1.
Now suppose that a technological breakthrough such as the ICT revolution, makes a new arrangement
of the relations between economic sectors possible, allowing for further division of labour, more
outsourcing possibilities and more use of specialised service inputs. In Figure 2.7, the new social
division of labour is represented by macro-economic production function 2. Note that at input size Fo,
it is not yet profitable to switch to production function 2; it takes more scale-size (amount of inputs)
to bring the efficiency benefits into reach.19 Structural change occurs when the production system
switches from production function 1 to production function 2, with a ‘jump’ from point B to point C.
With a given increase in factor inputs (∆F), a higher level of economic growth (namely ∆Y) becomes
[image:16.595.83.429.331.563.2]possible, thus attaining production level Y2.
Figure 2.7 Structural change and macro-economic growth potential
If there is indeed a positive relation between economic size and the role of the BS sector in the
inter-industry division of labour, we would expect to find a relatively larger BS sector in the larger and
more developed countries. In Figure 2.8 we plot a correlation between GDP per capita and the
employment share of the BS sector. The average values for the EU25 are used as the reference point
(index =100).
We indeed find the expected pattern, even within the Europe. EU member states with a low
income per capita all have a less developed BS sector, while in none of the richer countries we find a
low share of BS jobs. Countries like Portugal, Lithuania, Latvia or Slovakia are below 60 per cent of
19 E.g. Edwards and Starr (1987).
Value added (Y)
Fo F1
∆F
Production inputs (F) Y1
Y2
Y0
∆Y
A
B C
Macro-economic production function 2
the EU25 average. Luxemburg is an outlier. The correlation coefficient is 0.75 for the whole set of
30 countries presented here. It increases to 0.85 if Luxemburg is excluded from the sample. The
results imply no direction of causation, but we may infer that the development of the BS sector is
associated with a process of structural change in the economy as average income goes up.
There is a second interesting finding on the basis of this empirical analysis. The four quadrants of
the graph are derived from the EU25 average for both variables. If we confine us to the country
sample in the upper right quadrant of Figure 2.8, it appears that there is no longer a significant
correlation between GDP per capita and the employment share of the BS sector. This suggests the
existence of some threshold level in the relation between both variables. The correlation does not say
[image:17.595.126.441.319.554.2]anything about the direction of causality with regard to this threshold level.20
Figure 2.8 Correlation between GDP per capita and the share of business services in total employment
in Europe, 2000
Note: EU1 is the average for the EU15 countries and EU2 is the average for EU25. Data: Eurostat national account data for GDP, PPS (standardised PPP-purchasing power parity)
Input-output analysis provides further indications that the growth of the BS sector indeed reflects an
increasingly complex social division of labour between industries, and even within industries. Total
intermediate demand for business services is for an important share absorbed within the BS sector
itself (cf. Table 2.4). This pattern would be difficult to explain if the growth of the BS sector was
20 Either there is a level of BS employment beyond which income growth per capita depends on other factors, or there is a level of
income per capita beyond which economic wealth may be derived as well from BS as from other economic sectors.
20 40 60 80 100 120 140
20 40 60 80 100 120 140 160
EU2
No
Se Ch
Nl UK
Fi Ie
Dk
Fr Be
De EU1 At
It
Es Cy
Ee Hu
Share of employment in bus iness services EU25=100
GDP per inhabitant PPS EUR25=100
Sl
Cz Gr
Mt Pt
Sk
Pl Lt
Lv
Bg Ro
purely replacement growth. If the size differences between the sectors are taken into account, the BS
sector is the most intensive user of BS inputs.21 The vertical fragmentation and specialisation process
in the production chain translates itself into growing 'roundaboutedness’ of production, i.e. a higher
transaction density in the trajectory between primary inputs and the final good. The term
'roundaboutedness’ is derived from the neo-Austrian capital theory where it is regarded as a measure
of capital intensity (Hicks 1973).22 In our case it points more particularly to increasing human-capital
intensity with KIBS firms providing the intangible assets (know-how, software, organisational skills,
R&D capabilities etc.) that drive additional value creation in client firms.23 The growth of business
services since the 1990s reflects a different way of organising social production, allowing a better
spread of the advantages of knowledge specialisation, more external scale economies, and a
higher-level growth path. The key position of the business services industry in this process must go along
with high forward-linkage intensity: a one-unit increase in final demand in the economy will
necessitate BS industry to supply a more-than-average increase of intermediates to accommodate the
[image:18.595.79.485.395.599.2]economy-wide demand. Lesher and Nordås (2006) indeed find evidence for this in OECD countries.
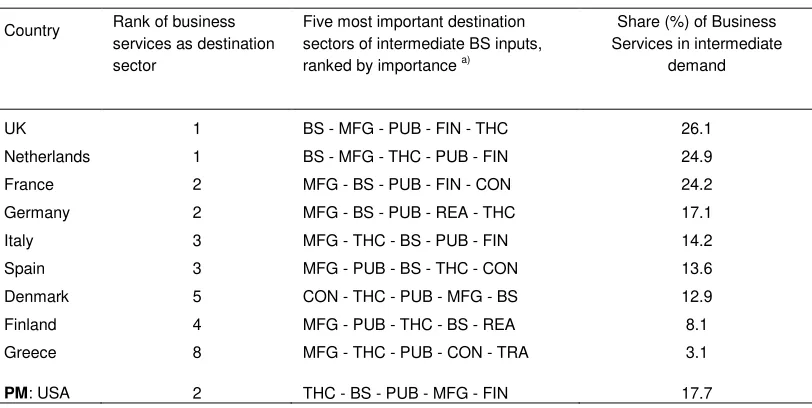
Table 2.4 Intermediate demand for BS inputs: ranking of the main destination sectors, selected countries, period 1994-1998
Country Rank of business services as destination sector
Five most important destination sectors of intermediate BS inputs, ranked by importance a)
Share (%) of Business Services in intermediate
demand
UK 1 BS - MFG - PUB - FIN - THC 26.1 Netherlands 1 BS - MFG - THC - PUB - FIN 24.9 France 2 MFG - BS - PUB - FIN - CON 24.2 Germany 2 MFG - BS - PUB - REA - THC 17.1 Italy 3 MFG - THC - BS - PUB - FIN 14.2 Spain 3 MFG - PUB - BS - THC - CON 13.6 Denmark 5 CON - THC - PUB - MFG - BS 12.9 Finland 4 MFG - PUB - THC - BS - REA 8.1 Greece 8 MFG - THC - PUB - CON - TRA 3.1
PM: USA 2 THC - BS - PUB - MFG - FIN 17.7
Note: a) The sector codes are: MFG: manufacturing; BS: business services; FIN: financial services; PUB: public sector; THC: trade, hotels and catering; TRA: transport and storage; CON: construction; REA: real estate. Source: The country data are based on the most recent IO table available in the OECD database over the period 1994-1998. OECD input-output tables; ECORYS-NEI (2004).
21 This is calculated by dividing a sector’s share in total intermediate demand for business services by the sector’s share in total
industrial output.
22 For this interpretation, see inter alia Grubel and Walker (1991); Grubel (1995) and Burda and Dluhosch (2000).
23 From an accounting point of view, expenditures on software and R&D are increasingly registered as investments rather than as
From the mid-1990s onwards the process of domestic outsourcing has gradually changed. Even
specialist and close-to-management service activities - that thus far were considered to be the core
company domains - became eligible for outsourcing. Typically, these were non-routine jobs.
Knowledge-intensive services with high skill inputs gained strongly in this most recent outsourcing
wave (cf. Miles 2007). Outsourcing of knowledge-intensive services went along with product
innovation and product differentiation, generating demand for specialised services products.
Sub-sectors that mostly produce client-specific business services have gained most since the mid-1990s.
The professional specialisation and the quality of knowledge inputs of knowledge-intensive business
services firms became a dominant reason for outsourcing in this stage (Kox 2002).
We may summarise the evidence so far. Leaving international outsourcing (offshoring) apart, the
available evidence suggests that trade creation is probably more important than displacement growth
(trade diversion) for explaining the domestic structural growth of business services. Business services
play a key role in the growing complexity and "knowledge roundaboutedness" of the social division
of labour.
2.3 Human-capital characteristics of BS employment growth
The increasing role of knowledge-intensive BS can be traced back in the human-capital composition
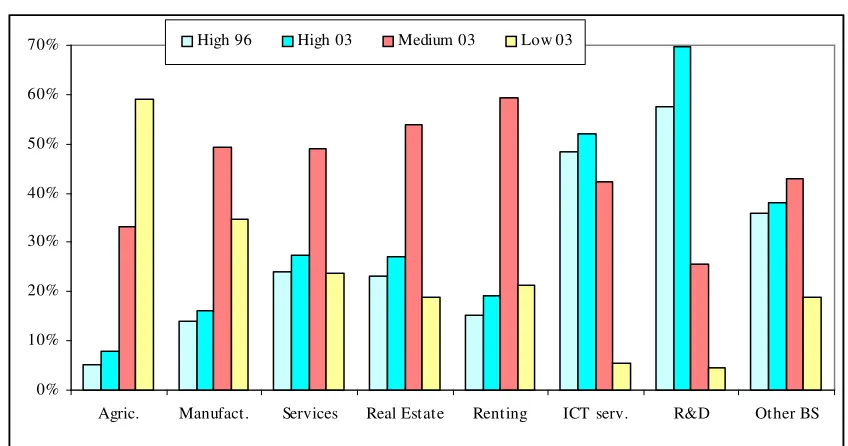
of the labour force in the European BS industry. Figure 2.9 shows that the sector has a very strong
orientation towards higher education, much more than most other industrial or service sectors. In
manufacturing and total services, the education profile is dominated by the intermediate educational
level, while there are more workers with low education levels, particularly in manufacturing.
The business services sector consists of equipment renting, ICT services, contract R&D and Other
Business Services. In computer services and R&D services, the share of highly educated people is
impressive, especially in R&D services. It is also high in Other Business Services despite the fact that
this aggregate includes sub-sectors like cleaning or security services, which employ many low-skilled
workers. Other Business Services represents most of the business services employment. In equipment
renting and real estate the educational profiles are similar to the total services average. In order to add
a time dimension, Figure 2.9 also pictures the employment share of highly educated workers in 1996.
In all economic sectors, the share of highly educated persons increased between 1996 and 2003. This
also holds for the BS sectors, even though BS already had a high education profile in 1996.
A further indication of the high educational profile in business services can be derived from the
percentage of BS enterprises that provides their workers with any type of training. It may reflect the
Figure 2.9 Education attainment levels in business services compared to other economic activities, EU15, 1996 and 2003
Source: Based on Eurostat data, Labour force Survey, 2004
Data: calculated on the basis of data from European Labour Force Surveys.
increasing organisational and work complexity. Data for 2000 from the European Labour Force
Survey indicate that in all EU15 countries, business services invests more in providing continuous
vocational training (CVT) to their workers than the average for the total economy. Moreover, it also
appears that the average costs of CVT courses are much higher in business services than in the rest of
the economy. This may reflect a higher level of specialisation and knowledge input in these courses.24
Summing up, BS jobs on average have a high profile of educational attainment levels and the
relatively strong importance of professional training in the sector.25 These finding supports the earlier
evidence on the role of BS industry in the inter-sectoral division of labour, especially in view of its
knowledge role.
2.4 "Offshoring" tendencies and BS replacement growth
Most outsourced services in the early 1980s were either low- or medium-skilled (cleaning, catering,
internal and external transport, building maintenance). From the mid-1980s until the late 1990s, many
24 We found strong differences among European countries in terms of the percentage of business services firms that use CVT
training for their employees. For example, the percentage of Spanish and Portuguese enterprises spending resources on training is less than 50% of their Dutch or Danish counterparts. In the countries where the percentage of enterprises providing courses is highest (Denmark, Ireland and Netherlands), also the training costs per course are highest.
25 We found only one other remarkable employment characteristic of BS compared to most other European sectors appeared to be
the high incidence of self-employment, especially in professional and knowledge-intensive business services. This is further analysed in Kox, Van Leeuwen and Van der Wiel (2007)
0% 10% 20% 30% 40% 50% 60% 70%
standardised in-house services became subject to outsourcing, including security services, training of
personnel, administration, storage, technical testing, computer services and recruitment. Especially
wage costs and scale effects derived from standardisation played a dominant role in this stage of
outsourcing. If replacement growth took place, it was probably most relevant in this period. Before
the turn of the century, almost all authors took for granted that outsourcing of in-house services from
manufacturing and other industries came to the benefit of domestic BS industry.26
ICT developments have since then lowered communication and co-ordination costs to such an
extent that international outsourcing of in-house services tasks has become more than an exotic
exception. Due to this development a new range of standardised in-house services can be sourced
from low-wage countries, including knowledge-intensive jobs of a standardised nature (cf. Van
Welsum et al. 2005, 2006). Offshoring of standardised services tasks to low-wage countries could
weaken the market position of domestic firms that produce standardised business services.27 If
anything, the offshoring tendency will therefore make the displacement-growth hypothesis less
relevant for explaining the structural growth of domestic business services in Europe.
At a national scale this process goes along with a change in the composition of the total labour force.
Figure 2.10 illustrates the shift away from routinised jobs that is taking place in the total labour force
of the USA. As more routinised manual jobs and standardised knowledge-intensive jobs are sourced
from low-wage countries this reduces the scope for future replacement growth by the domestic BS
industry smaller. An increasing part of the remaining jobs will be characterised by non-routinised
services tasks.28
Offshoring of routinised manual and cognitive BS jobs could in a way be regarded as a form of
prolonged replacement growth, although now in an international context. To the extent that offshoring
is done intra-company by BS firms, it may give rise to something new, namely vertical (i.e.
input-sourcing related) foreign direct investment in BS industry. Vertical direct investment till now used to
be something that is important in mining and manufacturing, but unimportant in services.
However, the offshoring process is getting increasingly differentiated. In the software sector, for
example, India’s computer-services exports are no longer restricted to routinised offshored software
jobs. Indian BS firms are actively involved in the management of complex automatisation processes
of European and US clients (e.g. Marsh 2007). Even in this area we can no longer speak of pure
replacement growth.
26 An exception was Feenstra and Hanson (1999) who also looked into the international dimensions of outsourcing.
27 Recent trends towards the offshoring of some business services such as call centres and ICT services have led to fears in the US
and Europe about the migration of jobs to low-wages countries like India. Some estimates say that more than two million jobs in the US and one million in Europe will move to developing countries (e.g. McCarthy 2002).
28 The issue has many interesting aspects from an international trade perspective (cf. Grossman and Rossi-Hansberg 2006; Baldwin
Figure 2.10 Trends in routine and non-routine task inputs in US labour force
Note: The picture is based on an analysis of the occupational structure, using census data and Current Population Survey data, using the mean 1960 task input structure as point of reference. Plotted variables depict the employment-weighted mean of each assigned percentile in the indicated year. Source: Autor, Levy and Murnane (2003).
2.5 Growth of European BS industry: conclusions
The BS sector has experienced a remarkably strong growth process in the past two decades, in terms
of both employment and value added. Business services nowadays count as one of the largest
economic sectors in the European economy, larger than such sectors as transport, communication,
hotels and restaurants taken together. The sector’s employment and value added account for,
respectively, 11 per cent and 12 per cent of the total EU15 economy. Value-added growth during last
two decades was higher than in any other sector except telecommunications. Regarding employment,
the growth of business services far outstripped the growth of any other sector. For European countries
we find a significant and strong positive correlation between the average income per capita and the
share of business services in total employment. This correlation holds up to some threshold level of
BS employment.
Traditionally, services were considered as relatively stable sectors, less sensitive to cyclical
fluctuations than agriculture and manufacturing. They served as refuge sectors in case of economic
crisis. Our analysis learns that the BS sector has a higher exposure to cyclical effects than most
services sectors, but there are also some compensatory characteristics. Moreover, the business-cycle
volatility may be different in various parts of the BS industry. The empirical analysis concludes that
40 45 50 55 60 65
1960 1965 1970 1975 1980 1985 1990 1995 2000
M
e
a
n
t
a
sk
in
p
u
t
in
p
e
rce
n
ti
le
o
f
1
9
6
0
t
a
sk
d
ist
ri
b
u
ti
o
n
Non-routine manual
Routine manual
the structural growth trend for the BS industry has until now dominated its relatively high cyclical
volatility.
Two main explanations stand out for the structural growth in the business services industry. Partly,
the growth may have been caused by outsourcing of existing in-house services jobs from other sectors
to BS industry, especially in the 1980s and in the early 1990s. Sub-sectors that produce standardised
business services contributed most to the growth process in this period. Since the mid-1990s, a shift
has occurred. The growth of business services especially reflects a growing complexity and
specialisation in the social division of labour between industries. In this stage, many
knowledge-intensive and non-routine services tasks became eligible for outsourcing to independent services
firms. However, this was seldom a simple substitution of pre-existing in-house services jobs.
Professional specialisation and product innovation often also caused the nature of the service product
to change. Since the mid-1990s, those sub-sectors that predominantly produce client-specific services
products contributed most to the structural growth of business services industry.
The recent tendency to 'offshore' some standardised services tasks from suppliers in low-wage
countries may weaken the market position of domestic firms that produce mainly standardised
business services. As a consequence, the displacement-growth hypothesis will become even less
relevant for explaining the present structural growth of business services in Europe. To the extent that
intra-company offshoring by BS firms grows, it may improve overall cost competitiveness and labour
productivity in European BS industry.
Business services jobs on average appear not have many special characteristics compared with other
economic sectors. There are two major characteristics of BS which can -to a certain extent- be
considered “special”. The first is the high incidence of self-employment, especially in professional
and knowledge-intensive business services. The second is the high profile of educational attainment
levels and the relatively strong importance of professional training in the sector. The importance of
know-how in business services is epitomised by the large number of enterprises providing their staff
with continuous vocational training courses, as well as the greater amount of resources used on such
3
The contribution of business services to European economic
growth
This section analyses the contributions of business services to aggregate economic growth in Europe.
The growth of business services represents a qualitatively new stage in the social structure of
production. A major characteristic of this structural change is that firm-level scale economies with
regard to knowledge and skill inputs are reduced by external deliveries of such inputs, thereby
exploiting external scale economies. It goes along with an increasingly complex social division of
labour between economic sectors. The share of knowledge-intensive services in the intermediate
inputs of the total economy has risen sharply in the last decade.
The business-services and communication sectors are in the focal point of the structural change. The
direct growth contribution of business-services industry arises from its own employment and
value-added growth. The indirect growth contribution stems from the positive spillovers that business
services create for other industries. The spillovers relate to the sector’s role in knowledge and
technology dissemination to client industries, and to its role in removing scale indivisibilities with
regard to knowledge inputs.
The structure of the section is the following. The first two sub-sections analyse, respectively, the
direct and indirect growth contributions of business services. The relatively poor labour-productivity
growth of business-services industry in combination with its expanded share in the total European
economy has evoked discussion whether this sector contributes to a growth stagnation tendency. The
third sub-section briefly deals with this so-called ‘Baumol disease’. The fourth sub-section gives a
brief survey of the empirical literature on the indirect growth contributions, and a final sub-section
summarises the conclusions.
3.1 The direct growth contribution of business services
The strong expansion of the BS sector over the past decade contributes in itself to aggregate economic
growth. We subsequently deal with the sector’s contribution to growth in terms of employment, value
added and labour productivity. Table 3.1 brings out that the sector has had a most prominent role in
inter-sectoral employment shifts during the last two decades. The BS industry on its own accounted
for more than half the EU’s net employment growth between 1979 and 2003. This was more than the
joint employment contribution of all other commercial services taken together.29 It was even larger
29 The absolute change in employment for financial services, transport, distributive trades, hotels and catering, communication
than employment growth in public services. Business services more than compensated the shrinking
employment in manufacturing.
The largest annualised growth rate within the business services was registered by the sub-sector
computer services. The latter started from a very small initial size in 1979, but nonetheless its
employment growth accelerated to 6.6 per cent in the second half of the 1990s (OECD 2003b).30
Over the entire period, knowledge-intensive business services (KIBS) and the rest of business
services (non-KIBS) have grown at about the same pace, with the employment-growth contribution of
[image:25.595.83.509.296.548.2]‘non-KIBS’ only being a little bit higher than the contribution of KIBS.31
Table 3.1 The contribution of business services to EU15 employment growth, 1979-2003
Employment in 1000 persons, 1979
Employ-ment in 1000 persons, 2003
Average annualised sectoral
growth rate (%)
Contribu-tion to aggregate growth (% point)
Contribution (%) to EU15 absolute employment change a)
7Business services 6 837 19 460 4.5 0.33 54.4
- Equipment renting 250 563 3.4 0.01 1.4 - Computer services 571 2 450 6.3 0.05 8.1 - Contract R&D 411 632 1.8 0.01 1.0 - Professional services 2 846 7 037 3.8 0.11 18.1 - Other, n.e.c. 2 759 8 778 4.9 0.16 26.0
Total all sectors 147 984 171 167 0.6 0.6 100.0
- Manufacturing 53 381 42 055 -1.0 -0.30 -48.9 - Distributive trades 20 993 25 943 0.9 0.13 21.4 - Financial services 3 976 5 392 1.3 0.04 6.1
PM
KIBS business services b)
3 828 10 119 4.1 0.17 27.1 Non-KIBS business services c) 3 009 9 341 4.8 0.17 27.3
Notes: a) Each industry’s absolute change in employment as percentage of the total employment change in the entire economy. b) The group of knowledge-intensive business services (KIBS) is here taken to consist of 'Computer services', 'Contract R&D', and ‘Legal, technical, accountancy, advertising’. c) Non-KIBS business services is here taken to consist of 'Equipment renting' and 'Other, n.e.c.' Sources: data are from OECD National Accounts data (STAN), extended with data from GGDC.
30 Over the period 1995-2000, OECD-area employment in computer services grew by more than 3 million, equalling an annual
growth rate of over 4.3%, more than three times that of overall market-sector employment (OECD 2003).
31 The distinction between knowledge-intensive business services and other business services is not a sharp one. All sub-sectors in
Measured in constant prices, the value-added growth between 1979 and 2003 was stronger in business
services than in any other economic sector of the European economy, except for communication
services (cf. Table 3.2). Within business services, computer services registered the strongest growth
performance, while the weakest growth occurred in contract R&D. The ‘non-KIBS’ part of business
services grew slightly faster than the KIBS part.
The contribution of BS to the absolute change in total value added was much smaller than its
contribution than in terms of employment growth. About one-eight of the overall EU15 change in
value added was accounted for by business services. Two-thirds of this direct growth contribution
stemmed from the KIBS, which is mainly explained from the fact that its 1979 share in value added
[image:26.595.83.508.326.587.2]was already larger than the ‘non-KIBS’ part.
Table 3.2 The contribution of business services to value-added growth, 1979-2003
Value-added
level in billion euros,d)
1979
Value -added level in billion euros,d)
2003
Average annualised sectoral
growth rate (%) e)
Sector contribution to aggregate growth (% point)
Contribution (%) to EU15
absolute value-added change a)
Business services 122.9 1067.4 4.2 0.28 12.7
- Equipment renting 10.8 90.3 5.0 0.02 1.1 - Computer services 12.4 182.7 6.6 0.05 2.3 - Contract R&D 7.0 36.7 2.4 0.01 0.4 - Professional services 59.7 472.0 3.8 0.12 5.6 - Other, n.e.c. 33.0 285.7 3.9 0.08 3.4
Total all sectors 2124.0 9540.1 2.2 2.2 100
- Manufacturing 804.1 2515.9 2.2 0.51 23.1 - Distributive trades 218.5 936.6 2.3 0.22 9.7 - Financial services 103.7 576.4 2.5 0.14 6.4
PM
KIBS business services b) 79.1 691.4 4.1 0.53 8.3 Non-KIBS business services c) 43.8 376.0 4.4 0.29 4.5
The direct contribution of BS to the growth of aggregate productivity is implied by the two preceding
tables.32 Productivity growth is defined as the growth of real value added per employed person,
expressed in constant prices of 1995. This definition counts persons, not hours worked; it could
therefore underestimate the productivity growth if the share of part workers grows over time. In Table
3.3 we see that the direct contribution of business services to EU15 productivity change has been
negative over the 1979-2003 period. The reason is that the employment in business services has
grown faster than its value added did. The negative productivity contribution is entirely caused by the
non-KIBS part of business services, and more particularly by the sub-sector 'Other, not elsewhere
classified'. This residual category includes inter alia, industrial cleaning, security services, call
centres, packaging firms, and agencies for temporary labour. Branches like call centres and industrial
cleaning tend to employ many part-time workers, and especially call centres form a relatively young
activity. So, a growing share of part-timers could in this case lead to underestimation of real
[image:27.595.82.510.355.577.2]productivity growth (per hour worked).
Table 3.3 The contribution of business services to EU15 labour productivity growth, 1979-2003
Producti- vity level in euros, curr. prices 1979*
Producti- vity level in euros, curr. prices 2003*
Labour productivity level 2003 based on constant 1995 prices a)
Average annualised growth rate in constant prices (%)
Sector share (%) in EU15 growth of aggregate in productivity d)
Business services 17 976 54 851 16777 – 0.3 – 0.023 of which:
- Equipment renting 43 200 160 391 62450 1.6 0.012 - Computer services 21 716 74 571 23236 0.3 0.003 - Contract R&D 17 032 58 070 19611 0.6 0.002 - Professional services 20 977 67 074 20977 0.0 0.000 - Other, n.e.c. 11 961 32 547 9504 – 1.0 – 0.021
Average Total EU15 economy 14 353 55 736 20961 1.6 1.600
PM: KIBS b)
20 664 68 327 20664 0.0 0.000 Non-KIBS business services c)
14 556 40 253 13280 – 0.4 – 0.012
Notes: a) Using 1979 productivity levels as starting values and calculating on the base of the value-added growth rate in constant 1995 prices. b) The group of knowledge-intensive business services (KIBS) is here taken to consist of 'Computer services', 'Contract R&D', and ‘Legal, technical, accountancy, advertising’. c) Non-KIBS business services is here taken to consist of 'Equipment renting' and 'Other, n.e.c.' d) Employment weighted. Sources: calculated on the basis of data in Tables 3.1 and 3.2.
32
If H1979 is initial labour productivity in 1979, then H2003 is defined as: H1979
.
(1+gVA)n.
(1+gEMP)–n where gVA and gEMP are,respectively, the growth perunages for value added and employment, and n is the number of years (24 in this case). Note that gVA