Volume 109 – No. 3, January 2015
A Methodology for Sketch based Image Retrieval based
on Score level Fusion
Y. Jhansi
Assistant ProfessorDepartment of Information Technology GITAM University
E. Sreenivasa Reddy
Professor and DeanDepartment of Computer Science and Engineering ANU College of Engineering, ANU
ABSTRACT
Retrieving sketches to match with a hand drawn sketch query is highly desired feature. This paper proposes a novel methodology for efficient retrieval of sketch based images. This system extracts features from the query sketch, HOG and GMM features are used and these features are combined using score level fusion which can match user drawn sketch with database sketches efficiently. The methodology is tested on bench mark images and the performance evaluation is carried out using metrics like Precession and Recall. The results derived are tested for efficiency against models based on HOG and GMM.
Index Terms
HOG, GMM, Sketch based images, fusion, performance evaluation.
1. INTRODUCTION
Due to the latest technological updates, the usage of e-classes and touch based smart computing devices has increased. This e-classes and touch based smart computing devices provide a user friendly interface with a natural way to input the users request in the form of sketches and helps in retrieving the relevant sketch based images from a large database. Content Based Image Retrievals, has become one of the prominent research topics in the area of digital image processing. The existing search engines, try to retrieve the images of interest mostly based on the textual information. These systems lag in performance. The goal of CBIR is to dig out visual content of an image mechanically, like color, texture, or shape. In general, it is much easier for an individual to sketch the main feature lines of a shape or scene. This might be connected to how humans think of and memorize objects. Binary sketches can be easily drawn using devices, such as mouse or touch screens in the modern touch screen devices. This is similar to handwritten recognition, wherein, the hand written recognition deals with only limited set of alphabets.
Each sketch in a database is a collection of strokes [3,4,5,6] and the retrieval is as equivalent to finding a stroke or multiple strokes from the database that matches with the query strokes. In this method, a novel system, was proposed, where instead of comparing multiple strokes based on geometric shapes, a fusion based approach is considered by taking histogram of gradients (HOG), which count the occurrences of gradient orientation in localized portions of a sketch and Probability density function of Gaussian mixture model is also considered for identifying the pattern of the pixels inside the sketch image. These two models are capable of considering the problem of dimensionality by eliminating redundant features and reducing the feature space. These individual models are combined at matching score level using sum of scores technique in which the normalized matching scores of different methods are summed to generate a final
matching score and is presented in section 3.3 of the paper. The evaluation of the proposed system is carried out on TU-Berlin sketch dataset of hand-drawn sketches.
The rest of the paper is organized as follows: section 2 of the paper presents the related work. In section 3, proposed methodology is stated, the experimental results derived are presented in section 4 and in the concluding section 5 of the paper, the results derived along with the future work is presented.
2
.
RELATED WORK
Early works on sketch focus on retrieving object images in a large database, descriptors based on edge pixels are proposed for indexing and matching sketches [1]. In [11] Anoop et al (2004) proposed an on-line hand drawn sketch matching algorithm based on a line based representation of sketches, in which a sketch is divided into smaller units and in the matching stage the sketches are compared based on their global properties and the properties of the individual portions of the strokes in the two sketches. Wing Ho et al.[3,6] proposed a method to retrieve hand drawn sketches stored in the form of multiple strokes, by extracting the shape information for each stroke and by considering the geometric relationship between the strokes. But this is limited for only some shapes so less effective for complex shapes. Eitz et al. [7] introduced a grid based approach for shape retrieval, dividing the image into regular grids and locate photos using sketched depiction of object shape. Descriptors from each cell were concatenated to form a global image feature. However, this offers limited invariance to changes in position, scale or orientation. Kai-Yu Tseng et al.[12] focused on the idea of SBIR for mobile devices. This approach also splits the image edges in six orientations. Then, they applied to each edge orientation map, the Distance Transform (DT). Later, high-dimensional DT features are projected in a compact binary hash. The authors affirmed that the retrieval performance is competitive to [1] and requires only 3% of the memory storage comparing to EI. Chaoma et al.[Sketch retrieval via dense strokes] used sketch strokes into account with local features and retrieval done by using codebooks, in this methodology, most of the significant data is lost in the form of outliers.
Volume 109 – No. 3, January 2015
3.
PROPOSED METHODOLOGY
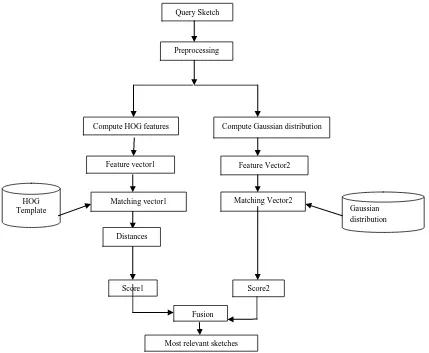
The overall framework of the proposed system is illustrated in Figure 1, in which similar sketches can be retrieved via user-drawn sketches from a large dataset. In the preprocessing stage all the sketches in database are normalized to 256× 256 size, the purpose of normalization is to explore all the sketches to be of same size. For all sketches in database, features are extracted using HOG and probability density function of Gaussian mixture model and the obtained feature
[image:2.595.88.517.175.528.2]space is stored in the respective feature template database. When a query sketch is selected, its feature space will be compared with those in the feature templates one by one and the similar sketches with smallest feature distance and the PDF of the query image is mapped to that of the PDF of the images in the database using KL-Divergence. Score level fusion integrates matching scores which are from HOG and Gaussian distribution to new scores. The relevant sketches are retrieved based on the score level.
Figure 1 Architecture of the system
3.1
Histogram of Gradients
The histogram of gradient (HOG) descriptor is a commonly used feature descriptor in particular for object detection [15]. The basic idea of HOG, counts the occurrences of gradient orientation in localized portions of a sketch. In this method we extract Histogram of Gradient Orientation (HOG) features and these features will be used for similarity measurement.
The essential thought behind HOG descriptors is that local object appearance and shape within an image can be described by the distribution of intensity gradients or edge directions. The implementation of these descriptors can be achieved by dividing the sketch image into small connected regions called cells and for each cell compiling a Histogram of gradient directions or edge orientations for the pixels within the cell. The combination of these histograms then represents the descriptor.
3.1.1
Algorithm Implementation
1. Compute the dense gradient field G from a sketch image I by using the formula
i. θ=arctan(Iy/Ix) (1) where Ix=I×Dx and Iy=I×Dy
2. Divide the sketch image I into n×n grid cells evenly.
3. Compute the histogram of gradients with d (d=9) orientations in each cell using:
a. Cos(x-αi)3>0 (2)
where x denotes the gradient orientation weighted by its magnitude, and αi denotes the i-th bin center.
4. Group the cells together into larger, spatially connected blocks and return a descriptor for each cell.
Query Sketch
Compute HOG features Compute Gaussian distribution
Feature vector1 Feature Vector2
Matching vector1 Matching Vector2
Distances
Score2 Score1
Fusion HOG
Template Gaussian
distribution Template Preprocessing
Volume 109 – No. 3, January 2015 5. Store these descriptors as feature vector in the
database.
3.1.2
Similarity Measure
To estimate the distance between the feature of query and database sketch images. Euclidean distance is used,
which is given by
𝑑 = (𝑥𝑛𝑖=1 𝑖 − 𝑦𝑖)2 (3)
where X ,is the feature vector of query image; Y is feature vector of database images.
3.2 Gaussian Mixture Model
Gaussian mixture model(GMM)[16] is a symmetric distribution which assumes the shape of the pixels in the given sketch image as symmetric. The probability density function of GMM is given by
𝑓 𝑥, 𝜇, 𝜎 = 1
𝜎 2𝜋𝑒
−(𝑥−𝜇 )2
2𝜎2 (4)
Where x is a sketch image,𝜇 𝑎𝑛𝑑 𝜎 are mean and variance of the distribution,0≤µ≤∞ and it assumes that each pixel in the entire sketch image follows a random phenomena and gets distributed evenly between the ranges−∞ 𝑡𝑜 ∞.
In this paper the choice of Gaussian mixture model is made on the assumption that the objects under consideration are symmetric.
3.2.1 Kullback-Leibler (KL) divergence
In order to compare two probability density functions (pdf’s) one need to use methodologies like KL-divergence[17], Kolmogorov complexity [22 ].In this paper KL-divergence is used, For each sketch image in the database pdf’s are extracted using equation(4) as features and stores in a template database .The pdf of query sketch is compared to template database using Equation(5). If P and Q are query sketch and sketch from database, p and q are their probability density functions of query sketch and sketch in database, the KL-divergence is defined to be
D(P║Q)= 𝑝 𝑥 𝑙𝑜𝑔−∞∞ 𝑄 𝑥 𝑝 𝑥 𝑑(𝑥) (5)
Where D(P║Q)≥0 and it is zero if and only if P= Q.
3.3 Score Level Fusion
Score level fusion is the fusion in matching score level. For this reason, it is also called matching level fusion [13].
Different matching scores got by different classifiers can be fused to match at this level. For the database images (training set) all the features are calculated using HOG and Gaussian distribution. Now for recognizing any query image, these algorithms first extract the features and then an individual comparison algorithm for each recognizer compares the set of features and calculates the matching scores corresponding to each recognizer. These matching scores are then normalized to a common scale followed by conversion from distance to similarity and fusion to a single score. Thus the procedure begins with the normalization of the scores. The min-max normalization scheme[14,23] is used to normalize the score to a common range i.e., between 0 and 1.Given a set of matching distance of HOG { d k} k=1, 2, 3…, n, the normalization scores are given by,
min
max
min
Kk
d
S
(6)
Where {dk} is the HOG matching distance, sk is the HOG matching score after normalization, in and max are the minimum and maximum values of {dk } respectively. Then, these weighted score corresponding to each matching result (classifier) are combined at matching score level using sum of scores technique.
2
2
1
S
S
S
comb
(7)
Where s1 and s2 are HOG matching score and GMM matching score, S is the fusion score and using the distance measures to the obtained fusion score relevant sketches are retrieved.
4. EXPERIMENTAL RESULTS
The developed model is tested using real time dataset of TU Berlin Sketch Data Set consisting 20,000 sketches representing 250 different objects (each object has 80 different sketches) among which 800 images are considered for training purpose. For testing purpose, about 80 images are considered from the dataset. The prototype system is implemented in MATLAB R012a. In first experiment, the individual features are tested and the accuracy of each recognizer is computed independently. In another experiment, the two classifiers are combined at matching score level. Results derived are presented in fig 2.
Query
Volume 109 – No. 3, January 2015
Figure 2 Top 10 results returned from our system for sample query sketches
4.1 Performance Evaluation
In order to evaluate the proposed system, metrics like precision and Recall are used. The formulas for calculating are presented in sections 4.1.1 and 4.1.2. The methodology is tested for accuracy based on other models that is HOG and GMM.The results derived are tabulated and are presented in Table-1.
4.1.1 Precision
It is also referred as positive predictive value and determines the fraction of records that truly turns out to be positive in the group which has been declared as positive class by the classifier.
fp
tp
tp
precision
(8)
4.1.2 Recall
It calculates the original members of the class which are correctly identified as true. It is also referred as True Positive Rate (TPR) or sensitivity. It is defined as the fraction of positive examples predicted correctly by the classification model.
tp
fn
tp
recall
(9)
Table 1 precision and recall values for 8 categories of sketches.
GMM HOG FUSION of HOG and
GMM
Query Sketch
Prec ision
Rec all
Precisi on
Rec all
Precisi on
Rec all
1 Bicycle’s 26.6 10 60 22.5 73.33 27.5
2 Airplane’s 40 15 80 30 86.6 32.5
Buses’ 26.6 10 73.33 27.5 86.6 32.5
4 Umbrella’ s
33.3 12.5 80 30 86.6 32.5
5 Banana’s 73.3 27.5 93.33 35 93.33 35
6 Car’s 80 30 86.6 32.5 93.33 35
7 Apple’s 60 22.5 100 37.5 100 37.5
8 Flower’s 80 30 93.33 35 100 37.5
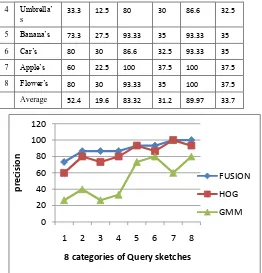
Average 52.4 19.6 83.32 31.2 89.97 33.7
Figure 3 Precision comparisons with HOG and GMM
5. CONCLUSION
This paper presents a methodology for sketch based image retrievals based on score level fusion which integrates matching scores from HOG and Gaussian distribution to new scores. The recall and precision values for some sample query sketch images are computed for HOG and GMM individually and these individual models are combined at matching using score level fusion. The results obtained are presented in Table-1. The average precision and recall values are good for proposed methodology compared to individual HOG and GMM. The percentage of returning similar sketch images is nearly 90% for this methodology. The precision of the top 15 search results for 8 sample query sketches is shown in fig
0 20 40 60 80 100 120
1 2 3 4 5 6 7 8
p
re
ci
si
o
n
8 categories of Query sketches
FUSION
HOG
[image:4.595.308.570.324.597.2]Volume 109 – No. 3, January 2015 identifying a criminal from the criminal database where the
images are generated by the narration of the witness.
6. REFERENCES
[1] Y.Cao, C.Wang, L.Zhang and L.Zhang, “Edgel Index for Large-Scale Sketch Based Image Search”. In CVPR, pages 761- 768, 2011.
[2] R.Hu, M.Barnard and J.Collomosse, “Gradient Field Descriptor for sketch based and Localization”. In ICIP, pages 1025- 1028, 2010.
[3] W.H.Leung and T.Chen, “User –independent retrieval of free-form hand-drawn sketches”. In Proc.of IEEE ICASSP,vol. 2,pp.2029-2032, may 2002.
[4] Chao Ma,Xiaokang Yang,Chongyang Zhang, Xiang Ruan, Ming-Husan Yang, “Sketch retrieval via dense strokes”, In BMVC(2013).
[5] M.Eitz, R.Richter, T.Boubekeur, K.Hildebrand and M.Alexa, “Sketch-Based Shape Retrieval”. In SIGGRAPH (2012).
[6] Wing Ho Leung and Tsuhan Chen, “Retrieval of Hand Drawn Sketches with partial matching”, Acoustics, Speech and signal processing, 2003, Proc (ICASSP’03), IEEE International conference vol.3 pages III 5-8.
[7] Mathias Eitz, Kristian Hildebrand, Tamy Boubekeur and Marc Alexa, “A descriptor for large scale image retrieval based on sketched feature lines”, In proc.The sixth Eurographics symposium on sketch based interfaces and modeling, New Orleans, pp.29-36, Aug 2009.
[8] Datta.R, Joshi D, Jia Li and James Z.Wang, “Image retrieval: Ideas, influences and trends of the New Age”, In ACM computing Surveys 40,2(2008),1-60.
[9] M. Eitz, K. Hildebrand, T. Boubekeur and M. Alexa, “An evaluation of descriptors for large-scale image retrieval from Sketched feature lines”, in Computers & Graphics, 2010.
[10]Chalechale .A,Naghdy G,Mertins A, “Sketch –based image matching using angular partitioning”,IEEE Transactions on systems,Man and Cybernetics, Part A 35,1(2005).
[11]Anoop M.Namboodri,Anil K.Jain, “Retrieval of On- line Hand-Drawn Sketches” ,In ICPR’04 Proc.of pattern recognition Vol 2.pages 642-645.
[12]Kai-Yu Tseng, Yen-Liang Lin, Yu-Hsiu Chen, Winston H.Hsu, “Sketch-based image retrieval on
mobile devices using compact hash bits”,proc.of the 20th ACM international conference on multimedia, 2012 pages 913-916.
[13]Feifei CUI, Gongping YANG, “Score level Fusion of Fingerprint and Finger vein Recognition”, Journal of Computational information systems 7:16(2011)5723-5731.
[14]A.K.Jain,K.Nandakumar,A.Ross,“Score normalization in multimodal biometric systems”,In pattern recognition ,vol. 38,no. 12,pp. 2270-2285,2005
[15]N.Dalal and B.Triggs ,”Histogram of Oriented gradients for human detection”,In CVPR,pages 886- 893,2005.
[16]Z.Robotka and A.Zempleni, “Image retrieval using GaussianMixtureModels”,Annals Univ.Sci.Budapest, Sect.Comp,vol.31,(2009),pp.93-105.
[17]Jacob Goldberger, Shiri Gordon, Hayit Greenspan, “An efficient Image similarity Measure based on a Approximations of KL divergence Between Two Gaussian Mixtures”,In proc. of ICCV 2003, Nice, October 2003,vol.1,pp.487-493.
[18]Vedaldi and B.Fulkerson.VLFeat: An open and portable library of computer vision algorithms. http://www.vlfeat.org/,2008.
[19]L.Zhang., F.Lin., and B.Zhang. “Support vector machine learning for image retrieval”. Proc. IEEE Int. Conf. on Image Processing, vol. 2, pp. 721-724, 2001.
[20]J.Li, Amir Najmi., and Robert M.Gray. “Image classification by a two-dimensional hidden Markov model”. IEEE Transactions on Signal Processing, 48(2),517-533,Feb 2000.
[21]S. Hussain, “Image Retrieval Based on Color and Texture Feature Using Artificial Neural Network”, In Emerging Trends and Applications in Information Communication Technologies, pp. 501-511, 2012.
[22]N.Nikvand and Z.Wang, “Generic image similarity based on kolmogorov complexity”, In IEEE International Conference on Image processing(ICIP), 2010 pp. 309-312.