http://dx.doi.org/10.4236/msce.2016.41013
Evaluation of Surface Roughness of Metal
and Alloy Material
Joon-Seong Lee
Department of Mechanical System Engineering, Kyonggi University, 154-41, Gwanggyosan-ro, Yeongtong-gu, Suwon 16227, Republic of Korea
Received 26 October 2015; accepted 5 January 2016; published 11 January 2016
Abstract
Turning clearance angle is changed machining characteristics. In this study, the experiments start from choosing two workpiece materials that are machine structural carbon steel, chrome-molyb- denum steel. Then, the experiments show specifically how features of selected materials changed when they were processed with machining operation. In order to find the surface roughness of workpiece materials, the workpiece materials which have higher tensile strength showed much better value of surface roughness in a surface roughness tester. Moreover, process feed rate was compared between 0.05 mm/rev and 0.10 mm/rev. When process feed rate was 0.05 mm/rev, surface roughness has superior results without reference to the quality of the materials.
Keywords
Surface Roughness, Feed Rate, Clearance Angle, Metal, Alloy
1. Introduction
2. Surface Roughness
Surface roughness in this study means measured value in irregularities parts having been collected voluntarily from the surface of measuring objects, and has very close relation with accuracy on surfaces of the objects. As measuring methods on surface roughness, there are comparative measuring method by comparing with average deviation, stylus trace method, and light sectioning method.
For the parameter which evaluates surface roughness with values, the author intend to use 3 kinds of measur-ing methods includmeasur-ing (μm) as unit, (Rmax) as maximum height of roughness curve, (Ra) as arithmetic mean roughness, and (Rz) as ten point average roughness.
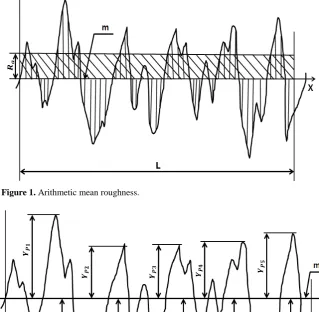
In the surface roughness curve at Figure 1, arithmetic mean roughness (Ra) sets X-axis to the direction of av-erage line in the sample parts, Y-axis to the direction of vertical scale after pulling up standard length to direc-tion of the average line, and curve is shown like y = f(x), and its value could be marked same as Equadirec-tion [4].
[image:2.595.153.473.297.609.2]Regarding ten point average roughness (Rz), it is marked with two lineal distances by drawing average line which passes through 5th bottom point together with average roughness value which is calculated to 5th highest positions within sampled standard length from the roughness curve. Figure 2 shows calculating methods on ten point average roughness, and its value can be marked like Equation [4].
[image:2.595.146.479.468.697.2]Figure 1. Arithmetic mean roughness.
3. Processing and Measuring Equipment
Roughness testing machine (Model: Kosaka SE-3500) displayed specifications of measuring equipment and its shape at Table 1 and Figure 3. By scratching the measuring face with a detector, and enlarging it with electric, mechanical, and optical methods, result values of the roughness are shown through a printer, and this study did an experiment after adopting this method.
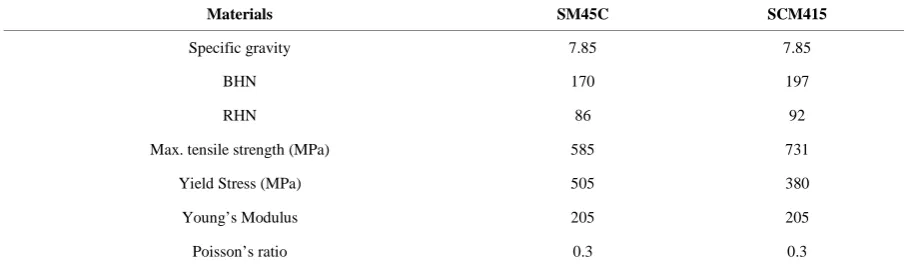
[image:3.595.167.462.236.399.2]After coding CNC data for basic processing on used experimental materials, and doing coding work for finish processing by each material again, I intended to get experimental datum. Table 2 displays mechanical properties on selected experimental materials. In order to produce a specimen which will be used in practical research and measurement, processing conditions for specimen should be decided. Processing depths on 2 kind of materials such as SM45C, SCM415 were decided to 0.1 mm, 0.2 mm, 0.3 mm, and feed rates according to processing were set to 0.05 mm./rev and 0.10 mm/rev respectively.
[image:3.595.84.539.450.552.2]Figure 3. Stylus type surface roughness tester.
Table 1. Kosaka SE-3500 specifications.
Model Contents
Type KOSAKA SE 3500
Standards JIS, DIN, ISO, ASME
Measuring
Range Z: 600 μm X: 100 mm
Magnification Z: 50 - 500,000 X: 1 - 5000
Speed 0.5 - 2 mm/s
Table 2. Material properties.
Materials SM45C SCM415
Specific gravity 7.85 7.85
BHN 170 197
RHN 86 92
Max. tensile strength (MPa) 585 731
Yield Stress (MPa) 505 380
Young’s Modulus 205 205
[image:3.595.86.540.581.715.2]4. Experimental Results
4.1. Roughness Comparison by Materials
This experiment compared and analyzed arithmetic mean roughness and ten point average roughness values by exempting roughness value of the highest height. Of course, as a result of having compared the highest height and ten point average roughness values, the value was shown same without any unerring.
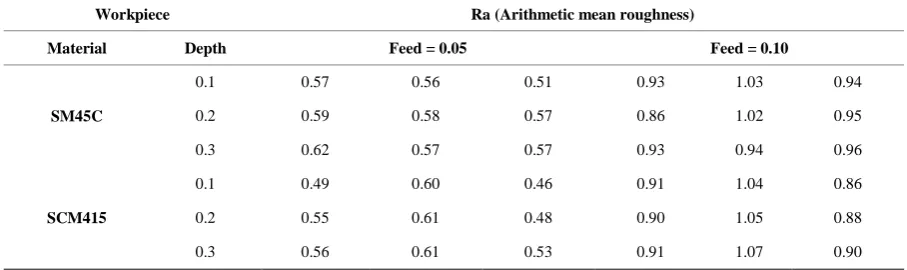
As a result of comparing roughness values by materials first, Table 3 is measured result values on arithmetic mean roughness (Ra) by processing depth of each material. Based on this value, result values like feed = 0.05, 0.01 mm/rev is marked together. If looking into this picture, several results can be gotten same as follows.
First, as a result of confirming result values on arithmetic mean roughness (Ra) by materials with sequential summing method as shown in Table 4, a fact was confirmed such like most good roughness value came out from SCM415 and next from SM45C.
Second, as a result of comparing surface roughness based on processing speeds only after excluding cutting degree angles, SM45C showed most bad roughness among 2 kind of materials like SM45C →SCM415 in order when the feed rate was 0.05mm/rev, and a fact was confirmed same as SM45C → SCM415 in order when the feed rate was 0.10 mm/rev.
[image:4.595.153.483.330.537.2]Third, when comparing and observing arithmetic mean roughness by integrating totally by materials like Figure 4, a fact could be known that roughness values are shown apparently according to feed rates, and the roughness value becomes well as much as the feed rate is low.
[image:4.595.125.529.332.688.2]Figure 4. Ra on different materials
Table 3. Measurement data of Ra.
Workpiece Ra (Arithmetic mean roughness)
Material Depth Feed = 0.05 Feed = 0.10
SM45C
0.1 0.57 0.56 0.51 0.93 1.03 0.94
0.2 0.59 0.58 0.57 0.86 1.02 0.95
0.3 0.62 0.57 0.57 0.93 0.94 0.96
SCM415
0.1 0.49 0.60 0.46 0.91 1.04 0.86
0.2 0.55 0.61 0.48 0.90 1.05 0.88
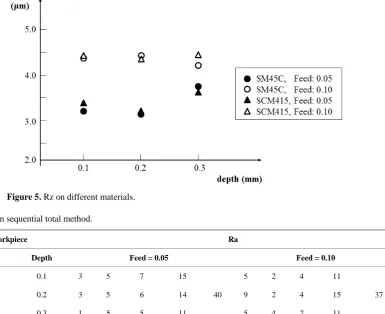
[image:4.595.86.540.583.718.2]Next, Table 5 is a result value by measuring ten point average roughness (Rz) of each material by processing depths. When comparing this result together, it showed like Figure 5. When seeing this result, other result value differently from arithmetic mean roughness (Ra) could be gotten.
First, as a result of confirming with same methods as above, results like arithmetic roughness (Ra) such like SCM415 → SM45C were confirmed if reviewing the most good result values in order at Table 6.
Second, if looking into the processing speed by standards only, same results in order of SCM415 → SM45C were confirmed when feed = 0.05 mm/rev and 0.10 mm/rev, and characteristics by material were confirmed definitely from the result.
If summarizing above two article results, there were a little differences in values as a result of doing a com-parative analysis on arithmetic mean roughness and ten point average roughness values, but a fact could be known that it came out in order of SCM415 → SM45C equally.
4.2. Roughness Comparison by Angle
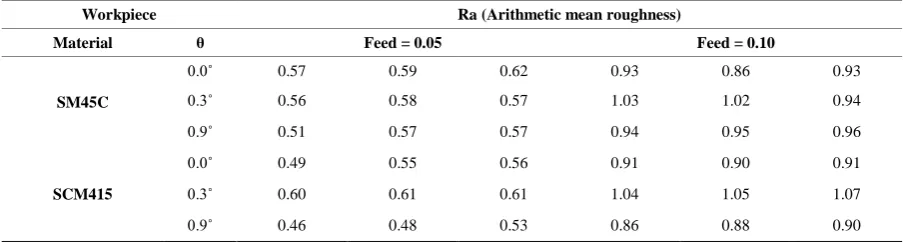
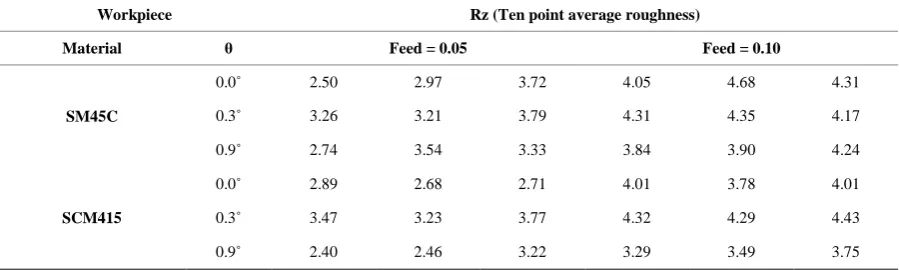
The author tries to compare and analyze Ra and Rz values by dividing surface roughness by each angle having been measured after processing like Table 7 and Table 8.
[image:5.595.137.523.341.655.2]After laying the seat which is the tip support in insert holder, a cutting tool as it is, and if seeing processed state, that is, 0.0˚ negative slope angle, comparison state on material roughness set like −6.3˚ and −6.9˚ was di-vided to two kinds such as Ra and Rz, and researcher displayed them to Figures 6-9 after arranging the datum by angle standards and angles.
Figure 5. Rz on different materials.
Table 4. Ra on sequential total method.
Workpiece Ra
Material Depth Feed = 0.05 Feed = 0.10
SM45C
0.1 3 5 7 15
40
5 2 4 11
37
0.2 3 5 6 14 9 2 4 15
0.3 1 5 5 11 5 4 2 11
SCM415
0.1 8 1 9 18
54
6 1 9 16
45
0.2 8 1 9 18 5 1 8 14
[image:5.595.86.536.569.721.2]Figure 6. Ra of SM45C on angle.
Figure 7. Ra of SCM415 on angle.
[image:6.595.165.472.386.696.2]Figure 9. Rz of SCM415 on angle.
Table 5. Measurement data of Rz.
Workpiece Rz (Ten point average roughness)
Material D Feed = 0.05 Feed = 0.10
SM45C
0.1 2.50 3.26 2.74 4.05 4.31 3.84
0.2 2.97 3.21 3.54 4.68 4.35 3.90
0.3 3.72 3.79 3.33 4.31 4.17 4.24
SCM415
0.1 2.89 3.47 2.40 4.01 4.32 3.29
0.2 2.68 3.23 2.46 3.78 4.29 3.49
[image:7.595.88.540.459.570.2]0.3 2.71 3.77 3.22 4.01 4.43 3.75
Table 6. Rz on sequential total method.
Workpiece Rz (Ten point average roughness)
Material D Feed = 0.05 Feed = 0.10
SM45C
0.1 8 2 7 17
36
4 2 6 12
32
0.2 7 3 1 11 1 2 6 9
0.3 3 1 4 8 3 4 4 11
SCM415
0.1 6 1 9 16
51
5 1 9 16
53
0.2 8 2 9 19 8 3 9 20
[image:7.595.87.539.600.721.2]0.3 9 2 5 16 7 1 9 17
Table 7. Measurement data of Ra on angle.
Workpiece Ra (Arithmetic mean roughness)
Material θ Feed = 0.05 Feed = 0.10
SM45C
0.0˚ 0.57 0.59 0.62 0.93 0.86 0.93
0.3˚ 0.56 0.58 0.57 1.03 1.02 0.94
0.9˚ 0.51 0.57 0.57 0.94 0.95 0.96
SCM415
0.0˚ 0.49 0.55 0.56 0.91 0.90 0.91
0.3˚ 0.60 0.61 0.61 1.04 1.05 1.07
Table 8. Measurement data of Rz on angle.
Workpiece Rz (Ten point average roughness)
Material θ Feed = 0.05 Feed = 0.10
SM45C
0.0˚ 2.50 2.97 3.72 4.05 4.68 4.31
0.3˚ 3.26 3.21 3.79 4.31 4.35 4.17
0.9˚ 2.74 3.54 3.33 3.84 3.90 4.24
SCM415
0.0˚ 2.89 2.68 2.71 4.01 3.78 4.01
0.3˚ 3.47 3.23 3.77 4.32 4.29 4.43
0.9˚ 2.40 2.46 3.22 3.29 3.49 3.75
First, when feed = 0.05 in SM45C, Ra was changed well in roughness values in order of 0.0˚ → 0.3˚ → 0.9˚, but Ra was changed to 0.3˚ → 0.9˚ → 0.0˚ when feed = 0.10 after Rz was like 0.3˚ → 0.9˚ → 0.0˚, and then Rz was turned into 0.0˚ → 0.3˚ → 0.9˚.
Second, in case of SCM415, Ra was 0.3˚ → 0.0˚ → 0.9˚ when feed = 0.05, and Rz was changed equally like 0.3˚ → 0.0˚ → 0.9˚, and also Ra was 0.3˚ → 0.0˚ → 0.9˚ and Rz was 0.3˚ → 0.0˚ → 0.9˚ in order when feed = 0.10, and so roughness values were changed equally regardless of two feed rates.
5. Conclusions
This study did an experiment to look into changes of surface roughness by workpiece material by changing cut-ting edge angles of insert holder which was a processing tool that is, turning clearance angle. Researcher se-lected two kinds materials such as SM45C, SCM415, and compared surface roughness of sese-lected materials in case of processing them under designated processing conditions.
As a result of having measured surface roughness by workpiece material so as to investigate it, good results were come out from the workpiece material having high tensile strength.
Surface roughness was turned out to be most badly from SM45C in order of SM45C → SCM415. Also, SM45C and SCM415 showed best roughness values all together in case of 0.9˚, and worst values were displayed when the temperature was 0.3˚. Therefore, it is judged that good process criterion could be come out regardless of material kinds that were experimented above if changing negative angles of insert holder seat having been used now to −6.9˚.
References
[1] Hwang, A.B.C. (1993) Effects of the Cutting Condition on Tool Life and Surface Roughness. Master Thesis, Kyungil University,.
[2] Jeong, S.C. and Kim, K.W. (2003) A Study on Temperature Distributions of Tool Insert Using FEM. Proceedings of KAIS Annual 2003 Spring Conference, The Korea Academia-Industrial Cooperation SOCIETY, 110-112.
[3] Kim, K.T. and Kim, W.I. (2007) A Study on the Numerical Simulation of Surface Roughness Due to Cutting Condition。
Proc. ofKSME 2007 Autumn Conference, 54-56.