http://dx.doi.org/10.4236/jdaip.2016.41004
Statistical Models for Web Pages Usability
Saad Subair, Hussah AlEisaCollege of Computer and Information Sciences, Princess Nourah bint Abdulrahman University, Riyadh, KSA
Received 14 November 2015; accepted 22 February 2016; published 25 February 2016
Copyright © 2016 by authors and Scientific Research Publishing Inc.
This work is licensed under the Creative Commons Attribution International License (CC BY).
http://creativecommons.org/licenses/by/4.0/
Abstract
The usability of an interface is a fundamental issue to elucidate. Many researchers argued that many usability results and recommendations lack empirical and experimental data. In this re-search, the usability of the web pages is evaluated using several carefully selected statistical mod-els. Universities web pages are chosen as subjects for this work for ease of comparison and ease of collecting data. A series of experiments has been conducted to investigate into the usability and design of the universities web pages. Prototype web pages have been developed according to the structured methodologies of web pages design and usability. Universities web pages were evalu-ated together with the prototype web pages using a questionnaire which was designed according to the Human Computer Interactions (HCI) heuristics. Nine (users) respondents’ variables and 14 web pages variables (items) were studied. Stringent statistical analysis was adopted to extract the required information to form the data acquired, and augmented interpretation of the statistical results was followed. The results showed that the analysis of variance (ANOVA) procedure showed there were significant differences among the universities web pages regarding most of the 23 items studied. Duncan Multiple Range Test (DMRT) showed that the prototype usability per-formed significantly better regarding most of the items. The correlation analysis showed signifi-cant positive and negative correlations between many items. The regression analysis revealed that the most significant factors (items) that contributed to the best model of the universities web pages design and usability were: multimedia in the web pages, the web pages icons (alone) or-ganisation and design, and graphics attractiveness. The results showed some of the limitations of some heuristics used in conventional interface systems design and proposed some additional heu-ristics in web pages design and usability.
Keywords
Usability, HCI, Web Pages Interface, Statistical Models, Ergonomics
1. Introduction
part of human computer interaction (HCI). A survey conducted by Myers and Rosson [4] showed that software development devoted almost half of the code to the user interface [4] [5]. Dealing with or achieving goals using the interface is known as the usability of the interface. Usability of a system is how easy the system to use and how easy and efficient to perform task [6]-[8].
The Web is a huge communication system. From a technical point of view, the Web is a system of exchang-ing data over computer networks usexchang-ing special software. The interfaces used in the web pages are graphical user interfaces that utilize graphics, colours, and icons. Researches showed that there is still a big gap between the researches of the Human Computer Interaction (HCI) and hypertext systems, essentially the web [9]. Shneider-man [6] [10] argued that many researchers’ experience lack empirical data to validate or solidify their conclu-sions. Web sites can be well categorized by the originator’s identity such as individual group, university, corpo-ration, and non-profit organization [10]. Information about users can guide web designers to a better design.
The problems that inspired the research of this study can be listed as follows:
1. There were no empirical studies that categorized the users of the universities web pages, studied their prefe-rence, and the problems they were facing when using these web pages.
2. To specify the relative importance of some items or parameters of interface design and usability.
The main objective of this study is to investigate into the relations between the items of web pages design and usability and point out which items or variables contribute significantly to web pages design of the universities.
The hypothesis of this study is that:
1. There are significant differences in the design and development of web pages interfaces among the universi-ties;
2. A prototype of a university sample web pages may stimulate and inspire well-structured procedural web pages interface design;
3. Empirical data from a questionnaire and statistical analysis of these data is expected to lead to conclusions and recommendations about the user preference and design aspects of the universities web pages.
The study was focused on the design and development of user interface for the web pages of the universities. The contents of the web pages (the text and the issues inside) were not subjected to detailed studies.
tion). Clustering related items shows meaningful annotation and relationships between them. Important items can be emphasized with large fonts, color highlights, and surrounding boxes. Questionnaires were used to eva-luate the usability of interfaces [26]. However, researchers found problems and weaknesses in the questionnaires developed in the past [10] [27]-[31]. The problems varied from non-represented population sample, to lack of validation and low reliabilities of the questionnaires. Users’ acceptance or subjective satisfaction of a system is a critical measure of the system success. Chin etal.[29] developed a measurement instrument which measures the user’s subjective rating of the human computer interface called the Questionnaire for User Interface Satisfaction (QUIS). Improvements to the questionnaires for evaluating computer systems were introduced when the sample size and the number of different systems to evaluate were increased [32]. According to the PsychometricTheory the reliability of a questionnaire can be increased by increasing the number of items and scaling steps or points, but much many steps on the scale may affect its reliability adversely (Nunnally [33]).
2. Methodology
In this study, the problems and the objectives of this research which are stated earlier were attempted to be solved or achieved through:
1. Designing and developing a prototype user interface for a university web page using recent web pages de-velopment methodologies.
2. Making the necessary amendments and improvements to the prototype.
3. Evaluating the prototype and other universities web pages interface in a comparative approach through a questionnaire.
4. Using the analysis of variance (ANOVA) procedure to point out the significant differences among the uni-versities web pages with regard to each item (variable) of web pages design.
5. Using correlation analysis to investigate the relationship and association between (items) of universities web pages design variable (each two at a time) as well as multiple relationships
6. Using regression analysis to investigate the causality relationships to find out the most significant indepen-dent variables (items) that form the best model or models for the universities web pages design.
Like other computer programs, user interface systems go through stages or phases of development life cycle. In general, the phases that are usually followed in developing user interface systems are similar to those of con- ventional information system development life cycle with minor modifications. However, Nielsen [2] suggested the usability engineering lifecycle to be particularly applied to interface development and evaluation. The art of prototyping was followed in this study. The first prototype was further improved in sequence till it reached an acceptance level. The first prototype was planned to be a fast design using as little resources as possible. Al-though HTML is fairly easy programming language, enabling images and adjusting the layouts was somewhat tedious and time consuming. The very first prototype was a scenario where both the different features and func-tions of the web pages were reduced or cut down. At the next step, this scenario was extended to a horizontal prototype where the surface layer or layout of the web pages (front pages) was in its complete form but the links were not linked to real data or information. In this stage, the concept of prototyping was utilized to the best.
As in conventional system development methodologies, iteration was essential in this design. Most of the steps that were followed needed to be revised. This made the iteration an inevitable process in this design. However, the iteration was done carefully since some iteration might revert the usability of the prototype to some poor usability levels. Shneiderman’s Objects/Actions Interface (OAI) Model which follows a hierarchical decomposition of objects and actions in the task and interface domains is considered to decompose complex in-formation problem and building a comprehensible and effective prototype. The benefits from this model were centered in building the required interface objects for the prototype and specifying the required actions on that objects.
2.1. The Experiment
After the prototype was developed, an experiment was conducted to investigate into the usability aspects of four universities web pages and the prototype interface design. The universities are:
3. Univ3; 4. Univ4;
5. The prototype.
The experiment was a comparative evaluation of the usability problems of these web pages. A sample of 59 students was given a questionnaire to respond to. The students were given enough time to go through and navi-gate all the five web pages and then asked to attempt answering the questions of the questionnaire. The ques-tions of the questionnaire were mainly designed to point out the usability aspects or attributes of the universities web pages interfaces. The computer laboratory where the experiment was conducted was organized in a way that each user will be independent in his navigation of the web pages and his response to the questions. More than one lab was used for the experiment or evaluation. The evaluation environment was kept to be as normal as possible. Since the test took considerable time (1 to 2 hours), the experiment was conducted in sessions and the users were left free to have a break at any time and respond to the questions in a relax way. The users were in-formed clearly that all the answers to the questionnaire questions are for the sake of evaluating the web pages and not the users and any preliminary data and personal information will be kept confidential. It is in the guide-lines of the questionnaire that, the user may not write his/her name if he/she wishes to.
The answer sheets of the questionnaire were collected after the users finished answering the questions and the data was transferred to the SPSS (Statistical package for social sciences) to be analyzed statistically.
The questionnaire was designed using a rating scale ascending from 1 to 5 which was designed to be admi-nistered at controlled experimental conditions. The questions were designed such that each question represents an item of design or heuristic of the interface for the universities web pages. The response of the user (respon-dent) shows his preference or judgement level of that item. Each item was considered as a variable contributing to the web pages design.
2.2. Items (Variables) Studied
In this study, 23 items or variables were designed as questions in the questionnaire and assigned to the five point scale described before. Nine of the 23 items were concerned with the respondents’ knowledge background while the other 14 variables were items of web pages design. The 23 items are listed below.
(a) Respondents Knowledge Background 1. Respondents computer exposure; 2. Respondents internet exposure;
3. Respondents universities web pages exposure;
4. Importance of looking up information on universities in the Internet; 5. Respondents trust of web pages information;
6. Respondents music preference in the universities web pages;
7. Respondents animated pictures preference in the universities web pages; 8. Respondents graphics preference in the universities web pages;
9. Importance of developing web pages for the universities. (b) Items (Variables) of Web Pages Design
1. Color amount;
2. Contrast against the background; 3. Graphics information provision; 4. Color and Graphics feel of Consistency; 5. Navigation;
6. Location tracking inside the web pages; 7. Hyperlinks (hotspot) semantics; 8. Forms organization and helpfulness; 9. Animated pictures effect on web pages look; 10. Text (alone) organization and design; 11. Icons (alone) organization and design; 12. Icons and text organization and design; 13. Multimedia preference;
2.3. Statistical Analysis
The data was collected from the questionnaire answer sheets and coded and transferred into SPSS statistical package to obtain the statistical analysis for the descriptive statistics of the sample, the analysis of variance (ANOVA) of the universities web pages, and the correlation analysis of the items (variables). The data was then converted into text file and uploaded to the university’s mainframe to use SAS statistical package to obtain the regression analysis output which is clearer in SAS. Interpretations of all these statistical measures would reveal the significant difference among the universities web pages interface design for each item and point out the bet-ter items or variables for the universities web pages design.
2.4. Analysis of Variance Procedure
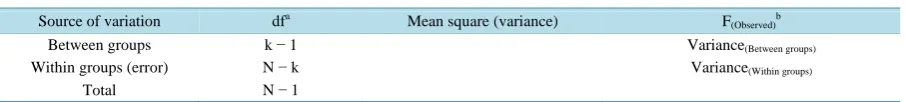
The ANOVA partitions the source of variations into within groups and between groups variation to obtain the F-value which in turn determines whatever to accept or reject the null hypothesis. The analysis of variance (ANOVA) table will then look as illustrated in Table 1.
Duncan’s multiple range test (DMRT) was used to test the differences between groups (universities).
2.5. Correlation Analysis
Simple correlation between the nine respondents’ computer and Internet level background items (variable) and the 23 items of universities web pages design (independently) were calculated from the original data using SPSS. The correlation coefficient (r) between two characters (X and Y) is usually expressed as follows:
(
2)(
2)
xy r
x y
=
∑
∑
∑
where
x = x − X and y = y − Y and
x = Independent variable (item); X is the mean of character X. y = Independent variable (item); Y is the mean of character Y.
2.6. Regression Analysis
Simple and multiple linear regressions of some items (independent variables) on the ranking of the university web pages item (dependent variable) were estimated. The formula for multiple linear regression is as follows:
1 1 2 2 n n
Y = +a b X +b X ++b X where:
Y = dependent variable;
1 -n
X = independent variables;
a = intercept of the regression line on the Y axis;
1 -n
b = linear regression coefficients;
n = N Univ3ber of independent variables.
[image:5.595.88.541.651.702.2]Backward, forward, and stepwise selection regression analysis has also been attempted. In stepwise selection variables are added (or removed) one by one into (from) the model. F-statistic is calculated after a variable is added into (or removed from) the model. A variable that did not produce significant F-value at a redefined pro- bability level is then deleted from (or added to) the model. In forward selection, variables already in the model
Table 1. Analysis of variance (ANOVA) table based on individual observationsc.
Source of variation dfa Mean square (variance) F
(Observed)b
Between groups k − 1 Variance(Between groups)
Within groups (error) N − k Variance(Within groups)
Total N − 1
a
do not necessary stay there and the process ends when none of the variables outside the model is significantly contributing to the model at the specified probability level [34] [35].
3. Results and Discussion
In this article, the nine respondents’ knowledge background variables will be discussed first followed by the 14 web pages variables.
3.1. Respondents’ Knowledge Background
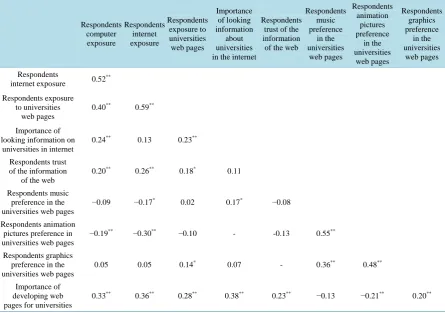
A correlation analysis study was used to explain the relationship between the nine variables of the respondents’ knowledge background. Table 2 shows that respondents’ computer exposure has positive significant correlation with the respondents’ internet exposure, respondents’ exposure to universities web pages, importance of looking up information about universities in the internet, and the importance of developing web pages for universities. However, respondents’ computer exposure showed significant negative correlation with the respondents’ prefe-rence to animation in universities web pages.
Respondents’ internet exposure showed positive significant correlation with the respondents’ exposure to uni- versities web pages, respondents’ trust of the information of the web, and the importance of developing web pages for universities. Meanwhile, respondents’ internet exposure showed significant negative correlation with the respondents’ music preference and animated pictures preference in the web pages of universities (Table 2). Table 2 also shows that respondents exposure to universities and importance of looking information about uni-versities in the internet followed almost the same pattern of relation with the other variables as the previous va-riable respondents’ internet exposure.
[image:6.595.91.537.408.721.2]Table 2 also shows that respondents who trust information of the web believe in the importance of developing web pages for universities. It is also shown that respondents who prefer music in the universities web pages they also prefer animated pictures and graphics in the web pages of universities. However, Table 2 shows a negative
Table 2. Correlation coefficient of the 12 items (variables) of the respondents computers and Internet usage background.
Respondents computer exposure Respondents internet exposure Respondents exposure to universities web pages Importance of looking information about universities in the internet
Respondents trust of the information
of the web
Respondents music preference in the universities web pages Respondents animation pictures preference in the universities web pages Respondents graphics preference in the universities web pages Respondents
internet exposure 0.52
**
Respondents exposure to universities
web pages
0.40** 0.59**
Importance of looking information on
universities in internet
0.24** 0.13 0.23**
Respondents trust of the information
of the web
0.20** 0.26** 0.18* 0.11
Respondents music preference in the universities web pages
−0.09 −0.17* 0.02 0.17* −0.08
Respondents animation pictures preference in universities web pages
−0.19** −0.30** −0.10 - -0.13 0.55**
Respondents graphics preference in the universities web pages
0.05 0.05 0.14* 0.07 - 0.36** 0.48**
Importance of developing web pages for universities
significant correlation between respondents animation preference in universities web pages and the importance of developing web pages for universities. This result reveals that respondents who believe in the importance of developing web pages for universities do not necessarily prefer animated pictures in these web pages. On the other hand, the table shows that the same respondents prefer graphics in these web pages.
3.2. Items (Variables) of Interface Design and Usability
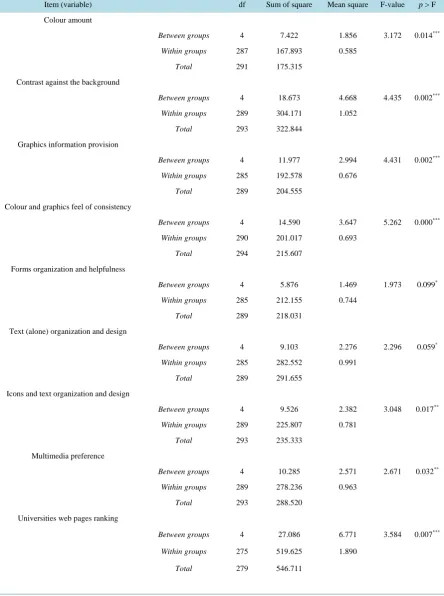
The descriptive statistics of the 14 items of the web pages interface design and usability are shown in Table 3. The number of observations (N), means, mean standard errors, standard deviations, and variances is shown in Table 3. Low variances in the table show continuous data and hence suggest normal distribution of the data. The analysis of variance (ANOVA) of the variables is shown in Table 4. Only variables that showed significant dif-ferences among universities web pages are displayed. Navigation of the web pages, location tracking, hyperlinks semantics, animated pictures effect on the web pages, and icons (alone) organization did not show significant difference in the universities web pages with regards to those variables and hence they are not displayed in the table.
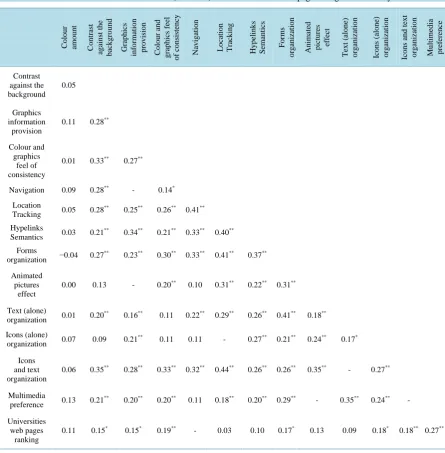
However, there are significant differences among the universities web pages regarding the rest of the va-riables. Duncan’s multiple range test (Table 5) was used to arrange these variables in significantly different groups. Table 5 shows that the prototype web pages were grouped in the best group in almost all the variables showed in the table. This reveals that the prototype was almost the best among the other universities web pages. Table 6 shows the correlation coefficients between the 14 variables studied. The web pages color amount has no significant correlation with any of the variables of the web pages studied. The web pages contrast against the background showed significant positive correlation with the web pages icons and text organization, color and graphics consistency, navigation, location tracking, and forms organization and helpfulness.
However, the contrast against the background showed no significant correlation with the web pages animated pictures effect and icons (alone) organization. The web pages graphics information provision has significant positive correlation with all the other variables studied. Specifically, it showed high positive correlation with the web pages hyperlinks semantics (Table 6). Table 6 shows that web pages color and graphics feel of consistency has positive significant correlation with most of the variables studied. However, it has no significant correlation with the text (alone) and icons (alone) organization but has high positive significant correlation with the icons
Table 3. Number of observations, means, standard errors, standard deviations, and variances of the 14 items (variables) of the universities web pages.
Item (variable) Number of observation Mean Standard error Standard deviation Variance
Color amount 292 2.90 0.05 0.78 0.60
Contrast against the background 294 3.29 0.06 1.05 1.10
Graphics information provision 290 3.27 0.05 0.84 0.71
Color and graphics feel of consistency 295 3.12 0.05 0.86 0.73
Navigation 295 3.69 0.05 0.94 0.89
Location tracking inside the web pages 294 3.54 0.06 0.97 0.94
Hyperlinks (hotspot) semantics 295 3.56 0.06 1.01 1.02
Forms organization and helpfulness 290 3.38 0.05 0.87 0.75
Animated pictures effect on web pages look 290 3.61 0.05 0.94 0.88
Text (alone) organization and design 290 3.03 0.06 1.00 1.01
Icons (alone) organization and design 293 3.27 0.06 1.00 0.99
Icons and text organization and design 294 3.62 0.05 0.90 0.80
Multimedia preference 294 3.09 0.06 0.99 0.99
Table 4. Analysis of variance (ANOVA) tables of the five universities for the 35 items (variables) of the web pages studieda.
Item (variable) df Sum of square Mean square F-value p > F
Colour amount
Betweengroups 4 7.422 1.856 3.172 0.014***
Withingroups 287 167.893 0.585
Total 291 175.315
Contrast against the background
Betweengroups 4 18.673 4.668 4.435 0.002***
Withingroups 289 304.171 1.052
Total 293 322.844
Graphics information provision
Betweengroups 4 11.977 2.994 4.431 0.002***
Withingroups 285 192.578 0.676
Total 289 204.555
Colour and graphics feel of consistency
Betweengroups 4 14.590 3.647 5.262 0.000***
Withingroups 290 201.017 0.693
Total 294 215.607
Forms organization and helpfulness
Betweengroups 4 5.876 1.469 1.973 0.099*
Withingroups 285 212.155 0.744
Total 289 218.031
Text (alone) organization and design
Betweengroups 4 9.103 2.276 2.296 0.059*
Withingroups 285 282.552 0.991
Total 289 291.655
Icons and text organization and design
Betweengroups 4 9.526 2.382 3.048 0.017**
Withingroups 289 225.807 0.781
Total 293 235.333
Multimedia preference
Betweengroups 4 10.285 2.571 2.671 0.032**
Withingroups 289 278.236 0.963
Total 293 288.520
Universities web pages ranking
Betweengroups 4 27.086 6.771 3.584 0.007***
Withingroups 275 519.625 1.890
Total 279 546.711
***: Significant at 0.01 level of probability. **: Significant at 0.05 level of probability. *: Significant at 0.10 level of probability. a: Only significant
Table 5. Grouping of the five universities for the 35 items (variables) studied according to Duncan’s multiple range testd. Colour amount Contrast against the back ground Graphics information provision Colour and graphics feel of consistency Navigation Hyperlink (hotspot) semantics Forms organization and helpfulness Text (alone) organization and design Icons and text organization and design Multi-media preference Universities web pages ranking
Univ1 2.74a 3.12a 3.12ab 3.19bc 3.73ab 3.37a 3.38ab 3.19b 3.36a 3.02ab 2.95b
Univ2 2.91ab 3.58b 3.34bc 3.36c 3.78ab 3.59ab 3.40ab 2.95ab 3.80b 3.29b 3.39b
Univ3 3.15b 3.24ab 3.30bc 2.98ab 3.66ab 3.59ab 3.38ab 3.16b 3.58ab 3.20b 3.00b
Univ4 2.73a 2.95a 2.98a 2.76a 3.44a 3.42ab 3.14a 2.72a 3.53ab 2.76a 2.43a
Prototype 2.98ab 3.59b 3.58c 3.32c 3.83b 3.80b 3.59b 3.16b 3.84b 3.19b 3.07b
d
Means with the same letters indicate no significant difference from each other at the 0.05 probability level as determined by DMRT.
Table 6.Correlation coefficients of the 14 items (variables) of the universities web pages design and usabilitya.
C ol our am ount C o n tr as t ag ain st th e b ack gr oun d Gr ap h ics in fo rm atio n pr ovi si on C ol our an d g rap h ics f eel of co n sis ten cy Nav ig atio n L o catio n T rack in g Hy p elin k s Sem an tics F o rm s o rg an izatio n An im ated p ictu res ef fect Te x t (alo n e) o rg an izatio n Ic ons ( alo n e) o rg an izatio n Ic ons an d tex t or ga n iz atio n M u ltim ed ia p ref er en ce Contrast against the background 0.05 Graphics information provision
0.11 0.28**
Colour and graphics feel of consistency
0.01 0.33** 0.27**
Navigation 0.09 0.28** - 0.14*
Location
Tracking 0.05 0.28
**
0.25** 0.26** 0.41**
Hypelinks
Semantics 0.03 0.21
**
0.34** 0.21** 0.33** 0.40**
Forms
organization −0.04 0.27
**
0.23** 0.30** 0.33** 0.41** 0.37**
Animated pictures
effect
0.00 0.13 - 0.20** 0.10 0.31** 0.22** 0.31**
Text (alone)
organization 0.01 0.20
** 0.16** 0.11 0.22** 0.29** 0.26** 0.41** 0.18**
Icons (alone)
organization 0.07 0.09 0.21
** 0.11 0.11 - 0.27** 0.21** 0.24** 0.17*
Icons and text organization
0.06 0.35** 0.28** 0.33** 0.32** 0.44** 0.26** 0.26** 0.35** - 0.27**
Multimedia
preference 0.13 0.21
**
0.20** 0.20** 0.11 0.18** 0.20** 0.29** - 0.35** 0.24** -
Universities web pages
ranking
[image:9.595.90.536.269.723.2]and text together organization and helpfulness. Navigation of the web pages has significant positive correlation with all the variables studied except the web pages icons (alone) organization and the multimedia preferences in the universities web pages. Location tracking and hyperlinks semantics showed significant positive correlation (separately) with almost all the other variables studied except the ranking of the universities web pages. This re-sult indicated that the ranking of the web pages of the universities did not rely much on these two variables. The web pages forms organization has significant positive correlation with the rest of the variables studied. Forms organization associated significantly with the ranking of the universities web pages. The animated pictures effect on the web pages showed significant positive correlation with the web pages text (alone), icons (alone), and icons and text (together) organization and helpfulness. However, animated pictures have no significant correla-tion with the ranking of the web pages. Text (alone) organizacorrela-tion has significant positive correlacorrela-tion with the icons alone organization and multimedia preferences in the web pages of the universities. However, text (alone) has no significant correlation with the ranking of the universities web pages. Icons (alone) organization has sig-nificant positive correlation with the icons and text (together) organization, multimedia preference, and the web pages ranking. Icons and text (together) organization and multimedia preference have significant positive corre-lation (separately) with the ranking of the universities pages.
3.3. Regression Analysis
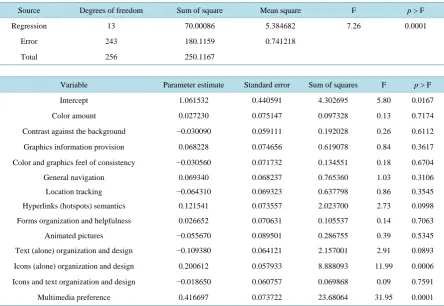
[image:10.595.93.538.415.721.2]Multiple linear regression results are shown in Table 7. The ANOVA (analysis of variance) table for regression shows that the model was significant at the 0.01 probability level, indicating that the contribution of independent variables coefficients were not equal to zero (alternate hypothesis). The table also shows that multimedia pre- ference in the universities web pages contributed highly and significantly to the model. However, some regres-sion analysis procedures were used, including, forward selection, backward elimination, and stepwise selection. Maximum coefficient of determination (R2) was achieved by including specific number of independent va-riables.
Table 7. Linear regression analysis between universities web pages ranking and other items (variables) of web pages design and usability.
Source Degrees of freedom Sum of square Mean square F p > F
Regression 13 70.00086 5.384682 7.26 0.0001
Error 243 180.1159 0.741218
Total 256 250.1167
Variable Parameter estimate Standard error Sum of squares F p > F
Intercept 1.061532 0.440591 4.302695 5.80 0.0167
Color amount 0.027230 0.075147 0.097328 0.13 0.7174
Contrast against the background −0.030090 0.059111 0.192028 0.26 0.6112
Graphics information provision 0.068228 0.074656 0.619078 0.84 0.3617
Color and graphics feel of consistency −0.030560 0.071732 0.134551 0.18 0.6704
General navigation 0.069340 0.068237 0.765360 1.03 0.3106
Location tracking −0.064310 0.069323 0.637798 0.86 0.3545
Hyperlinks (hotspots) semantics 0.121541 0.073557 2.023700 2.73 0.0998
Forms organization and helpfulness 0.026652 0.070631 0.105537 0.14 0.7063
Animated pictures −0.055670 0.089501 0.286755 0.39 0.5345
Text (alone) organization and design −0.109380 0.064121 2.157001 2.91 0.0893
Icons (alone) organization and design 0.200612 0.057933 8.888093 11.99 0.0006
Icons and text organization and design −0.018650 0.060757 0.069868 0.09 0.7591
Table 8 shows a summary of forward selection procedure for the dependent variable universities web pages ranking. The procedure showed that only eight independent variables contributed significantly to the model. However, universities web pages multimedia preference and icons (alone) organization and design were contri-buted significantly to the model. The forward selection begins with the most independent variable contributing highly to the model and advances to the next most contributing one till it reaches a satisfactory model.
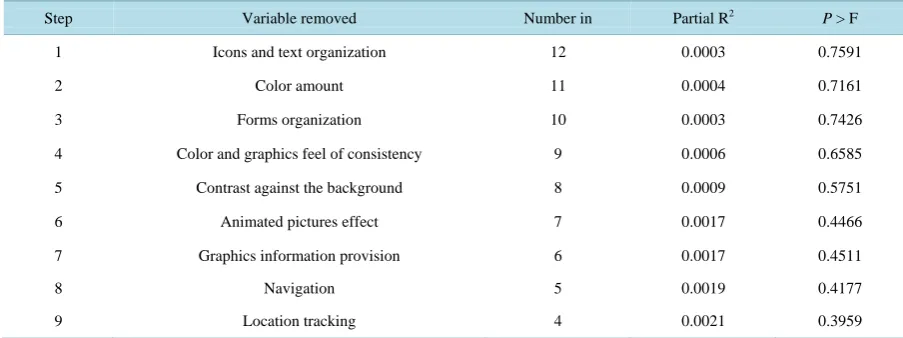
Unlike the forward selection, backward elimination begins with the complete model including all the inde-pendent variables and then started to eliminate the most non-significant variable in the model considering its F-value, then proceed to the next most non-significant one. Table 9 shows a summary of the backward elimina-tion procedure. As seen in the table, nine variables were removed from the model. This indicated that these 9 variables did not contribute significantly to the model (in this order) as the rest of the variables did.
The forward selection and backward elimination adds and eliminates (respectively) independent variables to (from) the model regardless of what variables are already outside or existing in the model. Stepwise selection re- examines at every stage the regression of the variables incorporated into the model in previous stages. A varia-ble which might have been the best single variavaria-ble to enter the model at an early stage, might at later stage, be superfluous because of the relationships between it and other variables now in the regression model [34]. Table 10 shows a summary of stepwise selection regression procedure model which included only four variables that were significantly contributed to the model at the 0.15 probability level. That is to say, universities web pages multimedia preference, icons (alone) organization, text (alone) organization, and hyperlinks (hotspots) semantics were the four most independent variables contributing to the model significantly.
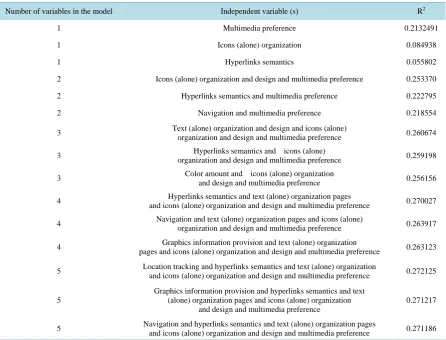
[image:11.595.92.540.377.718.2]Coefficient of determination (R2) measures the proportion of total sum of squares of the variables that is ex-plained by the regression line. It is a measure of how closely the points (observation) fit the least square line. Consequently, the line that has maximum R2 represents the best fitting line [36]. Table 11 shows the maxi-
Table 8. Summary of forward selection procedure for dependent variable universities web pages ranking.
Step Variable entered Number in Partial R2 P > F
1 Multimedia preference 1 0.2132 0.0001
2 Icons (alone) organization and design 2 0.0401 0.0003
3 Text (alone) organization and design 3 0.0073 0.1151
4 Hyperlinks Semantics 4 0.0094 0.0736
5 Location Tracking 5 0.0021 0.3959
6 Navigation 6 0.0019 0.4177
7 Graphics information provision 7 0.0017 0.4511
8 Animated pictures effect 8 0.0017 0.4466
Table 9. Summary of backward elimination procedure for dependent variable universities web pages ranking.
Step Variable removed Number in Partial R2 P > F
1 Icons and text organization 12 0.0003 0.7591
2 Color amount 11 0.0004 0.7161
3 Forms organization 10 0.0003 0.7426
4 Color and graphics feel of consistency 9 0.0006 0.6585
5 Contrast against the background 8 0.0009 0.5751
6 Animated pictures effect 7 0.0017 0.4466
7 Graphics information provision 6 0.0017 0.4511
8 Navigation 5 0.0019 0.4177
[image:11.595.86.538.551.720.2]Table 10. Summary of stepwise procedure for dependent variable universities web pages rankinga.
Step Variable entered/removed Number in Partial R2 Model R2 P > F
1 Multimedia preference 1 0.2132 0.2132 0.0001
2 Icons (alone) organization and design 2 0.0401 0.2534 0.0003
3 Text (alone) organization and design 3 0.0073 0.2607 0.1151
4 Hyperlinks semantic 4 0.0094 0.2700 0.0736
a: All variables in the model are significant at 0.15 probability level.
Table 11. R2 of single and/or combination of different independent variable (s) with dependent variable universities web pages ranking.
Number of variables in the model Independent variable (s) R2
1 Multimedia preference 0.2132491
1 Icons (alone) organization 0.084938
1 Hyperlinks semantics 0.055802
2 Icons (alone) organization and design and multimedia preference 0.253370
2 Hyperlinks semantics and multimedia preference 0.222795
2 Navigation and multimedia preference 0.218554
3 Text (alone) organization and design and icons (alone)
organization and design and multimedia preference 0.260674
3 Hyperlinks semantics and icons (alone)
organization and design and multimedia preference 0.259198
3 Color amount and icons (alone) organization
and design and multimedia preference 0.256156
4 Hyperlinks semantics and text (alone) organization pages
and icons (alone) organization and design and multimedia preference 0.270027
4 Navigation and text (alone) organization pages and icons (alone) organization and design and multimedia preference 0.263917
4 Graphics information provision and text (alone) organization
pages and icons (alone) organization and design and multimedia preference 0.263123
5 Location tracking and hyperlinks semantics and text (alone) organization
and icons (alone) organization and design and multimedia preference 0.272125
5
Graphics information provision and hyperlinks semantics and text (alone) organization pages and icons (alone) organization
and design and multimedia preference
0.271217
5 Navigation and hyperlinks semantics and text (alone) organization pages
and icons (alone) organization and design and multimedia preference 0.271186
mum R2 that is attained with one independent variable, two independent variables, and so on till 13 independent variables. This might indicate the ranking importance of an independent variable as a single or in combination with other independent variables to universities web pages ranking. The results showed that the universities web pages location tracking, hyperlinks semantics, text (alone) organization, icons (alone) organization, and design, and multimedia preferences were among the first five variables (items) that contributed significantly to the uni-versities web pages ranking. However, limitation to R2 is that the addition of an irrelevant independent variable to the regression model will increase R2 even though the irrelevant variable is not related to the other variables in the model [36]. The assumption of this model is that all the variables (items) have been estimated precisely.
[image:12.595.92.539.235.575.2]two independent variables, icons (alone) organization and design and multimedia preference of the universities web pages gave the most significant contribution to the dependent variable universities web pages ranking. For three independent variables, the universities web pages text (alone) organization and design, icons (alone) or-ganization and design, and multimedia preference gave the most significant contribution to the dependent varia-ble universities web pages ranking (Table 11).
4. Conclusions
From the discussion, some important conclusions and findings concerning both users (respondents) and items (variables) of the web pages of the universities [37] were unveiled. These conclusions and findings can be sum-marized as follows:
1. Respondents who were frequent in using computers did not prefer animated pictures in universities web pages (Table 2).
2. Respondents who frequently access the Internet believe that it is important to develop web pages for univer-sities (Table 2).
3. Respondents who were well exposed to computer did not prefer music and animation in the universities web pages (Table 2).
4. There were significant differences between the universities web pages regarding most of the variables stu-died (Table 4).
5. The prototype which was developed according to a scientific methodology was proved to be better than most of the other universities web pages (Table 5).
6. Good contrast against the background of the web pages made the navigation of the web pages more conve-nient (Table 6).
7. Good design of graphics made the icons and hyperlinks meaningful and had metaphoric dimensions (Table 6).
8. The usage of the icons and text together in the universities web pages design was proved to be better than the usage of the text alone or the icons alone (Table 6).
9. Multimedia in the web pages, the web pages, icons organization and design, the web pages text organization and design, and hyperlinks semantics in the web pages independently and separately contributed significant-ly (in this order) to the ranking of the universities web pages (Table 7).
10. The best five items of web pages design and usability that together formed the most significant model were: location tracking, hyperlinks semantics, text (alone) organization and design, icons (alone) organization and design, and multimedia preference (Table 11).
5. Recommendations for Future Work
1. Further studies can be done to increase the validity and reliability of the questionnaire used in this study. This can be achieved by increasing and randomizing the sample of the test users (respondents), increasing the steps of the scale (e.g. 10 points scale), and increasing the number of the questions used in the question-naire.
2. In further studies, it is suggested that the questions of the questionnaire can be improved by being more spe-cific and adhere to the scale designed for that. General questions can yield confounding results. For one item or variable of interface usability there may be several questions instead of only one or few.
3. In this study, only one sample group was used. In future work, the sample users (respondents) can be divided into two groups: users and experts. More sophisticated scale (e.g. 10 points scale) can be constructed for ex-pert users (respondents). In 10 points scale for instance, exex-pert users can better distinguish the different le-vels (points) of a single question which can yield a wide range of data which could be better analyzed statis-tically.
4. Additional statistical models can rigorously analyze the usability of the web pages and hence more valid and verified conclusions can be achieved.
Acknowledgements
References
[1] Jacko, J.A. (2012) The human-Computer Interaction Handbook: Fundamentals, Evolving Technologies, and Emerging Applications. CRC Press, Florida, 1518. http://dx.doi.org/10.1201/b11963
[2] Nielsen, J. (1993) Usability Engineering. Academic Press, Inc., Harcourt Brace & Company, San Diego, USA.
[3] Landseadel, P. (1994) Methodologies in User Interface Design. IEEE Electronic Library, No. 0-7803-1910-9/94. http://dx.doi.org/10.1109/autest.1994.381557
[4] Myers, B.A. and Rosson, M.B. (1992) Survey on User Interface Programming. CHI’92 Proceedings of the SIGCHI Conference on Human Factors in Computing Systems, Monterey, CA, 3-7 May 1992, 195-202.
http://dx.doi.org/10.1145/142750.142789
[5] Norman, D.A. (2010) Natural User Interfaces Are Not Natural. Interactions, 17, No. 3. http://dx.doi.org/10.1145/1744161.1744163
[6] Shneiderman, B., Kent, L. Norman, C.P., Benjamin, B., Bederson, D.A. and Golbeck, J. (2013) 30 Years at the Uni-versity of Maryland’s Human-Computer Interaction Lab (HCIL). Interactions, 20, 50-57.
http://dx.doi.org/10.1145/2508061
[7] Nielsen, J. (2013) Usability 101: Introduction to Usability. Jakob Nielsen’s Alertbox, 25.
[8] Davis, P. and Shipman, F. (2011) Learning Usability Assessment Models for Web Sites. Proceedings of the 16th In-ternational Conference on Intelligent User Interfaces, Palo Alto, 13-16 February 2011, 195-204.
http://dx.doi.org/10.1145/1943403.1943433
[9] Buckingham, S. and McKnight, C. (1997) Word Wide Web Usability: Introduction to This Special Issue. International Journal of Human-Computer Studies, 47, 1-4. http://dx.doi.org/10.1006/ijhc.1997.0132
[10] Shneiderman, B. (1997) Designing Information-Abundant Web Sites: Issues and Recommendations. International Jour-nal of Human-Computer Studies, 47, 5-30. http://dx.doi.org/10.1006/ijhc.1997.0127
[11] Lee, Y. and Kozar, K. (2012) Understanding of Website Usability: Specifying and Measuring Constructs and Their Relationships. Decision Support Systems, 52, 450-463. http://dx.doi.org/10.1016/j.dss.2011.10.004
[12] Bieber, M., Vitali, F., Ashman, H., Balasubramanian, V. and Oinas-Kukkonen, H. (1997) Fourth Generation Hyperme-dia: Some Missing Links for the World Wide Web. International Journal of Human-Computer Studies, 47, 31-66. http://dx.doi.org/10.1006/ijhc.1997.0130
[13] Smith, P.A., Newman, I.A. and Parks, L.M. (1997) Virtual Hierarchies and Virtual Networks: Some Lessons from Hypermedia Usability Research Applied to the World Wide Web. International Journal of Human-Computer Studies, 47, 67-95. http://dx.doi.org/10.1006/ijhc.1997.0128
[14] Erskine, L.E., Carter-Tod, D. and Burton, J.K. (1997) Dialogical Techniques for the Design of Web Sites. International Journal of Human-Computer Studies, 47, 169-196. http://dx.doi.org/10.1006/ijhc.1997.0129
[15] Thimbleby, H. (1997) Gentler: A Tool for Systematic Web Authoring. International Journal of Human-Computer Studies, 47, 139-168. http://dx.doi.org/10.1006/ijhc.1997.0131
[16] Benyon, D., Stone, D. and Woodroffe, M. (1997) Experience with Developing Multimedia Courseware for the World Wide Web: The Need for Better Tools and Clear Pedagogy. International Journal of Human-Computer Studies, 47, 197-218. http://dx.doi.org/10.1006/ijhc.1997.0126
[17] Koved, L. and Shneiderman, B. (1986) Embedded Menus: Selecting Items in Context. Communications of the ACM, 29, 312-318. http://dx.doi.org/10.1145/5684.5687
[18] Shneiderman, B. and Kearsley, G. (1989) Hypertext Hands-On: An Introduction to a New Way of Organising and Ac-cessing Information. Addison-Wesley, Reading.
[19] Norman, K. (1991) The Psychology of Menu Selection: Designing Cognitive Control at the Human/Computer Interface. Ablex, Norwood.
[20] Rivlin, E., Rotafogo, R. and Shneiderman, B. (1994) Navigating in Hyperspace: Designs for a Structure-Based Tool-box. Communications of the ACM, 37, 87-96. http://dx.doi.org/10.1145/175235.175242
[21] Isakowitz, T., Stohr, E.A. and Balasubramanian, P. (1995) RMM: A Methodology for Hypermedia Design. Communi-cations of the ACM, 38, 34-44. http://dx.doi.org/10.1145/208344.208346
[22] Belkin, N.J. and Croft, B.W. (1992) Information Filtering and Information Retrieval: Two Sides of the Same Coin?
Communications of the ACM, 35, 29-38. http://dx.doi.org/10.1145/138859.138861
[23] Marchionini, G. (1989) Making the Transition from Print to Electronic Encyclopaedia: Adaptation of Mental Models.
International Journal of Man-Machine Studies, 30, 591-618. http://dx.doi.org/10.1016/S0020-7373(89)80012-4
Satisfaction. International Journal of Man-Machine Studies, 39, 775-792. http://dx.doi.org/10.1006/imms.1993.1083
[25] Horton, W., Taylor, L., Ignacio, A. and Hoft, N.L. (1996) The Web Page Design Cookbook. John Wiley & Sons, Inc., New York.
[26] Norman, D. and Nielsen, J. (2013) 10 Usability Heuristics for User Interface Design. http://www.nngroup.com/articles/ten-usability-heuristics/
[27] Bailey, J.E. and Person, S.W. (1983) Development of a Tool for Measuring and Analysing Computer User Satisfaction.
Management Science, 29, 530-545. http://dx.doi.org/10.1287/mnsc.29.5.530
[28] Chin, J.P., Norman, K.L. and Shneiderman, B. (1987) Subjective User Evaluation of CF PASCAL Programming Tools. Technical Report (CAR-TR-304), Human-Computer Interaction Laboratory, University of Maryland, College Park. [29] Chin, J.P., Virginia, A.D. and Norman, K.L. (1988) Development of an Instrument Measuring User Satisfaction of the
Human-Computer Interface. Proceedings of the SIGCHI Conference on Human Factors in Computing Systems, Paris, 27 April-2 May 2013, 213-218. http://dx.doi.org/10.1145/57167.57203
[30] Ives, B., Olson, M.H. and Baroudi, J.J. (1983) The Measurement of User Information Satisfaction. Communication of the ACM, 26, 785-793. http://dx.doi.org/10.1145/358413.358430
[31] Larcker, D.F. and Lessig, V.P. (1980) Perceived Usefulness of Information: A Psychometric Examination. Decision Science, 11, 121-134. http://dx.doi.org/10.1111/j.1540-5915.1980.tb01130.x
[32] Rushinek, A. and Rushinek, S.F. (1986) What Makes User Happy? Communication of the ACM, 29, 594-598. http://dx.doi.org/10.1145/6138.6140
[33] Nunnally, J.C. (1978) Psychometric Theory. McGraw-Hill Book Company, New York.
[34] Drapper, N.R. and Smith, H. (1981) Applied Regression Analysis. John Wiley & Sons Inc., New York.
[35] SAS Institute Inc. (1987) SAS /STATTM Guide for Personal Computers. Version 6, SAS Institute Inc., Cary.
[36] Retherfor, R.D. and Choe, M.K. (1993) Statistical Models for Causal Analysis. John Wiley & Sons, Inc., New York. http://dx.doi.org/10.1002/9781118033135