http://dx.doi.org/10.4236/ojce.2016.62012
Comparison between Different Shapes of
Structure by Response Spectrum Method of
Dynamic Analysis
Jaya Rajkumar Ramchandani, Madhuri Nilesh Mangulkar Department of Civil Engineering, J.N.E.C, Aurangabad (M.S), India
Received 23 January 2016; accepted 11 March 2016; published 14 March 2016
Copyright © 2016 by authors and Scientific Research Publishing Inc.
This work is licensed under the Creative Commons Attribution International License (CC BY).
http://creativecommons.org/licenses/by/4.0/
Abstract
Several procedures for non-linear static and dynamic analysis of structures have been developed in recent years. In this paper, the response spectrum analysis is performed on two different shapes i.e. regular and irregular shape of structure by using STAAD PRO. And the comparison results are studied and compared accounting for the earthquake characteristics and the structure dynamic characteristics. As the results show that the earthquake response peak values and the main re-sponse frequencies are very close and comparable. It can be referred to by the engineering appli-cations.
Keywords
Seismic Response Spectrum Analysis, STAAD PRO, Dynamic Characteristics, Earthquake Response Peak
1. Introduction
Response spectrum is one of the useful tools of earthquake engineering for analyzing the performance of struc-tures especially in earthquakes, since many systems behave as single degree of freedom systems. Thus, if you can find out the natural frequency of the structure, then the peak response of the building can be estimated by reading the value from the ground response spectrum for the appropriate frequency. In most building codes in seismic regions, this value forms the basis for calculating the forces that a structure must be designed to resist (seismic analysis).
The resulting plot can be used to select the response of any linear SDOF oscillator, given its natural frequency of oscillation. One such use is in assessing the peak response of buildings to earthquakes.
In Payam Tehrani [2006] study, he compared the nonlinear static (pushover) and nonlinear dynamic proce-dures in the determination of maximum displacements of an existing steel structure retrofitted with different methods [1]. In A. R. Touqan [2008] a comparison of the Response spectrum analysis and Equivalent Static Lateral Load with the more elaborate Response Spectrum Method of analysis as they apply to a repertoire of different structural models [2]. In Prof Dr. Qaiseruz Zaman Khan’s [2010] paper Response spectrum analysis of 20 story building has been discussed in detail and comparison of static and dynamic analysis and design results of buildings up to 400 feet height (40 story) in terms of percentage decrease in bending moments and shear force of beams, bending moments of columns, top story deflection and support reaction are discussed [3]. Romy Mo-han [2011] paper highlights the accuracy and exactness of Time History analysis in comparison with the most commonly adopted response spectrum analysis and equivalent static analysis considering different shape of shear walls [4].
In this paper, a four storey reinforced concrete building with moment resisting frame of different shapes i.e., Regular shaped and Irregular shaped is analyzed by Response spectrum method of Dynamic analysis of Earth-quake. A set of values from 0 to 90 degrees with an increment of 10 degrees have been used of excitation of seismic force. The details of the study and its result are described briefly in the following section of the paper.
2. Parametric Details of Model
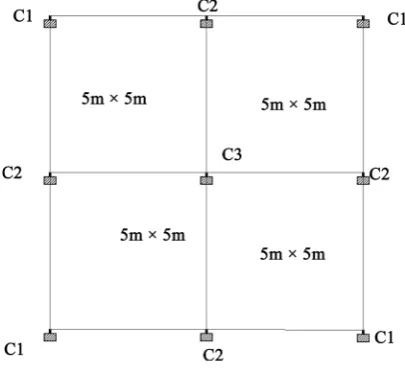
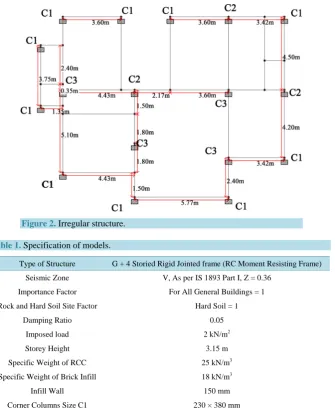
The position of three different types of columns C1, C2, C3 i.e. corner, side and middle respectively of Regular (Square) and Irregular structure is shown in Figure 1 and Figure 2 respectively. And Table 1 represents all the basic specification required for the analysis of the structure.
3. Methodology
The present study undertaken deals with response spectrum method of dynamic analysis. In order to apply forces in different angles, the structure has to be rotated with incidence angle from 0 to 90 degrees, with an increment of 10 degrees and column forces have been investigated in all cases. Further in order to find the accurate angle the interval of one degree is used. The columns have been divided into three main categories, including corner, side and internal (middle) columns and the results are compared.
[image:2.595.211.414.523.709.2]4. Results and Discussion
Table 2 and Table 3 show the values of shear force, moment about Y axis and moment about Z axis for square
(regular) and irregular shaped structure for three different types of columns C1 (Corner), C2 (Side), C3 (Middle) respectively. And Figure 3 to Figure 8 show the graph of these values v/s angle of rotation in degrees.
Figure 2. Irregular structure.
Table 1. Specification of models.
Type of Structure G + 4 Storied Rigid Jointed frame (RC Moment Resisting Frame)
Seismic Zone V, As per IS 1893 Part I, Z = 0.36
Importance Factor For All General Buildings = 1
Rock and Hard Soil Site Factor Hard Soil = 1
Damping Ratio 0.05
Imposed load 2 kN/m2
Storey Height 3.15 m
Specific Weight of RCC 25 kN/m3
Specific Weight of Brick Infill 18 kN/m3
Infill Wall 150 mm
Corner Columns Size C1 230 × 380 mm
Side Columns Size C2 300 × 380 mm
[image:3.595.172.467.81.300.2]Middle Columns Size C3 300 × 450 mm
Table 2. (a) Square corner column C1, (b) square side column C2, (c) square middle column C3.
(a)
ANGLE SHEAR+ SHEAR- My Mz
0 970.012 22.407 30.192 35.383
10 970.387 25.826 30.063 35.243
20 970.579 28.443 29.726 34.869
30 970.568 30.167 29.002 34.663
40 970.338 30.956 28.069 33.125
50 970.335 30.95 28.042 33.125
60 970.571 30.157 29.004 34.114
70 970.574 28.436 29.726 34.85
80 970.362 25.829 30.079 35.307
[image:3.595.145.483.572.720.2](b)
ANGLE SHEAR+ SHEAR- My Mz
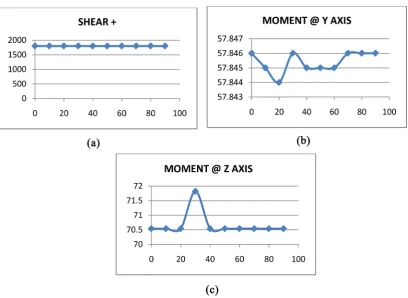
0 1800 36.428 57.846 70.539
10 1800 35.861 57.845 70.538
20 1800 34.187 57.844 70.539
30 1800 31.502 57.846 71.822
40 1800 27.906 57.845 70.539
50 1800 27.915 57.845 70.539
60 1800 31.509 57.845 70.539
70 1800 34.178 57.846 70.539
80 1800 35.856 57.846 70.539
90 1800 36.428 57.846 70.539
(c)
ANGLE SHEAR+ SHEAR- My Mz
0 2630 0 34.007 76.776
10 2630 0.013 33.435 77.903
20 2630 0.026 31.826 83.024
30 2630 0.035 32.734 88.858
40 2630 0.038 48.696 90.263
50 2630 0.034 61.298 78.24
60 2630 0.024 64.879 55.101
70 2630 0.012 63.401 41.277
80 2630 0.003 61.659 42.388
[image:4.595.142.485.473.724.2]90 2630 0 60.996 42.68
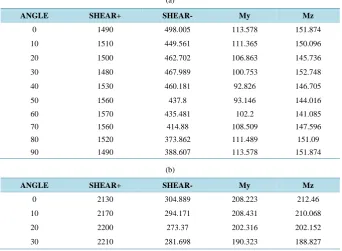
Table 3. (a) Irregular corner column C1, (b) irregular side column C2, (c) irregular middle column C3.
(a)
ANGLE SHEAR+ SHEAR- My Mz
0 1490 498.005 113.578 151.874
10 1510 449.561 111.365 150.096
20 1500 462.702 106.863 145.736
30 1480 467.989 100.753 152.748
40 1530 460.181 92.826 146.705
50 1560 437.8 93.146 144.016
60 1570 435.481 102.2 141.085
70 1560 414.88 108.509 147.596
80 1520 373.862 111.489 151.09
90 1490 388.607 113.578 151.874
(b)
ANGLE SHEAR+ SHEAR- My Mz
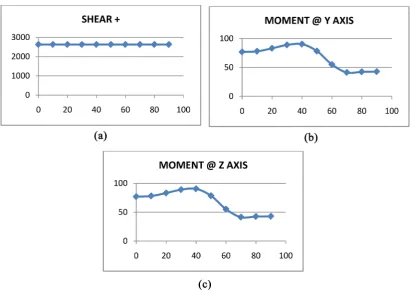
0 2130 304.889 208.223 212.46
10 2170 294.171 208.431 210.068
20 2200 273.37 202.316 202.152
Continued
40 2200 313.914 172.83 170.256
50 2200 375.673 194.204 167.194
60 2180 424.402 175.391 186.58
70 2140 459.777 189.406 200.649
80 2100 482.009 201.666 209.302
90 2130 491.464 208.223 212.46
(c)
ANGLE SHEAR+ SHEAR- My Mz
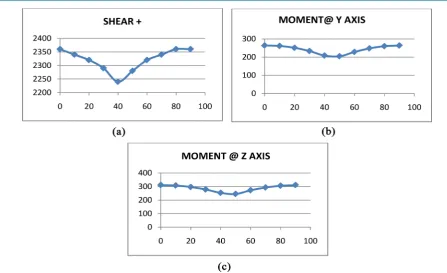
0 2360 327.852 263.663 310.705
10 2340 337.015 261.208 307.573
20 2320 339.325 250.968 296.569
30 2290 334.766 233.18 278.177
40 2240 322.064 208.368 252.987
50 2280 299.139 204.524 244.832
60 2320 264.573 228.088 272.289
70 2340 269.179 247.877 292.813
80 2360 275.786 259.901 305.753
[image:5.595.89.535.86.697.2]90 2360 275.524 263.662 310.705
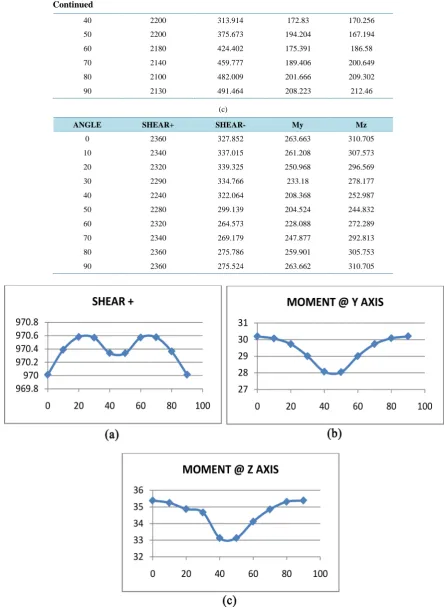
Figure 4. (a) Graph of Fx v/s angle of rotation in degrees, (b) graph of My v/s angle of rotation in degrees, (c) graph of Mz v/s angle of rotation in degrees.
[image:6.595.111.520.396.694.2]Figure 6. (a) Graph of Fx v/s angle of rotation in degrees, (b) graph of My v/s angle of rotation in degrees, (c) graph of Mz v/s angle of rotation in degrees.
[image:7.595.108.519.402.693.2]Figure 8. (a) Graph of Fx v/s angle of rotation in degrees, (b) graph of My v/s angle of rotation in degrees, (c) graph of Mz v/s angle of rotation in degrees.
5. Conclusions
1) For Corner Column C1: The shear force along X direction has a symmetrical parabolic curve about Y axis for regular square structure whereas for irregular structure the curve is un-symmetric as shown in Figure 3(a) and Figure 4(a) respectively.
2) The graph of Moment about Y axis is symmetrical about Y axis for both the structures. And the graph of Moment about Z axis is unsymmetrical for both the structures as shown in Figure 3(c) and Figure 4(c) respec-tively.
3) For Side Column C2: The shear force in X direction is constant throughout for regular square structure whereas for irregular structure the curve is symmetric about Y axis which attains maximum value at 30 degrees as shown in Figure 5(a) and Figure 6(a) respectively.
4) Similarly the graphs for moments about Y and Z axis can be compared for both the structures.
5) For Middle Column C3: Again the shear along X direction is constant for regular square structure and symmetric parabolic nature for irregular structure.
6) The above conclusions show that structure behaves in different manner for different shape of structure. Thus, the structure should be analyzed for each particular angle and it should be designed for maximum value of shear force and maximum moments.
References
[1] Patil, A.S. and Kumbhar, P.D. (2013) Time History Analysis of Multi Storied RCC Buildings for Different Seismic Intensities. International Journal of Structural and Civil Engineering, 2, 194-197.
[2] Bedekar, S. and Shinde, R. (2015) Time History Analysis of High Rise Structure Using Different Accelerogram. In-ternational Journal of Research in Engineering and Advanced Technology, 3, 1108-1111.
[3] Hosseini, M. and Salemi, A. (2008) Studying Effect of Earthquake Excitation Angle on Internal Forces of Steel Build-ings Elements by Using Non Linear Time History Analysis. The 14th World Conference on Earthquake Engineering, Beijing, 12-17 October 2008, 343-348.