Elsevier Editorial System(tm) for Journal of Magnesium and Alloys
Manuscript Draft
Manuscript Number: JMA-D-17-00017
Title: Effects of Mg2+ interstitial ion on the properties of Mg0.5+x/2Si2-xAlx(PO4)3 ceramic electrolytes
Article Type: Original Research Article
Keywords: Ceramic, electrolyte, Mg electrolyte, interstitial ion, Nasicon Corresponding Author: Dr. Adnan SBRS, PhD
Corresponding Author's Institution: University of malaya First Author: Adnan SBRS, PhD
Order of Authors: Adnan SBRS, PhD
Abstract: Nasicon type, Mg0.5+x/2Si2-xAlx(PO4)3 was synthesized using citric acid assisted sol-gel method. The X-ray diffraction was applied to investigate the effect of extra Mg2+ interstitial ion on the phase, unit cell parameters and structure of the samples. The
Mg0.625Si1.75Al0.25(PO4)3 sample exhibited highest bulk conductivity value of 1.54 ×10⁻⁴ S cm-1 at ambient temperature. The frequency
dependence of the σac of these ceramic electrolytes follows the universal power law variation, σac (ω) = σo + Aωα. The conductivity parameters such as hopping frequencies, charge carrier concentration and mobile ion
concentration proved that the increase in conductivity with x was due to the existing of Mg2+ interstitial ion. The experiment results also
revealed that the dielectric constant and dielectric loss decreased with frequency. The Mg0.625Si1.75Al0.25(PO4)3 was found to be
electrochemically stable up to 2.51 V at ambient temperature. Suggested Reviewers: Larbi Zerroual
Zerroual@yahoo.fr
He experts in this area Ri hanum yahya
rihanum43@salam.uitm.edu.my she experts in this area Nur Amalina Mustaffa
nuramalina@salam.uitm.edu.my she experts in this area
Effects of Mg
2+interstitial ion on the properties of
Mg
0.5+x/2Si
2-xAl
x(PO
4)
3ceramic electrolytes
Z.A. Halim1, S.B.R.S Adnan*2 and N.S. Mohamed2
1
Institute of Graduate Studies, University of Malaya, 50603 Kuala Lumpur, Malaysia 2
Centre for Foundation Studies in Science, University of Malaya, 50603 Kuala Lumpur, Malaysia
Email: syed_bahari@um.edu.my*
______________________________________________________________________________
ABSTRACT
Nasicon type, Mg0.5+x/2Si2-xAlx(PO4)3 was synthesized using citric acid assisted sol-gel method. The X-ray diffraction was applied to investigate the effect of extra Mg2+ interstitial ion on the phase, unit cell parameters and structure of the samples. The Mg0.625Si1.75Al0.25(PO4)3 sample exhibited highest bulk conductivity value of 1.54 ×10⁻⁴ S cm-1 at ambient temperature. The frequency dependence of the σac of these ceramic electrolytes follows the universal power law variation, σac (ω) = σo + Aωα. The conductivity parameters such as hopping frequencies, charge carrier concentration and mobile ion concentration proved that the increase in conductivity with x was due to the existing of Mg2+ interstitial ion. The experiment results also revealed that the dielectric constant and dielectric loss decreased with frequency. The Mg0.625Si1.75Al0.25(PO4)3 was found to be electrochemically stable up to 2.51 V at ambient temperature.
Keywords : Ceramic, electrolyte, Mg electrolyte, interstitial ion, Nasicon
1. INTRODUCTION
significantly cheaper, safer and better-performing battery option in contrast to lithium [1]. Despite these attractive attributes of Mg batteries, there are several challenges pertaining to the
use of cathodes, electrolytes and anodes. With respect to electrolytes, the magnesium electrolytes’s compound has to show high ionic conductivity, large enough interstitial void and
high structural stability based on 3D framework [2].
There is only a limited number of works on the use of magnesium as an electrolyte in magnesium batteries. This is may due to the (i) difficulty for the divalent Mg-ion to diffuse in
solid electrolytes compared to the monovalent Li-ion, (ii) narrow electrical window of electrolytes used for Mg-ion electrochemical activity and finally (iii) relatively low specific
energy of magnesium ion batteries compared to its lithium counterpart [3]. Anuar et al started to synthesize magnesium electrolytes based on Nasicon type, Mg0.5Zr2 (PO4)3 [2]. However, the Nasicon’s lattice size was too large making the structure unstable. To overcome this problem,
the authors replaced Zr4+ with Si4+ as reported in an early paper [4] in order to reduce the lattice size of the Nasicon’s structural. The conductivity of Mg0.5Si2(PO4)3 solid electrolytes is an order
of magnitude higher than the Mg0.5Zr2(PO4)3 solid electrolytes.
The conductivity of the Nasicon materials can also be improved by modifying their unit cell dimension and ion concentration ( interstitial ion and vacant site)[5][6][7]. Therefore, in the
In this paper, the effects of Mg2+ interstitial ion on the thermal, structural, electrical and electrochemical properties of the Mg0.5+x/2Si2-xAlx (PO4) 3 compound prepared by the sol gel method were investigated. For this purpose, the Mg0.5+x/2Si2-xAlx(PO4)3 samples were subjected to X-ray diffraction, scanning electron microscopy, impedance spectroscopy and linear sweep
Voltammetry analysis.
2. EXPERIMENTAL PROCEDURE
2.1 Synthesis of Mg0.5+x/2Si2-xAlx(PO4)3 samples
For sample preparation, magnesium acetate tethrahydrate, tetraethyl orthoslilicate, aluminium acetate and ammonium phosphate monobasic (H6NO4P) were used as the starting materials Meanwhile citric acid (C6H8O7) was employed as the chelating agent. The molar ratio of Mg:Si:Al:P:O was determined based on the stoichiometric formula of Mg0.5+x/2Si2-xAlx(PO4)3 with x = 0.10, 0.15, 0.20 and 0.25. The starting materials were first dissolved separately in
distilled water and then stirred for 1 hour under magnetic stirring at a temperature of 30oC. All of the solutions were mixed together and stirred in a reflux system at 70oC for 24 hours to form a homogeneous solution. The solution was taken out and then evaporated for at least 7 hours under
magnetic stirring at 80oC. The resulting wet gel was dried in a vacuum oven at 150oC for 24 hours to remove water particles and resistance organic. The obtained powder was heated at
2.2 Characterization techniques
The X-ray powder diffraction analysis was carried out using PANalytical-X’pert3 X-ray diffractometer with Cu-Kα radiation of wavelength of 1.5406Å in 2θ range from 10o to 40o. Then, the monoclinic lattice parameters of the samples were calculated using the formula [8]:
ac hl c l b k a h d cos 2 sin sin 1 1 2 2 2 2 2 2 2 2
2 (1)
and sin 2
d (2)
Where d is the distance between crystal planes of (hkl), λ is the X-ray wavelength, θ is the diffraction angle of crystal plane , hkl is the crystal index, a, b and c are the lattice parameters and β is the angle between a and c. A Zeiss-Evo MA10 scanning electron microscope was used
to conduct morphological analysis of the Mg0.5+x/2Si2-xAlx(PO4)3 powders. The particle size information of the ceramic samples was acquired using FRITSCH-Analysette 22 NanoTec laser particle
sizer at room temperature. Complex impedance parameters (i.e. impedance and phase angle parameters) were measured with a computer-controlled SOLATRON 1260 impedance analyser The samples were sandwiched between platinum electrode which served as non-blocking electrodes in a frequency range from 0.1 to 106 Hz. The total conductivity, σt (bulk conductivity, σb + grain boundary conductivity, σgb) which represents the direct current (dc) conductivity in the
ceramic sample was calculated using the equation:
gb b
t
1 1
1
where b b AR d
and
gb gb AR d
In these equations, d is the sample thickness, A is the cross-sectional area of the sample, Rb is the bulk resistance and Rgb is the grain boundary resistance. Ac conductivity has been evaluated from dielectric data in accordance with the relation:
ac o "tan (4)
where εo is the permittivity of the free space (8.854 × 10⁻¹⁴ F cm-1), 2f , ε'’ is the dielectric
loss and tan is the loss tangent factor. The electrochemical stability of the studied samples was
evaluated by LSV using Wnatech ZIVE MP2 multichannel electrochemical workstation. The samples were placed between two stainless steel blocking electrodes and a potential current of
0.5 V was applied in order to polarize them. The current was then monitored as a function of time until it reached a steady state condition.
3. RESULT AND DISCUSSION
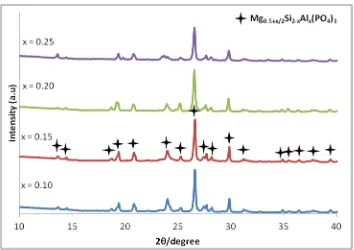
There are synchronizations between the result of lattice parameters, crystallite size, density and volume of the samples which increase with the increase of x as shown in Table 1.
The increase in the unit cell volume is attributed to the larger atomic size of Al3+ thanSi4+ and due to the existing of additional interstitial Mg2+ ion after successfully partial substituted process in the samples [9]. Meanwhile, the increase in the crystallite size is due to the grain growth process on the samples [10, 11]. This confirm that the Mg-ion interstitial affected the structures of the ceramic compounds.
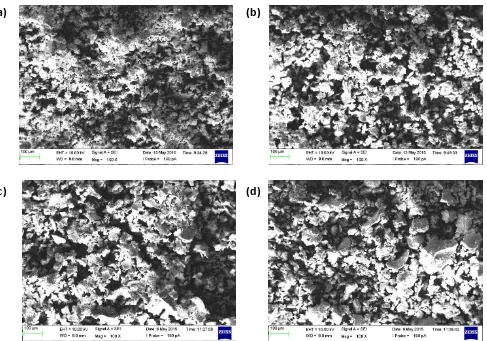
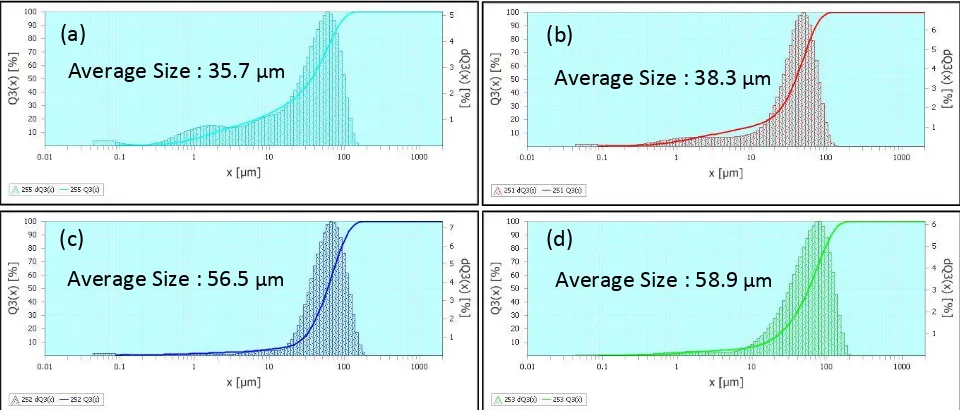
SEM micrographs and particle size distributions of the Mg0.5+x/2Si2-xAlx(PO4)3 (x = 0.10, 0.15, 0.20 and 0.25) samples are displayed in Figure 2 and Figure 3 respectively. SEM
micrographs show that the particle size increases from x = 0.10 to x = 0.25. Meanwhile, Figure 3 clearly shown that the size of the particles in Mg0.5+x/2Si2-xAlx(PO4)3 samples increases with the increase of x. As the x increases, the average size of the particles in the Mg0.5+x/2Si2-xAlx(PO4)3 samples increases from 35.7 μm to 58.9 μm.
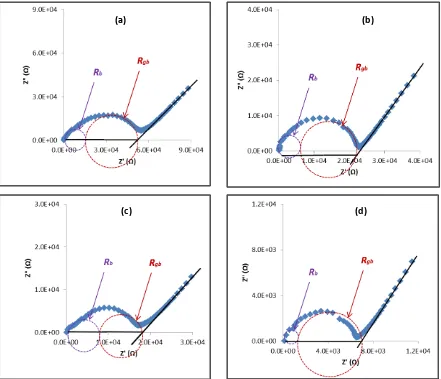
The impedance plots of the Mg0.5+x/2Si2-xAlx(PO4)3 (x = 0.10, 0.15, 0.20 and 0.25 ) samples are shown in Figure 4. The impedance plot for every sample consists of two overlapping semicircles with a titled spike at low frequency region. The high-frequency semicircle is ascribed to bulk response with its intercept at the x-axis attributed to bulk resistance, Rb, while the middle frequency semicircle is associated to grain boundary response with its intercept at the x-axis corresponding to grain boundary resistance, Rgb [12]. On the other hand, the spike that can be clearly seen at the low frequency region of the spectra indicates the effects of electrode polarization as a result of accumulation of ions between electrode and samples [13].
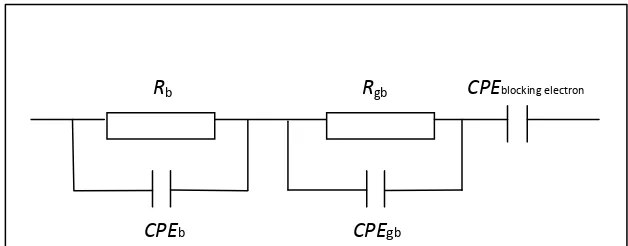
impedance of an equivalent circuit consisting of bulk resistance (Rb), grain boundary resistance (Rgb), bulk, Cb (CPE), grain boundary capacitance Cgb (CPE) and CPE blocking electrode as shown in Figure 5. Table 2 lists direct current conductivity values of all Mg0.5+x/2Si2-xAlx(PO4)3 samples calculated using equation 3. The conductivity increases consistently from x = 0.10 to x =
0.25. The sample with x = 0.25 gives the highest bulk conductivity with value of 1.54 × 10⁻⁴ S cm-1 at ambient temperature which is an order of magnitude higher compared to that of the parent compound, Mg0.5Si2(PO4)3 as reported in [4]. This demonstrates that insertion Al3+ slightly increases the conductivity of this compound by producing additional interstitial Mg2+ ion which increases the number and mobility of ion.
Figure 6 presents the graph of log σ(ac) versus log ω for the Mg0.5+x/2Si2-xAlx(PO4)3 ( x = 0.10, 0.15, 0.20 and 0.25) samples. The plot can be divided into three regions; the low-frequency, intermediate frequency and high frequency regions. The spectra exhibit a spike in
low-frequency region due to the polarization effects where the blocking of ions between the sample and electrode occurs. There is a plateau at the intermediate frequency region and
extrapolating it to the y-axis gives the value of direct current conductivity, σdc [14-15]. In this region, the conductivity is frequency independent and the σdc values are found to be in good agreement with the value listed in Table 2. On the other hand, at high frequency region, the
transition from direct current plateau to alternate current conductivity dispersion occurs.
According Almond and co-workers [16], the ionic hopping ωp can be directly obtained
Figure 6. Using the ωp value, the magnitude of the charge carrier concentration, K can be calculated using the equation as follows [17-18]:
(5)
(6)
where e is electron charge, is correlation factor which is set equal to 1, and is the jump
distance between two adjacent sites for the ions to hope that is assumed to be 3 Å [19]. The density of mobile ions (Mg2+), n, can be determined using Eq. 6, and k is the Boltzmann constant. The ionic mobility, µ can be evaluated using Eq. 7 :
(7) The values of ωp, K, n and μ at room temperature studied for Mg0.5+x/2Si2-xAlx(PO4)3 compounds
are presented in Table 3. The values of K, n and μ increase with the increase in x. This means that the rise in conductivity in the samples can be attributed to the extra Mg2+ interstitial ion which rise in ionic mobility as well as density of mobile ions [19-21].
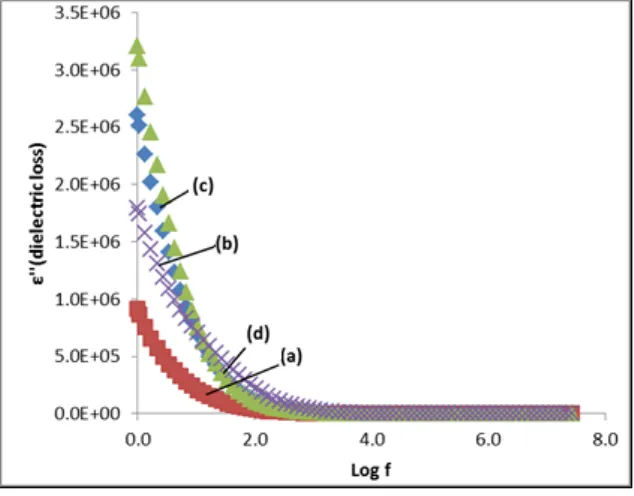
Figure 7 depicts the dielectric constant (ε’) versus log f for different x value of
Mg0.5+x/2Si2-xAlx(PO4)3 samples. At low frequency region, the value of ε’ increases with the increase of x. This is due to the contribution of charge carrier accumulation at the interface of the sample and electrode [19-22]. This ε’ value is greater than the value in parent compound, Mg0.5Si2(PO4)3 as reported in [4]. Its proving that, the substitutions of Al3+ at the Si4+ lattice site (Si4+ ↔ Al3+ + 1/2Mg2+) affected the number of charge carrier in the sample.
region. It’s because, when the x value increase, the large amount of Mg2+ interstitial ions created. The increase of Mg2+ interstitial ions resulting high electrical energy loss due to the migration of ion to the surface of the sample which increase the value of ε”. [19-22].
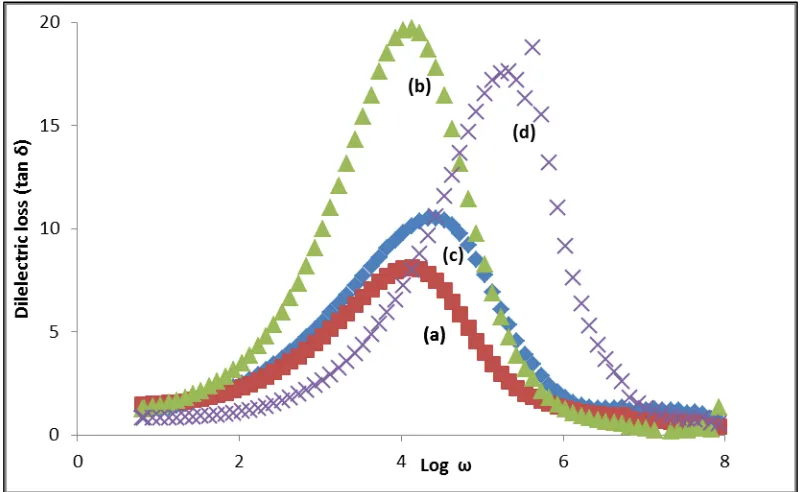
Figure 9 presents the plot of frequency dependence of tan δ = ε”/ ε’ at different x. The
plot shows a peaking behavior for all x. As the x increases, the tan δ peaks are shifted toward
higher frequency. The angular frequency ω (ω=2π fmax) which corresponds to maximum tan δ gives the relaxation times τ, from the relation [21-22].
The relaxation times, τ is inversely proportional to jumping probability P which is expressed as
[21-22]:
The for the samples with x = 0.10, 0.15, 0.20 and 0.25 are 1.71×10³, 2.15×10³, 4.28×10³ and 4.28×10⁴ Hz respectively. The results demonstrate that the ions in the sample x = 0.25 had the highest jumping probability. This value is higher compared to the value in parent compound,
Mg0.5Si2(PO4)3 (3.8 ×10⁴ Hz ) as reported in [4]. Its demostared the extra Mg2+ interstitial ion affected the jumping probability of ions in the sample.
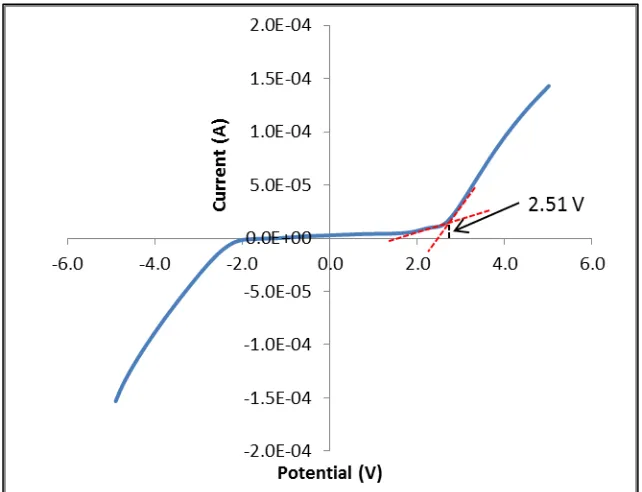
to be 2.51 V. This value is acceptable in magnesium battery since the potential difference between magnesium metal electrodes in less than 0.4 V [23].
4. CONCLUSION
The effects of Mg2+ interstitial ion on the properties of Mg0.5+x/2Si2-xAlx(PO4)3 ceramic electrolytes were studied. The XRD result showed that Al3+ was successfully inserted into the parent Mg0.5Si2(PO4)3 since all the peaks were attributed only to this compound. Meanwhile, the conductivity study on room temperature showed an increasing pattern up to 1.54 ×10⁻⁴ S cm-1. The conductivity parameters such as hopping frequencies, charge carrier concentration and mobile ion concentration proved that the increase in conductivity with x was due to the increase
of Mg2+ interstitial ion . The Mg0.5+x/2Si2-xAlx(PO4)3 sample exhibited a stable voltage window in voltage range of 2.51 V at ambient temperature.
ACKNOWLEDGEMENT
The authors would like to extend their gratitude towards the University of Malaya and Ministry of Education for funding this work through the Fundamental Research Grant Scheme (project no: FP006-2013B), University of Malaya Research Grant (project no: RP013A-13AFR), and Postgraduate Research Grant (project no: PG032- 2015A).
REFERENCES
[2] N. Anuar, S.B.R.S Adnan, N.S Mohamed, Characterization of Mg0.5 Zr2(PO4)3 for potential use as electrolyte in solid state magnesium batteries, Ceramics International, 40 (2014) 13719-13727.
[3] E. Levi, M. Levi, O. Chasid, D. Aurbach, A review on the problems of the solid state ions diffusion in cathodes for rechargeable Mg batteries, Journal of Electroceramics, 22 (2009) 13-19.
[4] Z.A Halim,S.B.R.S Adnan, N.S Mohamed, Effect of sintering temperature on the structural, electrical and electrochemical properties of novel Mg0.5Si2(PO4)3 ceramic electrolytes, Ceramics International, 42, (2016) 4452-4461.
[5] Z. Khakpour, influence of M: Ce4+, Gd3+ and Yb3+ substituted Na3+xZr2xMxSi2PO12 solid NASICON electrolytes on sintering, microstructure and conductivity, Electrochimica Acta,196,(2016) 337-347.
[6] M. Illbeigi, A. Fazlali, M. Kazazi, A. H. Mohammadi, Effect of simultaneous addition of aluminum and chromium on the lithium ionic conductivity of LiGe2(PO4)3 NASICON-type glass–ceramics, Solid State Ionics, 289 (2016) 180–187.
[7] S.B.R.S Adnan, F.M.Salleh, N.S Mohamed, Effect of interstitial Li+ ion and vacant site Li+ ion on the properties of novel Li2.05ZnAl0.05Si0.95O4 and Li1.95Zn0.95Cr0.05SiO4 ceramic electrolytes, Ceramics International, 42, 15(2016) 17941-17945.
[8] S.B.R.S Adnan, N.S Mohamed, Characterization of novel Li 4 Zr 0.06 Si 0.94 O 4 and Li 3.94 Cr 0.02 Zr 0.06 Si 0.94 O 4 ceramic electrolytes for lithium cells, Ceramics International, 40 (2014) 6373-6379.
[9] S.B.R.S Adnan, N. S Mohamed, Effects of Sn substitution on the properties of Li 4 SiO 4 ceramic electrolyte, Solid State Ionics, 262 (2014) 559-562.
[10] F. Wang, Y. Han, C.S. Lim, Y. Lu, J. Wang, J. Xu, H. Chen, C. Zhang, M. Hong, X. Liu, Simultaneous phase and size control of upconversion nanocrystals through lanthanide doping, Nature, 463 (2010) 1061-1065.
[11] C. Xu, J. Tamaki, N. Miura, N. Yamazoe, Grain size effects on gas sensitivity of porous SnO 2-based elements, Sensors and Actuators B: Chemical, 3 (1991) 147-155.
[12] R. Norhaniza, R. Subban, N.S Mohamed, Ion conduction in vanadium-substituted LiSn2P3O12 electrolyte nanomaterials, Journal of materials science, 46 (2011) 7815-7821.
[14] E. Traversa, H. Aono, Y. Sadaoka, L. Montanaro, Electrical properties of sol–gel processed NASICON having new compositions, Sensors and Actuators B: Chemical, 65 (2000) 204-208.
[15] A. Orliukas, A. Dindune, Z. Kanepe, J. Ronis, B. Bagdonas, A. Kežionis, Synthesis and peculiarities of electric properties of Li 1.3 Zr 1.4 Ti 0.3 Al 0.3 (PO 4) 3 solid electrolyte ceramics, Electrochimica acta, 51 (2006) 6194-6198.
[16] D. Almond, G. Duncan, A. West, The determination of hopping rates and carrier concentrations in ionic conductors by a new analysis of ac conductivity, Solid State Ionics, 8 (1983) 159-164.
[17] R. Sobiestianskas, A. Dindune, Z. Kanepe, J. Ronis, A. Kežionis, E. Kazakevičius, A. Orliukas, Electrical properties of Li 1+ x Y y Ti 2− y (PO 4) 3 (where x, y= 0.3; 0.4) ceramics at high frequencies, Materials Science and Engineering: B, 76 (2000) 184-192.
[18] M. Prabu, S. Selvasekarapandian, A. Kulkarni, G. Hirankumar, A. Sakunthala, Ionic conductivity studies on LiSmO2 by impedance spectroscopy, Ionics, 16 (2010) 317-321. [19] S.B.R.S Adnan, N.S Mohamed, Citrate sol-gel synthesised Li4SiO4: conductivity and
dielectric behaviour, Materials Research Innovations, 16 (2012) 281-285.
[20] N. Hegab, A. Bekheet, M. Afifi, L. Wahaba, H. Shehata, Effect of Cd addition on the AC conductivity and dielectric properties of Ge 70 Te 30 films, Journal Ovonic Research, 3 (2007) 71-82.
[21] M. Vijayakumar, G. Hirankumar, M. Bhuvaneswari, S. Selvasekarapandian, Influence of B 2 O 3 doping on conductivity of LiTiO 2 electrode material, Journal of power sources, 117 (2003) 143-147.
[22] S.B.R.S Adnan, N.S Mohamed, Conductivity and dielectric Studies of Li2ZnSiO4 Ceramic Electrolyte Synthesized via Citrate Sol gel Method, International Journal of Electrochemical Science, International Journal of Electrochemical Science, 7 (2012) 9844-9858.
COVER LETTER FOR SUBMISSION MANUSCRIPT
Syed Bahari Ramadzan Syed Adnan, Centre of foundation studies in sciences, University of Malaya,
50603 Kuala Lumpur, Malaysia
Subject: SUBMISSION MASNUSCRIPT
Dear Editor,
I’m closing herewith a manuscript entitled “Effects of Mg2+
interstitial ion on the properties
of Mg0.5+x/2Si2-xAlx(PO4)3 ceramic electrolytes” for publication inyour journal.
Thank You.
Sincerely,
Figure 1:X-ray diffractograms Mg0.5+x/2Si2-xAlx(PO4)3 samples
Figure 2: Cross-sectional SEM micrographs of the Mg0.5+x/2Si2-xAlx(PO4)3 samples with (a) x = 0.10, (b) x = 0.15, (c) x = 0.20 and (d) x = 0.25
(a) (b)
(c) (d)
Figure 3: Particle size distribution of the Mg0.5+x/2Si2-xAlx(PO4)3 samples with (a) x = 0.10, (b) x = 0.15, (c) x = 0.20 and (d) x = 0.25
(a)
Average Size : 35.7 µm
(b)
(c) (d)
Average Size : 56.5 µm
Average Size : 38.3 µm
[image:17.595.73.553.218.423.2][image:18.595.74.515.278.657.2]
Figure 4: Typical complex impedance plots of the Mg0.5+x/2Si2-xAlx(PO4)3 samples with (a) x
= 0.10, (b) x = 0.15, (c) x = 0.20 and (d) x = 0.25
(a) (b)
(c) (d)
Figure 5: Equivalent circuit of Mg0.5+x/2Si2-xAlx(PO4)3 samples based on the impedance analysis of the samples at room temperature
Rb Rgb
CPEb CPEgb
CPEblocking electron
Figure 6: Alternate current conductivity spectra of the Mg0.5+x/2Si2-xAlx(PO4)3 samples with (a) x = 0.10, (b) x = 0.15, (c) x = 0.20 and (d) x = 0.25
Figure 7: Plot of dielectric constant (ε’) as a function of log f of the Mg0.5+x/2Si2-xAlx(PO4)3 samples with (a) x = 0.10, (b) x= 0.15, (c) x = 0.20 and (d) x = 0.25
Figure 8: Plot of dielectric loss (ε”) as a function of log f for the Mg0.5+x/2Si2-xAlx(PO4)3 samples with (a) x = 0.10, (b) x = 0.15, (c) x = 0.20 and (d) x = 0.25
Figure 9: Frequency dependence of tan δ for the Mg0.5+x/2Si2-xAlx(PO4)3 samples with (a) x =
[image:23.595.98.498.72.318.2]Figure 10: Linear sweep voltammogram of the Mg0.5+x/2Si2-xAlx(PO4)3 samples with x = 0.25 with a sweep rate of 50 mV s-1
Table 1: Lattice parameters, unit cell volume, crystallite size and density of Mg0.5+x/2Si2-xAlx(PO4)3 samples
Samples α(Å) b (Å) c (Å) V (Å3) Crystallite
size (Å)
x = 0.10 6.707 5.750 12.433 479.496 86.299
x = 0.15 6.720 5.755 12.456 481.687 115.100
x = 0.20 6.733 5.764 12.501 485.172 115.100
[image:25.595.68.546.137.283.2]x = 0.25 6.740 5.774 12.524 487.327 138.099
Table 2: The σb, σgband σt of Mg0.5+x/2Si2-xAlx(PO4)3 samples at ambient temperature
Sample x σb(S cm-1) σgb(S cm-1) σt(S cm-1)
Mg0.5+x/2Si2-xAlx(PO4)3 0.10 1.27×10⁻⁵ 5.11×10⁻⁶ 3.65×10⁻⁶
0.15 2.94×10⁻⁵ 1.17×10⁻⁵ 8.37×10⁻⁶
0.20 2.52×10⁻⁵ 1.86×10⁻⁵ 1.07×10⁻⁵
0.25 1.54×10⁻⁴ 3.39×10⁻⁵ 2.78×10⁻⁵
Table 3: Value of ωp, K, n and µ at room temperatures for Mg0.5+x/2Si2-xAlx(PO4)3 samples
Sample ωp
(Hz)
K
(S cm-1 K Hz-1)
n×1023
(cm-3)
µ
(cm2 V-1 s-1)
x = 0.10 2.69×10⁶ 4.11×10⁻¹⁰ 1.54 1.48×10⁻¹⁰
x = 0.15 3.39×10⁶ 7.48 ×10⁻¹⁰ 2.80 1.87×10⁻¹⁰
x = 0.20 4.27×10⁶ 7.60×10⁻¹⁰ 2.84 2.35×10⁻¹⁰
x = 0.25 2.27×10⁷ 7.97×10⁻¹⁰ 7.39 2.35×10-09