Performance Analysis of Clustering Algorithms in
Data Mining
Deepika Sharma1, Sandeep Mehla2
1M.Tech CSE Deptt. Kurukshetra University,
2Deptt. CSE
Kurukshetra University
Abstract:Clustering is a primary data description method in data mining which group’s most similar data. The data clustering is an important problem in a wide variety of fields. Including data mining, pattern recognition, and bioinformatics. There are various algorithms used to solve this problem. This paper presents the comparison of the performance analysis of Fuzzy C mean (FCM) clustering algorithm and compares it with Hard C Mean (HCM) algorithm on Iris flower data set. We measure Time complexity and space Complexity of FCM and HCM at Iris data [1] set. FCM clustering [2, 3] is a clustering technique which is separated from Hard C Mean that employs hard partitioning. The FCM employs fuzzy portioning such that a point can belong to all groups with different membership grades between 0 and 1.
Keywords: Data Mining, Fuzzy C Mean, Hard C Mean
1. INTRODUCTION
Clustering algorithm partitions an unlabelled set of data into groups according to the similarity. Compared with the data classification, the data clustering is an unsupervised learning process, it does not need a labeled data set as training data, but the performance of the data clustering algorithm is often much poorer. Although the data classification has better performance, it needs a labeled data set as training data and labeled data for the classification is often very difficult and expensive to obtain. So there are many algorithms are proposed to improve the clustering performance. In this paper, we implement clustering algorithm FCM and HCM in MATLAB. In the first stage, we implement these algorithms and then compare the Time and space complexity of these algorithms. Clustering technique is used for combining observed objects into clusters (groups), which satisfy two main criteria:
Each group or cluster should be homogeneous objects that belong to the same group are similar to each other.
Each group of cluster should be different from other clusters, that is, objects that belong to one cluster should be different from the objects of other clusters.
Clustering can be considered the most important unsupervised learning problem. So, as every other problem of this kind, it deals with finding a structure in a collection of unlabeled data. A loose definition of clustering could be the process of organizing objects into groups whose members are similar in some way. A cluster is
therefore a collection of objects, which are “similar” between them and are “dissimilar” to the objects belonging to other clusters.
There are many clustering methods [11] available, and each of them may give a different grouping of a dataset. The choice of a particular method will depend on the type of output desired, the known performance of method with particular types of data, the hardware and software facilities available and the size of the dataset.
Apart from Section 1, this paper is organized as follows: Section 2 introduces the FCM and HCM clustering algorithm in detail. Section 3 illustrates some implementation results and we conclude the paper in Section 4.
In this section we describe the Hard C Mean and Fuzzy C Mean algorithm.
2.1 Hard C Mean clustering algorithm
In non fuzzy or hard clustering, data is divided into crisp clusters, where each data point belongs to exactly one cluster.
Used to classify data in crisp set
Each data point will be assigned to only one cluster
Clusters are also known as partitions
U is a matrix with c rows and n columns
The cardinality gives number of unique c partitions for n data points
In this clustering technique partial membership is not allowed. HCM is used to classify data in a crisp sense. By this we mean that each data point will be assigned to one and only one data cluster. In this sense, these clusters are also called as partitions that are partitions of the data. In case of hard c mean each data element can be a member of one and only one cluster at a time. In other words we can say that the sum of membership grades of each data point in all clusters is equal to one and in HCM membership grade of a specific data point in a specific cluster is one and in all the remaining clusters its membership grade is zero. Also number of
clusters that is can’t be less than or equal to one and they can’t be equal to or greater than number of data elements
because if number of clusters is equal to one than all data elements will lie-in same cluster and if number of clusters is equal to number of data elements than each data elements will lie in its own separate cluster. That is each cluster is having only one data point in this special case. The steps of HCM algorithm given below.
1. fix c(2<=c<n) and initialize the U matrix
Then for r=0, 1, 2, 3………
2. Calculate the center vectors{ V®with U® }
3. Update U® calculate the updated characteristic function(for a all i,k).
d
d
forallj
c
otherwise
r
ik
r jk r
i
X
) ( )
(
min
,
1
,
0
)
1
(
4. if ||U()r-1)-U®||<=δ(tolerance level)
STOP: otherwise set r=r+1 and return to step 2.In step 4 the notation || || is any matrix norm such as the Euclidean norm. 2.2 Fuzzy C Mean algorithm
Fuzzy C Mean (FCM) is a data clustering [6, 9] technique in which a data set is grouped into n clusters with every data point in the dataset belonging to every cluster will have a high degree of belonging or membership to that cluster and another data point that lies far away from the center of a cluster will have a low degree of belonging or membership to that cluster. The steps of FCM algorithm given below.
1. Fix c and c is (2<=c<n) and select a value for parameter
m’. Initialize the partition matrix U(0). Each step in this
algorithm will be labeled as r, where r=0, 1, 2…………
Vij=
n k m iku
1 ' kjx
n k m iku
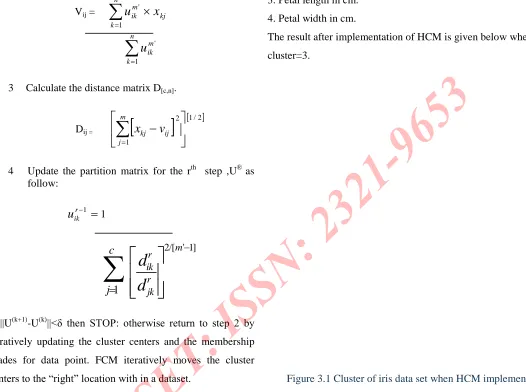
1 '3 Calculate the distance matrix D[c,n].
Dij =
1/2 2 1
m j ij kjv
x
4 Update the partition matrix for the rth step ,U® as follow:
1 r iku
1 1 c j
r 2/[ ' 1]m [image:4.612.44.570.111.503.2]ik r jk
d
d
if ||U(k+1)-U(k)||<δ then STOP: otherwise return to step 2 by iteratively updating the cluster centers and the membership grades for data point. FCM iteratively moves the cluster
centers to the “right” location with in a dataset.
3. Result after implementation of FCM & HCM on Iris Data set:
The implementation of FCM & HCM is done on iris Data set in MATLAB. The data set contains 3 classes of 50 instances each, where each class refers to a type of iris plant. One class is linearly separable from the other two, the latter are NOT linearly separable from each other. The data set contain four attribute which are given below
Attribute Information: 1. Sepal length in cm. 2. Sepal width in cm.
3. Petal length in cm. 4. Petal width in cm.
The result after implementation of HCM is given below when cluster=3.
Figure 3.1 Cluster of iris data set when HCM implemented
Figure 3.2 Clusters of Iris data set when FCM implemented 3.1 Comparison of Time complexity of FCM and HCM
The time complexity of FCM [11] is O(ndc2i) and time complexity of HCM is O(ncdi). Now keeping no. of data points constant, lets assume n=150, d=2, i=10 and varying no. of clusters, we obtain the following table and graph. Where n= number of data point, c= number of cluster, d= dimension, i= number of iteration.
Table 3.1 Time Complexity when Number of cluster varying S.No. Number
of Cluster
FCM Time Complexity
HCM Time Complexity 1 1 3000 3000 2 2 12000 6000 3 3 27000 9000 4 4 48000 12000
0 10000 20000 30000 40000 50000 60000
1 2 3 4
Number of Cluster Time Complexity
[image:5.612.24.273.103.375.2]FCM HCM
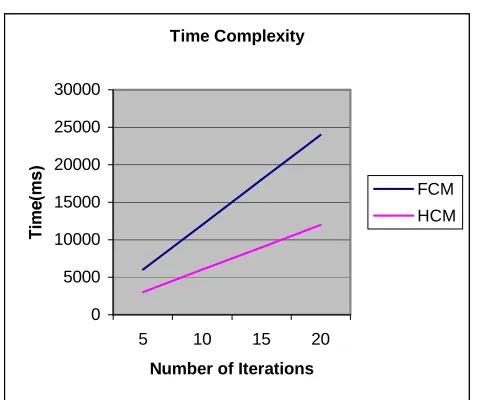
Figure 3.3 Time complexity of FCM and HCM by varying no. of Clusters Now keeping no. of cluster constant, lets assume n=150, d=2, c=2 and varying no. of Iteration, we obtain the following table and graph.
Table 3.2 Time Complexity when Number of Iterations varying S.No. Number
of Iteration
FCM Time Complexity
HCM Time Complexity 1 5 6000 3000 2 10 12000 6000 3 15
Time Complexity
0 5000 10000 15000 20000 25000 30000
5 10 15 20
Number of Iterations
FCM HCM
Figure 3.4 Time complexity of FCM and HCM by varying no. of Iterations
3.2. Comparison of space complexity of FCM and HCM
The space complexity of FCM is O(nd+nc) and HCM is O(cd). Now keeping no. of data points constant, lets assume n=150, d=2 and varying no. of clusters we obtain the following graph.
Table 3.3 Space Complexity when Number of Clusters varying
S.No. Number of Cluster
FCM Space Complexity
HCM Space Complexity
1 5 450 2
2 10 600 4
3 15 750 6
4 20 900 8
0 100 200 300 400 500 600 700 800 900 1000
1 2 3 4
Number of Cluster Space Complexity
[image:6.612.35.274.102.302.2]FCM HCM
Figure 3.4 space complexities of FCM and HCM by varying number of clusters
4. CONCLUSION
In partitioning based clustering algorithms, the number of final cluster (k) needs to be defined beforehand. Also, algorithms have problems like susceptible to local optima, sensitive to outliers, memory space and unknown number of iteration steps required to cluster. The time complexity of the HCM is O(ncdi) The memory complexity of HCM is cd and the input output complexity will be O(ndi). Fuzzy clustering, which constitute the oldest component of soft computing, are suitable for handling the issues related to understandability of patterns, incomplete/noisy data, mixed media information and human interaction, and can provide approximate solutions faster. They have been mainly used in discovering association rules and functional dependencies and image retrieval. The time complexity of the Fuzzy C Mean algorithm is O(ndc2i). The memory complexity of FCM is O(nd + nc),and the disk input output complexity will be O(ndi)
REFERENCES
[1.] Wei Wang, Chunheng Wang, Xia Cui, Ai Wang, “A Clustering Algorithm Combine the FCM algorithm with
Supervised Learning Normal Mixture Model”, IEEE
[image:6.612.315.552.103.334.2][2.] Deepak Agrawal “Web Data Clustering using FCM and Proximity Hints from Text as well as
Hyperlink-structure”, IEEE 2008.
[3.] M. Brej and M. Sonka, “Object localization and border detection criteria design in edge-based
image segmentation automated learning from
examples”, IEEE Transactions on Medical imaging, vol. 19, pp. 973-985, 2000.
[4.] S. Chen and D. Zhang, “Robust image
segmentation using FCM with spatial constraints
based on new kernel-induced distance measure”, IEEE Transactions on Systems, Man and Cybernetics, vol. 34, pp. 1907-1916, 1998. [5.] O. Sojodishijani, V. Rostami and A. R. Ramli,
“Real time color image segmentation with
non-symmetric Gaussian membership functions”,
Fifth International Conference on Computer Graphics, Imaging and Visualization, pp. 165-170, 2008.
[6.] M. S. Yanp, K.L. Wu and J. Yub, “A novel fuzzy
clustering algorithm”, IEEE International Symposium on Computational Intelligence in Robotics and Automation, vol. 2, pp. 647- 652, 2003.
[7.] L. Hui, “Method of image segmentation on high-resolution image and classification for land
covers”, Fourth International Conference on Natural Computation, vol. 5, pp. 563-566, 2008.
[8.] D. L. Pham, “Spatial models for fuzzy clustering”, Laboratory of Personality and Cognition, Gerontology Research Center, 2001.
[9.] R. J. Almeida and J. M. C. Sousa, “Comparison of
fuzzy clustering algorithms for Classification”,
International Symposium on Evolving Fuzzy Systems, pp. 112-117, 2006.
[10.] M. Alata, M. Molhim, and A. Ramini, “Optimizing
Fuzzy C Means clustering algorithm using GA”,
Proceedings of World Academy of Science, Engineering and Technology,vol. 29, 2008.
[11.] Prodip Hore, Lawrence O. Hall, and Dmitry B. Goldgof
“Single Pass Fuzzy C Means”,CSEEE, vol. 28, 2000. [12.] T. Saegusa and T. Maruyama, “Real-time segmentation
of color images based on the k-Means clustering on
FPGA”, International Conference on Field-Programmable Technology, pp. 329-33, 2007.
[13.] P. F. Felzenszwalb, D. P. Huttenlocher, “Efficient
graph-based image segmentation”, International Journal of Computer Vision, vol. 59, pp. 167 – 181, 2004.
[14.] H. Ichihashi, K. Honda, N. Kuwamoto and Takao Hattori, “Post-supervised Fuzzy C means classifier