Technology (IJRASET)
Delamination analysis using digital image
processing by IMAGE J and LabVIEW for drilling
on GFRP composite laminates
GokulaKrishnan Velu
1, Sureshkumar Manickam Shanmugasundaram
2, Chanthini Velu
3 1,2Department of Mechanical Engineering, Sri Ramakrishna Engineering College, Coimbatore, India3
Department of computer science, PSG College, Coimbatore, India
Abstract: Composites are one of the most widely used materials because of their relative ease of combination with other materials to serve specific purposes and exhibit desirable properties. Composites are mostly used in aerospace vehicles due to, increased strength, durability, corrosion resistance, and high strength to weight ratio. Glass Fiber Reinforced Plastic composites have an increased application in recent days. Drilling of holes in GFRP becomes almost unavoidable in fabrication and assembly of components even though heterogeneous nature of this kind of materials makes complications during machining operations. While drilling GFRP the quality of drill is mostly affected by many whole quality characteristics like delamination, cylindricity, surface roughness etc. About 60% of rejections in the drilled components are due to delamination, which is one of the significant hole quality characteristics. Proper Visualization of delamination is obtained by Digital Image Processing. In this work delamination analysis was attempted using digital image processing, experiments are carried out for 27 holes and it was observed that scanned images obtained using a flatbed scanner (HP, 2400 DPI) used for digital image processing by IMAGE J & LabVIEW, gives better visualization for delamination.
Index terms: GFRP, Drilling, Delamination, LabVIEW, ANOVA,Taguchi methodology, F u l l factorial Method.
I. INTRODUCTION
Technology (IJRASET)
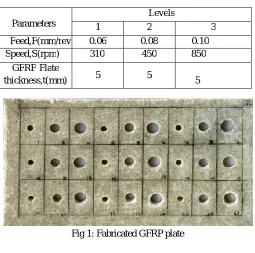
II. DESIGN OF EXPERIMENTPillar drilling has been used for experimental work for drilling 27 holes. Three different diameters of drills has been used with point angle 118˚. Composite laminates are made from cross-ply glass fiber. The reinforcement was in the form of E-glass fiber tape and the matrix was polyester resin, with hardener HY 951.The specimen plates are cut into the same pieces of dimension 15cm×5 cm. 3 layers make the plate thickness of 5mm. Fiber volume fraction is 0.56–0.60 and specimen having a density valued 3.6-3.8gm/m3.The speed, feed rate are the two parameters under investigation in this study. The full factorial design is the most efficient way of conducting the experiment for that three factors and each factor at three levels of experiments is used. Hence as per Levelsfactor (factors to power of levels) formula =Levelsfactors ,N = 33 = 27, N- Number of experiments. The selection process input parameters of three different levels is detailed in Table 1.
[image:3.612.181.436.223.476.2]Table 1: Input parameters for different levels
Fig 1: Fabricated GFRP plate
III. DIGITAL IMAGE PROCESSING
The digital image processing is eminently used for image analysis, the digital images of GFRP composites are obtained from the flatbed scanner (HP Scanjet 3200c of 1300 DPI capacity), then the images were analyzed using IMAGE J & LabVIEW- (National Instruments) to finding the damage area of the GFRP specimens.
In this process both entry and exit of 27 holes were analyzed and the damage area was found out and adjustable delamination factor (Fda) is calculated by the formulae given below,
…. (1) …. (2)
.. (3)
The equation (1) is used to find the maximal damaged area of the drilled composites, the equation (2) gives the actual area of the hole, The final formulae (3) evaluates the value of Fda after calculating the damage area (Ad)using digital image processing.
Parameters
Levels
1 2 3
Feed,F(mm/rev 0.06 0.08 0.10
Speed,S(rpm) 310 450 850
GFRP Plate
Technology (IJRASET)
2[i] (a) (b) (c)
[image:4.612.182.431.83.325.2]2[ii] (a) (b) (c) Fig 2: Image processing operations by [i] IMAGE J,
[ii] LabVIEW to determine the damage are (a) Digital image (b) Intermediate processed image (c) Final processed image.
IV. RESULTS AND DISCUSSION
A. ANOVA
The Analysis of variance is extensively used to analyze the experimental results. ANOVA tests the significance of group difference between two or more groups. The normal probability plot represents that all the points on the plot lie close to the straight line (main line) or not. Versus fits plots represents that how far deviation occur from the normal distribution. An interaction plot is occurs when the change in response from the one level of a factor to another level from change in response at the same two level second factor. A main effect plot is present when different levels of an input affect the responses directly.
Analysis of variation in an experimental outcome and especially of a statistical variance in order to determine the contributions of given factors or variables to the variance. In the ANOVA setting, the observed variance in a particular variable is partitioned into components attributable to different sources of variation. In its simplest form, ANOVA provides a statistical test of whether or not the means of several groups are equal, and therefore generalizes the t-test to more than two groups. As doing multiple two-sample t-tests would result in an increased chance of committing a statistical type I error, ANOVAs are useful in comparing (testing) three or more means (groups or variables) for statistical significance.
B. Mathematical Model
The regression equation for predicting adjusted delamination factor Fda at Entry, where D is Drill Diameter, F is feed and S is Speed for IMAGE-J
Fda = 0.766 - 0.0217 dia + 16.3 feed - 0.00111 speed LabVIEW
Fda = 1.19 - 0.0286 dia + 6.37 feed - 0.000420 speed
[image:4.612.41.550.573.786.2]
Technology (IJRASET)
Fig 4: Residual plot for LabVIEW
C. Taguchi Design Methodology
A Taguchi design, or an orthogonal array, is a method of designing experiments that usually requires only a fraction of the full factorial combinations.
An orthogonal array means the design is balanced so that factor levels are weighted equally. Because of this, each factor can be evaluated independently of all the other factors, so the effect of one factor does not influence the estimation of another factor.
In robust parameter design, the primary goal is to find factor settings that minimize response variation, while adjusting
(Or keeping) the process on target. After you determine which factors affect variation, you can try to find settings for Controllable factors that will either reduce the variation, make the product insensitive to changes in uncontrollable (noise) factors, or both.
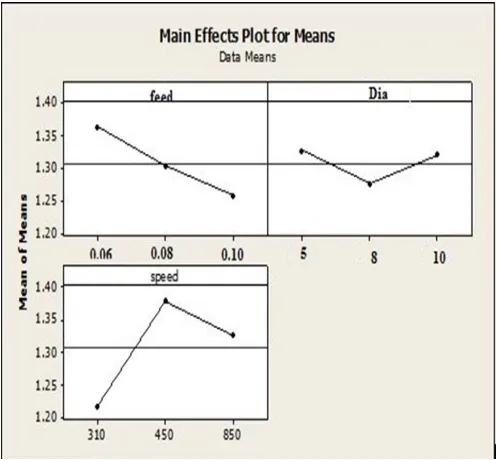
A process designed with this goal will produce more consistent output. A product designed with this goal will deliver more consistent performance regardless of the environment in which it is used. Engineering knowledge should guide the selection of factors and responses. Here diameter of hole, feed & speed are the parameters under investigation as shown in the graph below (figure 5 & 6).
[image:5.612.148.397.441.671.2]In Taguchi design methodology ranking of parameters is done based on the p-values.
Technology (IJRASET)
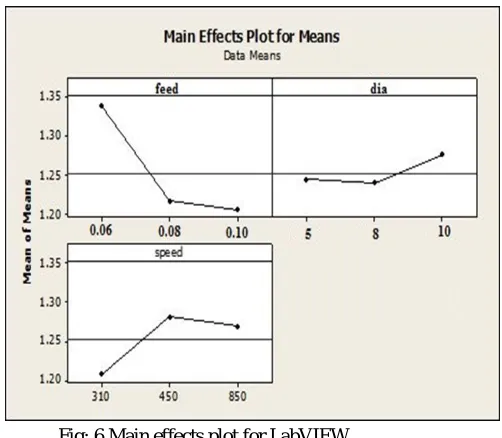
Fig: 6 Main effects plot for LabVIEW
From the above graphs (figure 5 & 6), it is found that Feed is the most influencing parameter among the given input parameters
Technology (IJRASET)
Technology (IJRASET)
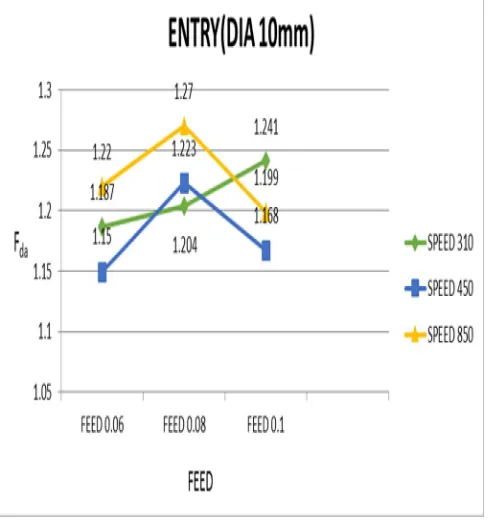
Fig: 7 show the delamination effect for 5mm drill diameter. In this, low feed and low speed gives the better yield for delamination.
[image:9.612.185.429.417.680.2]Technology (IJRASET)
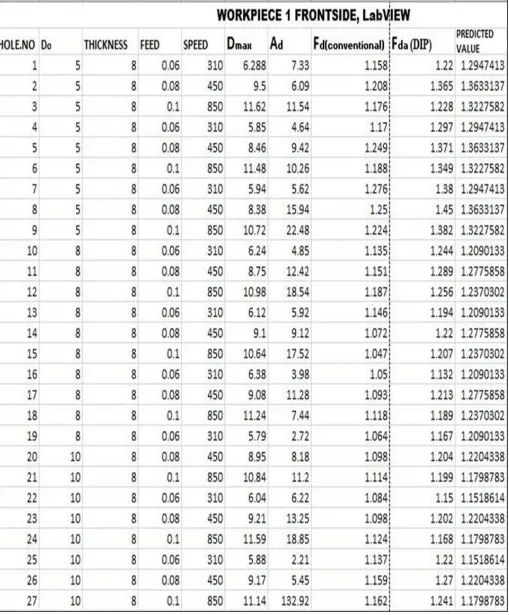
Fig: 10 Correlation between Fd (conventional), Fda (DIP) & Predicted value for 27 Holes
V. CONCLUSION
This experimental investigation shows that delamination of glass fiber reinforced plastic were studied by digital image processing using IMAGE-J & LabVIEW, which was better than conventional method (Dmax/Do).
A. An attempt is made to get the prediction equation for delamination while drilling GFRP composites using HSS drill bits.
B. In this case feed rate is found to be most dominating factor, even though speed and drill diameter are contributing factors.
C. The optimal results for Drilling the composite laminate were found to be at the maximum thickness of laminate, maximum diameter of drill bit, medium speed and low feed to the work piece.
D. The effect of Delamination on the drilled GFRP composites, varies in accordance with change in input parameters.
E. Considering damage area in the Delamination factor which is found out from digital image processing; allows better visualization of the damage caused, indicating digital image processing is more suitable for delamination analysis.
F. Medium speed with low feed gives better hole quality characteristics for medium size diameter drill.
G. The results obtained from IMAGE-j & LabVIEW are found to be in correlation with each other as well as to that from the predicted equation (Regression Equation).
REFERENCES
[1] Subramanian K, Sous-chef NH. Sensing of drill wear and prediction of drill life. Transactions of the ASME, Journal of Engineering for Industry (1997) 99: 295-301.
[2] S. Abrate and D.A. Walton, Machining of composite materials, Part I: Traditional methods, Composite Manufacturing, 3 (2) (1992) 75-83.
[3] C.C. Tsaoa, H. Hocheng, Effect of tool wear on delamination in drilling Composite materials, ELSEVIER-International Journal of Mechanical Sciences 49 (2007) 983–988
[4] DeFu Liu et.al, A review of mechanical drilling for composite laminates, Composite Structures 94(2012) 1265-1279.
[5] Park, J.N., Cho, G.J. (2007). A study of the Cutting Characteristics of Glass Fiber Reinforced Plastics by Drill Tools, International Journal of Precision Engineering and Manufacturing, Vol. 8, 11-15, 2007.
[6] Hocheng H, Tsao CC. The path towards Delamination – free drilling of composite materials. J mater Process Techno 2005; 167:251–64.
Technology (IJRASET)
(Amc225xe), Advanced Materials Research Vols. 622-623 (2013) 1305-1309.[8] Vijayan krishnaraj et.al, optimization of machining parameters at high speed drilling of carbon fiber reinforced plastic (CFRP) Laminates, composites: Part B: Engineering 43(4) (2012) 1791-1799.
[9] Davim JP, Reis P. Study of Delamination in drilling carbon fiber reinforced plastics (CFRP) using design experiments. Compos Struct 2003; 59:481–7. [10] Koenig W, Wulf C, Grass P, Willerscheid H. Machining of fiber reinforced plastics. Ann CIRP 1985; 34(2):536–48.
[11] Hocheng H, Tsao CC. Effects of special drill bits on drilling-induced Delamination of Composite materials. Int J Mach Tools Manuf 2006; 46:1403–16. [12] Sureshkumar manickam shanmugasundaram Experimental investigation and mathematical modelling for Surface Roughness of drilling on GFRP composites,
Applied Mechanics and Materials Vol. 391 (2013)pp 46-50.
[13] Sureshkumar Manickam Shanmugasundaram, Delamination Analysis Using Digital Image Processing for Developing a Prediction Model for Drilling on GFRP Composite Laminates .
[14] Kilickap E. Optimization of cutting parameters on delamination based on Taguchi method during drilling of GFRP composite. J Expert Syst Appl 2010; 37:6116–22.
![Fig 2: Image processing operations by [i] IMAGE J,](https://thumb-us.123doks.com/thumbv2/123dok_us/8583022.861503/4.612.182.431.83.325/fig-image-processing-operations-i-image-j.webp)