A Comparative Analysis of Techniques for Forecasting
Electricity Consumption
P. Ozoh
Faculty of Computer Science & Information Technology, University Malaysia Sarawak
S. Abd-Rahman
Faculty of Computer Science&Information
Technology, University Malaysia Sarawak
J. Labadin
Faculty of Computer Science & Information Technology,
University Malaysia Sarawak
M. Apperley
Department of Computer
Science University of Waikato
New Zealand
ABSTRACT
The issue of obtaining reliable forecasting methods for electricity consumption has been widely discussed by past research work. This is due to the increased demand for electricity and as a result, the development of efficient pricing models. Several techniques have been used in past research for forecasting electricity consumption. This includes the use of forecasting, time-series technique (FTST) and artificial neural networks (ANN). This paper introduces a modified Newton’s model (MNM) to forecast electricity consumption. Forecasting models are developed from historical data and predictive estimates are obtained. This research work utilizes data from Universiti Malaysia Sarawak, a public university in Malaysia, from 2009 to 2012. The variables considered in this research include electricity consumption for different months over the years.
Keywords
Electricity consumption, electricity forecasting, time-series, artificial neural networks, modified newton’s method, historical data.
1.
INTRODUCTION
Electricity is a key energy source in each country and an important condition for economic development. A reliable forecast of energy consumption represents a starting point in policy development and improvement of production and distribution facilities [1]. Results obtained from past research suggest that total electricity demand will vary according to temperature response across different climatic zones, which allows for differential effects of days with different mean temperatures on households’ electricity consumption [2]. It studies the impact of higher temperatures on residential electricity consumption for different climatic zones. [3] examines the development and analysis of a stochastic model predictive control (SMPC) strategy for building climate control that takes into account the uncertainty due to the use of weather predictions. It discusses how these models can increase the energy efficiency in integrated room automation (IRA) while respecting occupant comfort. The study indicates that there is a significant energy savings potential for model predictive control (MPC). [4] seek to determine the long-run equilibrium relationship between carbon emissions, energy consumption, and real output for Brazil over the period between 1980 and 2007. The study postulates that the models developed have a strong forecasting performance with prediction error less than 3%.
A research to undertake a broad examination of monthly residential electricity demand for a region of the mid-Atlantic
was carried out using Excel and step-wise regression [5]. It investigates the seasonal effects on electricity demand. Forecasting models for electricity demand and the predictive power of derived models are assessed. The paper proposes that any method could be used to effectively develop forecasts for residential electricity usage, however advises that the method with the smallest percentage error should be selected. [1] predicts the electricity consumption covering an area in Serbia using Holt-Winters method. The research postulates that the introduction and proper choice of a new technique in predicting electricity consumption is expected to provide more reliable forecasts. A study where grey forecasting method is applied to predicting the operating energy performance for an air cooled water chiller (ACWC) units is applied to building heating ventilation and air conditioning (HVAC) installations [6]. In the paper, the use of grey forecasting in energy management systems (EMS) for air conditioning and refrigeration systems is assessed and comparisons with the prediction method based on artificial neural network (ANN) is discussed. [7] compared the performance of three forecasting methods-autoregressive integrated moving average (ARMA), artificial neural network (ANN) and multiple linear regression (MLR) to formulate prediction models of electricity demand. Although the results based on error measurements showed that ANN model was superior to other approaches; paired tests pointed out that there was no significant difference among these errors for the methods. [8] presents the use of a multi-layer feed forward (FF) artificial neural network trained with Back propagation (BP) algorithm to half hourly ahead load and ahead price prediction by using historical weather , load consumption, price and calendar data. The available data of Australia’s New South Wales (NSW) states were used for testing the ANN and tested against the performance of multiple regression models. The estimation of Turkey’s energy demand with a hybrid model (HAP) is compared with particle swarm optimization (PSO) and ant colony optimization (ACO) via considering gross domestic product (GDP), population, import and export socio-economic indicators [9]. From obtained results, the relative estimation error of the proposed energy demand HAPE model is lowest and provides better-fit solutions. [10] provides a hybrid method, which is a combination of autoregressive integrated moving average (ARIMA) and artificial neural network (ANN) for predicting short-term electricity prices using different seasons.
multiple regression models and it was discovered the performance of the IGMMRM is higher than other two models based on historical data. The local kernel regression (ELKR) is introduced by [12] and how it can be parallelized for large-scale decentralized smart grid scenarios, it can be applied to a new and expensive training process if the data archive is changed. The assignment to local models saves computations, as only the kernel regression model with the closest codebook vector is taken into account for prediction. ELKR has shown significantly higher accuracies than common kernel regression or back-propagation, and competitive results compared to linear multiple regression (LMR). The performance of forecasting techniques to formulate prediction models for electricity consumption is an essential key factor for the development of any country [13]. This is achieved if demand for electricity is predicted accurately. Energy analysts need exquisite guidelines to choose the most appropriate predictive technique in order to provide accurate forecasts of electricity consumption trends.
This paper presents the use of MNM technique to predict electricity consumption considering historical data from Universiti Malaysia Sarawak; by considering data from 2009 to 2012. The real data consists of electricity consumption measurements taken during different months for the respective years. The remainder of this paper is organized as follows: Section 2 outlines the models used; Section 3 discusses the empirical analysis and results and the last section summarizes and concludes the paper.
2.
MODELS
In past research work, traditional methods have been used to estimate and forecast for future values. Some of them include forecasting, time-series technique and artificial neural networks.
2.1
Forecasting, Time-series Technique
FTST is a commonly used method for predicting data because of the high degree of uncertainty involved in the process. This research will investigate electricity consumption for different months by using FTST method. In applying this procedure, new estimates of electricity consumption is considered to be the dependent variable, while actual electricity consumption for different months will be considered as independent variables.FTST can be represented as the following [5]:
(1) where to are electricity consumed for different months. The X’s denote independent variables while the Y denotes the dependent variable. The term denotes the random variation in the time-series not accounted for by the model. Since the values of are assumed to vary randomly, the expected value of is 0. (1) represents the line passing through the time-series that minimizes the sum of squared differences between actual values ( and the estimated values ( ).
2.2
Artificial Neural Networks
(2)
where is the output of node j, f(.) is the transfer function, the connection weight between node j and node i in the lower layer and is the input signal from the node i in the lower layer to node j.
For data analysis, the input variables consists of electricity consumed for the different months over the years 2009-2012, while the output variable is measured in KWh.
2.3
Modified Newton’s method
An MNM technique is introduced in this study for forecasting electricity consumption data. It is obtained by combining standard error (SE) estimates with Newton’s method (NM) algorithm. NM is used to estimate the roots of a function f(x) using an iterative process. It utilizes the unconstrained non-linear optimization technique for generating reliable estimates which are used for developing error corrector models used in forecasting. For a multivariate function, it attempts to find a minimum of a scalar function of several variables, starting at an initial estimate.
It can be expressed as follows[15] :
For f(x) a polynomial, the Taylor series of f(x) about the point
is given by
(3)
Keeping terms only to first order,
(4)
Equation (4) can be used to estimate the amount of needed to be closer to the initial guess .
Setting and solving for (4) for gives
(5) By letting , calculating a new , and so on, the process can be repeated until it converges to a fixed point(which is a precise root) using
(6)
with a good starting point the algorithm can be applied iteratively to obtain
(7)
for n=1,2,3,……..an initial point that provides safe convergence of NM is called an approximate zero.
For the forecasting process, MNM is used to obtain electricity consumed and can be expressed as:
where and are the tth predicted and actual values respectively and n is the total number of data. It adopts the SE as a predictor corrector. Theoretical and empirical findings suggest that combining different methods can be an effective and efficient way to improve forecasts. Furthermore, in forecasting electricity consumption using causal relationships, estimates should be taken into consideration [10].
3.
EMPIRICAL ANALYSIS AND
RESULTS
This research work utilizes a 48-month data set from 2009 to 2012 as input data to construct predictive models. Forecasts for monthly values of 2013 are subsequently computed. The electricity consumption data used in the analysis and computations were drawn from a local university in Sarawak, Malaysia. The results were obtained through MATLAB programming, Excel and SPSS for windows 16.0 software.
[image:3.595.317.559.69.200.2]3.1
Actual Electricity Consumption Data
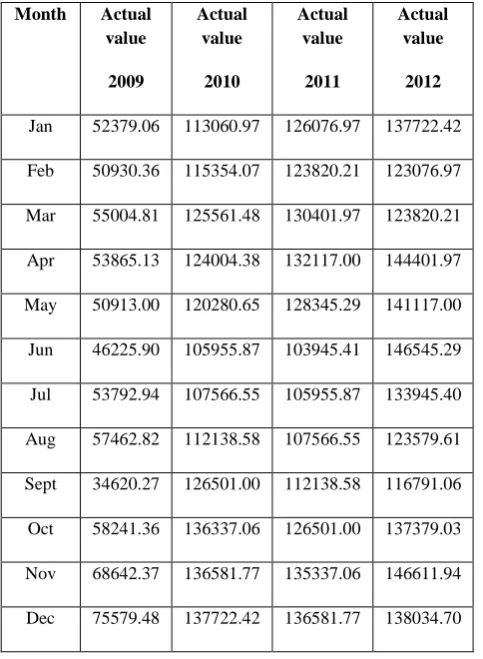
The actual values of electricity consumption data is presented in Table 1.Table 1. Actual Values for Electricity Consumption
Month Actual
value
2009
Actual value
2010
Actual value
2011
Actual value
2012
Jan 52379.06 113060.97 126076.97 137722.42
Feb 50930.36 115354.07 123820.21 123076.97
Mar 55004.81 125561.48 130401.97 123820.21
Apr 53865.13 124004.38 132117.00 144401.97
May 50913.00 120280.65 128345.29 141117.00
Jun 46225.90 105955.87 103945.41 146545.29
Jul 53792.94 107566.55 105955.87 133945.40
Aug 57462.82 112138.58 107566.55 123579.61
Sept 34620.27 126501.00 112138.58 116791.06
Oct 58241.36 136337.06 126501.00 137379.03
Nov 68642.37 136581.77 135337.06 146611.94
[image:3.595.48.290.321.651.2]Dec 75579.48 137722.42 136581.77 138034.70
Fig.1: Comparison for actual electricity consumption between Jan-Dec 2009 to 2012
From Figure 1, electricity consumption pattern for 2009 to 2012 are similar. For these years, there is an increment in actual consumption, except the months of May to August, where there is a decline. This decrease is due to students been on vacation for these months; hence there is a decrease in the amount of electricity consumed.
3.2 Forecasts for Electricity Consumption
In order to obtain an accurate and reliable technique for forecasting electricity consumption, this research investigates past techniques; (a) FTST (b) ANN methods and (c) proposes a new technique, MNM method for predicting electricity consumption. This research utilizes recordings from electricity consumed in the University Malaysia Sarawak.The actual values and forecasts of the presented models are presented in Table 2.
Table 2. Forecasted Values
Month FTST
values 2013
ANN values 2013
MNM values
2013
Jan 166064.31 187789.54 146138.19 Feb 148853.55 163016.92 133897.60 Mar 149978.76 155756.94 136606.20 Apr 171750.85 196313.91 154677.30 May 166088.93 191555.21 151209.50 Jun 162951.05 155493.05 154538.12 Jul 163699.32 176123.92 141206.80 Aug 157402.87 166528.94 131900.02 Sept 122163.27 121633.46 133181.70 Oct 164189.15 170427.81 150492.40 Nov 186634.72 197844.36 157272.00 Dec 182676.26 183525.42 148700.79
0 50000 100000 150000 200000
1 3 5 7 9 11
Consumption 2009
Consumption 2010
[image:3.595.309.548.422.615.2]Fig.2: Forecasts compared with actual data by FTST, ANN and MNM
In Figure 2, the starting point for forecasting for 2013 is 2012, for model derived from previous years 2009-2012. When forecasting for 2014, models are obtained from previous years 2009-2013 and 2013 is the starting point, which is the previous year’s forecast. The computations continue until all forecasts for the required years are obtained.
3.3
Forecasts Accuracy
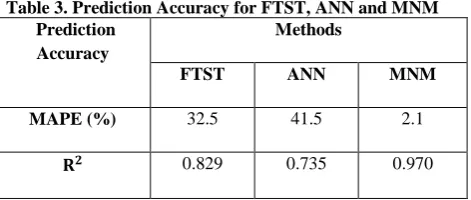
To evaluate forecasting accuracy of the models obtained for MNM, FTST and ANN; actual data is compared with the predicted values obtained in the forecasting process using mean absolute percentage error (MAPE) and the coefficient of determination ( ). A similar study was carried out by [10] to evaluate the accuracy of forecasting electricity prices using the . For MAPE, the lower estimate is more reliable, while a higher is more reliable. The techniques were found to be reliable for determining accuracy for non-linear models. The MAPE function is used to measure the performance the models obtained. The equation is written as:
(11) where is actual value of electricity consumed; is
predicted vale of electricity consumed at month n.
In carrying out predictions for electricity consumption, the method with the smallest MAPE is selected to pick the most accurate and reliable method. In addition, the coefficient of determination between the actual and predicted values for FTST, ANN and MNM were determined as previously described by [10].This is given in Table 3.
Table 3. Prediction Accuracy for FTST, ANN and MNM Prediction
Accuracy
Methods
FTST ANN MNM
MAPE (%) 32.5 41.5 2.1
0.829 0.735 0.970
4.
CONCLUSION AND FUTURE WORK
This research demonstrates the successful application of MNM to forecast electricity consumption. It investigates relationship between predicted values for a current year based on previous year’s estimates. The study considers actual monthly electricity consumption data over the period between 2009 and 2012, so as to access the proposed forecasting models.
There is a big gap in consumption pattern between 2009 and the following years. This is because there was an increase in student’s population and more buildings were erected on campus. This indicates that a population increase and development of more buildings will increase electricity consumption; hence the need for reliable and efficient energy plans in a community. The prediction process builds exponential smoothing models to produce accurate forecasts. These models identify and estimate an appropriate forecast for each variable series. Using the hybrid MNM, forecasting accuracy has increased in which a combination of Newton’s method and error estimates were utilized to improve forecasting performance, with its MAPE = 2.1%, which is the lowest among the techniques used in this research and given to be 0.970, which is an efficient value and shows MNM is a highly reliable prediction technique.
The study show there is a pattern for electricity consumption over the years. Consumption is high at certain periods and low at other periods and shows an upward trend for electricity consumption, except the months of May to August, when students are on holiday and there is a decrease in the use of electricity appliances. Increase in electricity consumption could be due to the fact that more heating, ventilation and air-conditioning (HVAC) systems are put into use be-cause of increase in student’s population. The proposed technique can be referred to as an error corrector model, which is very efficient. Since MNM adjusts model complexity to match the complexity of the failure history by taking into consideration standard error estimates of past data, it can be more accurate than some commonly used predicting techniques. This is found to be true in this research work. For further research, the impact of rainfall, humidity and temperature on electricity consumption would be investigated.
5.
ACKNOWLEDGEMENT
Patrick Ozoh thanks Universiti Malaysia, Sarawak for the Zamalah research study award and the Tertiary Education Trust Fund (TETF) of the Nigerian government both of which have contributed to the development of this research work.
6.
REFERENCES
[1] V. Lepojevi, M. An, “Forecasting electricity consumption by using holt-winters and seasonal regression models,” vol. 8, no. 179066, pp. 421–431, 2011.
[2] M. Auffhammer, A. Aroonruengsawat, “Impacts of Climate Change on San francisco Bay Area Residential Electricity Consumption : Evidence from Billing Data,”
0 50000 100000 150000 200000 250000
1 3 5 7 9 11
El
e
ctr
ic
ity c
o
n
su
m
p
tion
(K
w/h
)
Years
Actual data
FTST
ANN
[image:4.595.51.287.591.691.2]economic growth in Brazil,” 5th Conf. Sustain. Dev. Energy, Water Environ. Syst., vol. 36, no. 5, pp. 2315– 3618, 2011.
[5] J. F. Kros, “Seasonal Influences on Electricity Demand in the Mid-Atlantic Region,” Adv. Bus. Manag. Forecast., no. 8, pp. 13 – 29, 2011.
[6] Y. Jianga, Y. Yaoa, S. Deng, and M. Zuiliang, “Applying grey forecasting to predicting the operating energy performance of air cooled water chillers,” Int. J. Refrig., vol. 27, no. 4, pp. 385–392, 2004.
[7] K. Kandananond, “Forecasting Electricity Demand in Thailand with an Artificial Neural Network Approach,” Energies, vol. 4, no. 12, pp. 1246–1257, Aug. 2011. [8] M. Akole, M. Bongulwar, and B. Tyagi, “Predictive
model of load and price for restructured power system using neural network,” Int. Conf. Energy, Autom. Signal, pp. 1–6, 2011.
[9] K. M. Servet, E. Özceylanb, M. Gündüza, and P. Turan, “A novel hybrid approach based on Particle Swarm Optimization and Ant Colony Algorithm to forecast energy demand of Turkey,” Energy Convers. Manag., vol. 53, no. 1, pp. 75–83, 2012.
[10] G. P. Zhang, P. Areekul, S. Member, T. Senjyu, S. Member, and H. Toyama, “A Hybrid ARIMA and Neural Network Model for Short-Term Price Forecasting in Deregulated Market,” IEEE Trans. Power Syst., vol. 25, no. 1, pp. 524–530, 2010.
[11] X. W. Q. Wang, F. Xia, “Integration of Grey Model and Multiple Regression Model to Predict Energy Consumption,” IEEE Proc., pp. 194–197, 2009.
[12] J. L. O. Kramer, B. Satzger, “Power Prediction in Smart Grids with Evolutionary Local Kernel Regression,” HAIS Part 1 LNAI 6076, pp. 262–269, 2010.
[13] D. N. Moriasi, B. N. Wilson, J. G. Arnold, and P. H. Gowda, “Hydrological and water quality models: Use, calibration and validation,” vol. 55, no. 4, pp. 1241– 1247, 2012.
[14] B. Goh, “Forecasting residential construction demand in Singapore: a comparative study of the accuracy of time series, regression and artificial neural network techniques,” Eng. Constr. Archit. Manag., vol. 5, no. 3, pp. 261–275, 1998.