Munich Personal RePEc Archive
Social Accounting Matrix for Pakistan,
2001-02: Methodology and Results
Dorosh, Paul and Niazi, Muhammad Khan
Pakistan Institute of Development Economics
2006
PIDE Working Papers
2006:9
A Social Accounting Matrix
for Pakistan, 2001-02:
Methodology and Results
Paul Dorosh
The World Bank, Washington, D. C.
Muhammad Khan Niazi
Innovative Development Strategies, Islamabad
and
Hina Nazli
Innovative Development Strategies, Islamabad
2
All rights reserved. No part of this publication may be reproduced, stored in a retrieval system or transmitted in any form or by any means—electronic, mechanical, photocopying, recording or otherwise—without prior permission of the author(s) and or the Pakistan Institute of Development Economics, P. O. Box 1091, Islamabad 44000.
© Pakistan Institute of Development Economics, 2006.
Pakistan Institute of Development Economics Quaid-i-Azam University Campus
Islamabad 45320, Pakistan
E-mail: publications@pide.org.pk Website: http://www.pide.org.pk Fax: +92-51-9210886
ABSTRACT
C O N T E N T S
Page
Abstract v
I. Introduction 1
II. Construction of the 2001-02 Pakistan SAM 1
Structure of the SAM 2
Micro SAM 4
Activity and Commodity Accounts 4
Adjustments in Activity and Commodity Accounts 9
Factor and Household Incomes 12
Household Income 14
Household Consumption and Savings 18
III. The Structure of Household Incomes and Expenditures in
Pakistan: 2001-02 SAM Estimates 19
IV. Conclusions 22
Reference 23
Annexures 24
List of Tables
Table 1. Macro SAM Pakistan 2001-02 5 Table 2. Poultry Share Estimates in Livestock, 1990-91 6 Table 3. Pakistan Value-added, 1990-91 (Million Rs) 8 Table 4. Estimation of Value of Production and Value Addition in
5
Page
Table 5. Comparative Macroeconomic Aggregates (Million Rs) 12 Table 6. Returns to Factors (% Value Added)—Major Crops 13 Table 7. Distribution of Value-added in Selected Sectors (%) 13 Table 8. Estimation of VA Splits in Industry and Service Sectors
(Shares) 15 Table 9. Pakistan: Household Income Shares (2001-02) 17
Table 10. Alternative Consumption Estimates, 2001-02 18 Table 11. Pakistan: Per Capita Income (Expenditures) 2001-02,
(Thousand Rs/Person/Year) 19 Table 12. Pakistan: Household Incomes and Expenditures, 2001-02 20 Table 13. Pakistan: Factor Income Shares by Household Type,
2001-02 21 Table 14. Disaggregated Factor Income Shares by Household Group,
Pakistan 2001-02 22
Table 15. Pakistan Rural Agricultural Incomes 22 Annex Table 1. Mapping between SAM and National Accounts
Production Sectors 24 Annex Table 2. Estimation of Value Additions (Million Rs) 25 Annex Table 3. Value of Production at Market Prices (Million Rs) 27 Annex Table 4. Estimation of Commodity-wise Exports and
Imports in 2001-02 (Million Rs) 28 Annex Table 5. Structure of Economy, Pakistan 2001-02 30 Annex Table 6. Distribution of Value-added in Agricultural
I. INTRODUCTION*
Pakistan’s economy has enjoyed substantial economic growth over the past three decades: per capita real GDP increased by 2.5 percent per annum between 1975 and 2003. The agricultural sector has also performed well, as agricultural GDP increased by an average of 4.1 percent per year from 1975 to 2000. Nonetheless, rural poverty remains high: 38.9 percent of the rural population was poor in 2001-02 (81.0 percent of the total number of poor in Pakistan), and rural poverty rates are approximately the same as those in the early 1990s.
This paper examines the links between agricultural growth and rural poverty by constructing an internally consistent set of accounts for production, incomes and expenditures in a social accounting matrix (SAM). The SAM can be thought of as an extended set of national accounts that disaggregates value added in each production activity into payments to various factors (e.g. land, labour, capital), and disaggregates household incomes and expenditures according to various household types. Given the objective of understanding rural growth and poverty, the Pakistan SAM presented here includes more disaggregation for agricultural activities, factors of production, and rural households. Rural household groups in the SAM are split according to three regions (Punjab, Sindh and Other Pakistan) to capture the large differences in the structure of agricultural production and incomes across Pakistan.
Chapter I of this paper describes the structure of the SAM in detail and the methodology used in constructing the SAM, including major adjustments made to reconcile conflicting data from national accounts and other sources. Chapter III presents the results, focusing on factor payments and household incomes. Details of the SAM construction are included in the annexes.
II. CONSTRUCTION OF THE 2001-02 PAKISTAN SAM
A social accounting matrix (SAM) is a comprehensive, economy-wide set of accounts that quantify economic flows (incomes and expenditures) in an economy for a given period of time (usually one year). Mathematically, a SAM is a square matrix in which each account is represented by a row and a column. Each cell shows the payment from the account of its column to the account of its row. Thus, the incomes of an account appear along its row and its expenditures along its column. The underlying principle of double-entry accounting requires that, for each account in the SAM, total revenue (row total) equals total expenditure (column total).
Four major types of accounts are distinguished in the 2001-02 Pakistan SAM: (a) activities, (b) commodities, (c) factors of production, and (d) institutions (households, government and the Rest of World), including an
7
aggregate institutional savings-investment account. The production accounts describe the values of commodity (goods and services) and inputs into each production activity along with payments to factors of production, (land, labour, water and capital). Commodity accounts show the components of total supply in value terms, domestic production, imports, indirect taxes and marketing margins, and total demand, intermediate input use, final consumption, investment demand, government consumption and exports. Factor accounts describe the sources of factor income (value added in each production activity) and how these factor payments are further distributed to the various institutions in the economy (households of different types, enterprises, government and the Rest of World). Accounts for institutions record all income and expenditures of institutions, including transfers between institutions. Savings of the different institutions and investment expenditures by commodities are given in the savings-investment account.
The year 2001-02 was chosen as the base year for the Pakistan SAM since the last national household expenditure survey (2001 Pakistan Household Income and Expenditure Survey) was conducted in that year. Unfortunately, the most recent available input-output table is for 1990-91, and the published national accounts final demand aggregates and estimates of value added by sector are based on an even earlier input-output table (1985). Thus, as described below, in preparing the 2001-02 Pakistan SAM, it was necessary to construct a consistent set of accounts for production and value added by sector based on the 1991 input-output table. These accounts then formed the base upon which factor and household accounts were disaggregated.
This procedure involved two steps. First, we constructed a “proto-SAM” using the above mentioned data sources. Given that the data came from different years and different sources, the resulting “proto-SAM was, as expected, not balanced (in case of contradictory information on any item we utilised our judgment to choose the most logical value). In the second step, we balanced the SAM by adjusting the factor and household accounts, as described below.
Structure of the SAM
8
Box 1: Structure of the 2001-02 Pakistan SAM
Activities (34)
Agriculture (12): Wheat irrigated, Wheat non-irrigated, Rice-IRRI, Rice-basmati, Cotton, Sugarcane, Other major crops, Fruits and vegetables, Livestock-cattle/dairy, Poultry, Forestry, Fishing
Industry (16): Mining, Vegetable oils, Wheat milling, Rice milling-IRRI, Rice milling-basmati, Sugar, Other food, Cotton lint/yarn, Textiles, Leather, Wood products, Chemicals, Cement/bricks, Petroleum refining, Other manufacturing, Energy
Services (6): Construction, Commerce, Transport, Housing, Private Services, Public services
Commodities (33)
Same as activities with Wheat irrigated and Wheat non-irrigated aggregated as one commodity (Wheat)
Factors (27)
Labour (10): Own-farm (Large farm, Medium farm Sindh, Medium farm Punjab, Medium farm Other Pakistan, Small farm Sindh, Small farm Punjab, Small farm Other Pakistan), Agricultural wage, Non-agricultural unskilled, skilled
Land (12): Large farm (Sindh, Punjab, Other Pakistan), Irrigated medium farm (Sindh, Punjab, Other Pakistan), Irrigated small farm (Sindh, Punjab, Other Pakistan), Non-irrigated small farm (Sindh, Punjab, Other Pakistan)
Other factors (5): Water, Capital livestock, Capital other-agriculture, Capital formal, Capital informal
Households (19)
Rural (17): Large farm (Sindh, Punjab, Other Pakistan), Medium farm (Sindh, Punjab, Other Pakistan), Small farm (Sindh, Punjab, Other Pakistan), Landless farmer (Sindh, Punjab, Other Pakistan), Rural agricultural landless (Sindh, Punjab, Other Pakistan), Rural farm non-poor, Rural non-farm poor
Urban (2): non-poor, poor
9
8 types of agricultural labour, 12 types of land, water, livestock capital and other agricultural capital. This detailed treatment of rural factors and agriculture in the SAM reflects the primary objective of constructing the SAM: to better understand the relationship between agricultural performance and rural income growth in the context of imperfect rural factor markets. Fifteen of the nineteen household categories are rural agricultural households, split according to amount of land cultivated (large farm, small farm, landless) and region (Sindh, Punjab and Other Pakistan). Non-farm households, both rural and urban, are split into poor and non-poor according to their 2000-01 per capita household expenditures, with poor households defined as those with a per capita expenditure of less than 748 rupees/month per capita ( 22.67 percent of urban households). Non-farm rural households form the last household group, accounting for 19.8 percent of total population.1
The SAM uses data mainly from the following sources: • 1990-91 Input-Output Table (97 sectors)
• 2001-02 National Accounts (value added for 15 sectors)
• 2001-02 Pakistan Integrated Household Survey (consumption dis-aggregation)
• 2001 Pakistan Rural Household Survey (household income disaggre-gation)
• 2001-02 Pakistan Economic Survey (sector/commodity data on production, prices, trade).
Macro SAM
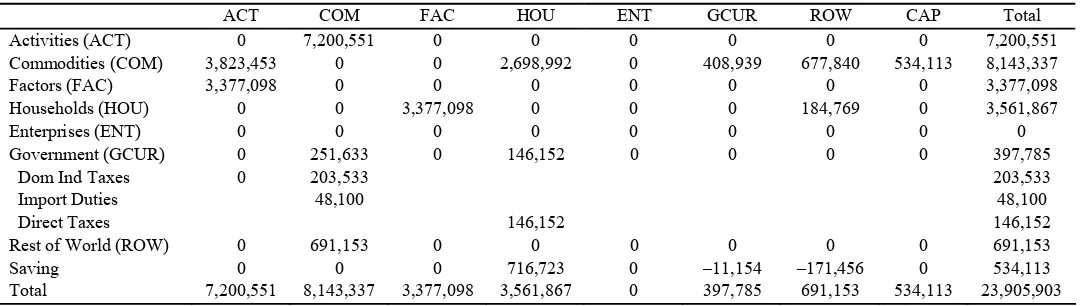
Table 1 presents an aggregate version of the 2001-02 Pakistan SAM. Note that in the SAM all indirect taxes are shown as taxes on commodities.
Activity and Commodity Accounts
The starting points for the production accounts in the SAM were the 2001-02 national accounts (aggregates and value added by sector) and the 1990-91 input output table. The SAM further disaggregates the 15 national account sectors from Statistical Appendix Table 1.1, Pakistan Economic Survey, 2001-02 into 34 by sector using the breakdown of production activities from the 1990-91input-output table (IO91). Mapping between IO91, national accounts and SAM activities is shown in Annex Table 1.
SAM directly uses the 2001-02 national accounts’ figures for value added (VA) in activities of minor crops (fruits and vegetables), fishing, forestry, construction, mining, energy (electricity and gas), trade, transportand
1Non-farm rural households are defined as rural households for which the main occupation
Table 1
Macro SAM Pakistan 2001-02
(Million Rs)
ACT COM FAC HOU ENT GCUR ROW CAP Total
Activities (ACT) 0 7,200,551 0 0 0 0 0 0 7,200,551
Commodities (COM) 3,823,453 0 0 2,698,992 0 408,939 677,840 534,113 8,143,337
Factors (FAC) 3,377,098 0 0 0 0 0 0 0 3,377,098
Households (HOU) 0 0 3,377,098 0 0 0 184,769 0 3,561,867
Enterprises (ENT) 0 0 0 0 0 0 0 0 0
Government (GCUR) 0 251,633 0 146,152 0 0 0 0 397,785
Dom Ind Taxes 0 203,533 203,533
Import Duties 48,100 48,100
Direct Taxes 146,152 146,152
Rest of World (ROW) 0 691,153 0 0 0 0 0 0 691,153
Saving 0 0 0 716,723 0 –11,154 –171,456 0 534,113
communications, housing services, private services, and public administration. The VA in private services includes VA in the financial sector. The other national accounts sectors, i.e. agriculture and manufacturing, are disaggregated into more activities in the SAM. Initial estimates of VA in these activities were calculated using the VA figures in the 1990-91 input-output table (IO91) multiplied by percentage changes in output and price, taken mainly the Pakistan Economic Survey (2002-03). Some variations over this rule were unavoidable for want of usable data, which are described in the following paragraphs. The total VA for each of these national accounts sectors was maintained by calculating residual VA for one or more components, viz. other major crops in agriculture, and other food manufacturing, wood products, chemicals and other manufacturing in the manufacturing sector.
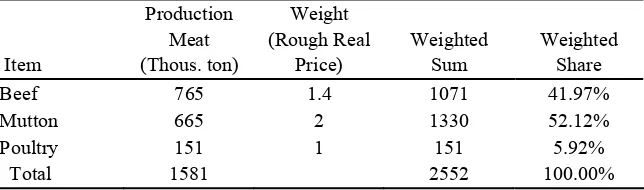
[image:14.612.110.432.424.519.2]Some IO91 sectors have been split to serve the purpose of this SAM. Wheat is one sector in IO91, so the IO91 VA has been split into wheat irrigated and wheat unirrigated in proportion of production of wheat in 1990-91 from these two sources. Similarly IO91 VA in rice has been split into rice irri and rice basmati in proportion of estimated value of production of the two varieties in 1990-91. Poultry is part of livestock sector in IO91, and the IO91 VA in poultry has been separated by applying the estimated share of poultry in livestock sector (see Table 2). The milling sector IO91 VA has been split into three activities, i.e. wheat milling, rice irri milling and rice basmati milling, in proportion of the value of production of wheat, rice irri and rice basmati in 1990-91. These VA estimates have been multiplied by percentage changes in respective outputs and prices to get VA in 2001-02.
Table 2
Poultry Share Estimate in Livestock, 1990 -91
Item
Production Meat (Thous. ton)
Weight (Rough Real
Price)
Weighted Sum
Weighted Share
Beef 765 1.4 1071 41.97%
Mutton 665 2 1330 52.12%
Poultry 151 1 151 5.92%
Total 1581 2552 100.00%
13
index of manufacturing petroleum products and WPI of fuel, lighting and lubricants (more details are given below). Growth in VA in leather products in 1990-2002 is estimated by extrapolation of the growth VA of these products in 1991-1996, based on CMI data. Residual VA in manufacturing sector in 2001-02 has been split into other food, wood products, chemical and other manufacturing on the basis of IO91 VA proportions. Greater details of estimation of VA are given in Annex Table 2.
Initial estimates of intermediate consumption have been derived by multiplying IO91 values by respective activity ratios of 2001-02 VA and IO91 VA. The resulting commodities-activities inputs block needs splitting of some columns and rows to conform to the splits created in some IO91 sectors. Wheat sector input column was split into commodity input columns for activities of wheat irrigated and wheat unirrigated in proportion of wheat output from the two sources in 1990-91. Similar splits have been created: in rice sector column into activities of IRRI rice and basmati rice in proportion to the value of production of IRRI rice and basmati rice in 1990-91; livestock sector column into livestock and poultry activities columns by multiplying it by the estimated shares of the two activities in 1990-91; milling sector into three activities, i.e. wheat milling, IRRI rice milling and basmati rice milling in proportion of the value of production of wheat, IRRI rice and basmati rice in 1990-91. These splits, for rice, livestock and milling sectors, have been reapplied to split these sector rows into the corresponding commodity rows, with restrictions on cross activity input values, of IRRI rice into basmati rice, livestock into poultry, wheat milling into IRRI rice milling, wheat milling into basmati rice milling, IRRI rice milling into basmati rice milling, and vice versa, which have been set at zero.
The total value of production by each activity has then been derived by adding VA to intermediate consumption.
Further adjustments were required for the public administration activity. Using the 1990-91 ratio of total value added to production for the sector resulted in an output of 661.3 rupees, approximately double the figure for total government consumption in the national accounts (331.6 billion rupees). Without an adjustment to intermediate consumption, private consumption of public services would be 320.4 billion rupees (about 10 percent of total national household consumption), far in excess of the 1990-91 estimates. Two adjustments were made. First, intermediate consumption of construction services was dropped, since these are investment expenditures. Second, consumption of manufactured goods (also generally an investment expenditure) was reduced by 130 billion rupees.2 (See the discussion of other adjustments to
2This inconsistency between the 1990-91 input-output coefficients and the 2001-02 national
14
[image:16.612.110.433.163.465.2]manufactured goods accounts.) As a result of these changes, private consumption of public services fell to 3.5 percent of total consumption. Annex Table 3 summarises activity-wise value of production and intermediate consumption.
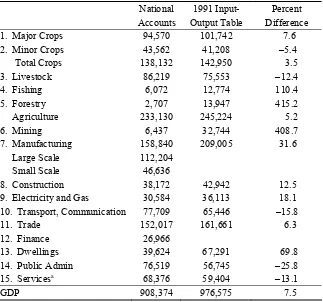
Table 3
Pakistan Value-added, 1990-91 (Million Rs)
National 1991 Input- Percent Accounts Output Table Difference 1. Major Crops 94,570 101,742 7.6 2. Minor Crops 43,562 41,208 –5.4 Total Crops 138,132 142,950 3.5 3. Livestock 86,219 75,553 –12.4 4. Fishing 6,072 12,774 110.4 5. Forestry 2,707 13,947 415.2 Agriculture 233,130 245,224 5.2 6. Mining 6,437 32,744 408.7 7. Manufacturing 158,840 209,005 31.6 Large Scale 112,204
Small Scale 46,636
8. Construction 38,172 42,942 12.5 9. Electricity and Gas 30,584 36,113 18.1 10. Transport, Communication 77,709 65,446 –15.8 11. Trade 152,017 161,661 6.3 12. Finance 26,966
13. Dwellings 39,624 67,291 69.8 14. Public Admin 76,519 56,745 –25.8
15. Servicesa 68,376 59,404 –13.1 GDP 908,374 976,575 7.5
a
Services includes finance sector.
15
surcharge in mining. The figure on subsidies from national accounts has been split on the basis of IO91 proportions. Annex Table 3 also summarises activity-wise domestic indirect taxes and import duties. The figure on total direct taxes has been left as such, as we have no basis to split it.
Exports and imports have been derived from commodity level trade data and for commodities, for which such data was not available, from the shares of these commodities in total exports or imports in the 1991 IO table. The national accounts values of exports and imports of goods have been maintained by calculating residual value of a group of commodities, where exports and imports have been split on the basis of IO91 values. Annex Table 4 gives these calculations along with explanatory notes. The resulting structure of Pakistan’s economy is summarised in Annex Table 5.
Commodity shares of investment and government consumption from the 1991 input-output were used to disaggregate the 2001-02 totals taken from the national accounts. Initial estimates of total household consumption for each commodity were calculated as the residual between total supply and other demand.
Adjustments in Activity and Commodity Accounts
Value added figures in the 1990-91 input-output table do not match those from the national accounts series (see Table 3). The overall difference for total GDP is only 7.5 percent, and the figures for most sectors are within 20 percent. However, the input-output table figures are substantially larger than those of the national accounts for fishing (110 percent), forestry (415 percent) and mining (409 percent). Since the value added figures for major sectors from the national accounts are maintained in the SAM, the implicit growth rates in production (SAM relative to the I-O table) for these three sectors are smaller than in the national accounts and smaller than those for most other sectors. Moreover, because estimated intermediate and final demand for these products increased at approximately the same rate as the growth in output of most other sectors, demand from intermediate consumption, government consumption, investment and exports for these products was far in excess of total supply, necessitating adjustments to these sectors as the residual consumption was negative. Residual estimates of consumption in other sectors were also needed, as described below.
16
Other Manufacturing. Production in other manufacturing is calculated as a residual from industrial value added (from the official GDP accounts) less estimated valued added in other sectors (our own estimates). This estimate of production, combined with estimated imports, results in a total supply that is less than initial estimates of demand. To achieve balance in the other manufacturing commodity account, two adjustments were made to both final demand and to imports, in addition to the reduction in intermediate consumption by the public services activity described above. First, investment spending on other manufacturing was reduced by Rs 70 billion, and investment expenditures on private services were increased to keep total investment unchanged.3 Second, imports of other manufactured goods were also raised by 190 billion from 366 billion (calculated using the 1990-91 IO Table share of other manufactured products in total imports) to 556 billion. With these adjustments, and setting final consumption as the difference between total supply and other demand, the share of other manufactured products in total final consumption share is 5.9 percent (compared to 5.8 percent in the 1990-91 IO Table).
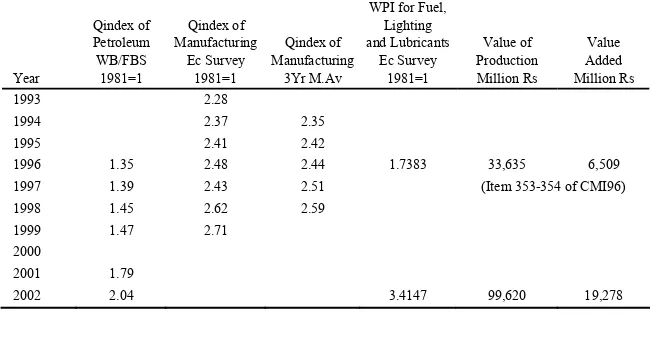
[image:18.612.107.434.383.554.2]Petroleum and Mining. VA and value of production in the petroleum-refining sector were estimated by using CMI 96 VA and the growth in quantum index of manufacturing petroleum products and WPI of fuel, lighting and lubricants.4 These calculations are shown in Table 4. As in the case of other manufactured products, intermediate demand for crude petroleum andmining
Table 4
Estimation of Value of Production and Value Addition in Petroleum Refining
Year Qindex of Petroleum WB/FBS 1981=1 Qindex of Manufacturing Ec Survey 1981=1 Qindex of Manufacturing 3Yr M.Av
WPI for Fuel, Lighting and Lubricants Ec Survey 1981=1 Value of Production Million Rs Value Added Million Rs 1993 2.28
1994 2.37 2.35
1995 2.41 2.42
1996 1.35 2.48 2.44 1.7383 33,635 6,509
1997 1.39 2.43 2.51 (Item 353-354 of CMI96)
1998 1.45 2.62 2.59 1999 1.47 2.71
2000 2001 1.79
2002 2.04 3.4147 99,620 19,278
3Investment spending on construction services was increased by Rs 20.3 billion so that
supply and demand for these services balanced with private consumption of construction services equal to zero (reflecting a classification of construction services as investment). As a result, the net increase in investment demand for private services is Rs 49.7 billion.
17
products was greater than total supply (even when excluding final private consumption). Thus, crude petroleum imports were increased by 49 billion to make private consumption of mining products (calculated as a residual) equal to approximately zero. Similarly, imports of refined petroleum were increased by Rs 100 billion to raise the share of refined petroleum in total private consumption to 1.0 percent (compared to 1.4 percent in 1990-91 IO Table).
Other Major Crops. Initial estimates of private consumption of other field crops, calculated as a residual, were also negative. To obtain a positive final consumption of other field crops, adjustments were made to both intermediate consumption and production. First, intermediate consumption of other field crops by the cattle sector was reduced by Rs 20 billion, from Rs 76 billion to Rs 56 billion. Production of cattle was reduced by the same amount, leaving value added in the cattle sector unchanged. The value of production of cattle was calculated as a residual. Second, production of other field crops was increased so that the residual consumption of other field crops was equal to 0.1 percent of total private consumption of all commodities. In order to maintain the total value added of major crops at the level of the 2001-02 national accounts, production and value added of other major crops for sugarcane, IRRI rice, and cotton were reduced by 5 percent and production and value added of wheat and basmati rice were reduced by 10 percent.
Construction. Using initial estimates of production, intermediate consumption and investment demand and international trade, the residual private consumption was negative. To achieve a target of zero private consumption of construction services, investment spending on construction was reduced by Rs 30 billion and intermediate consumption of construction by the public services activity was reduced by Rs 41.7 billion, increasing demand for private services in each case to maintain balance in the investment and private services accounts.
Forestry and Wood. In order to obtain positive levels of private consumption of forestry and wood products, intermediate consumption of these products was reduced. Intermediate consumption of forestry products by trade, transport and private services activities were each reduced by 60 percent. Similarly, intermediate consumption of wood products in trade, transport and private services activities were each reduced by 50 percent.
18
Table 5
Comparative Macroeconomic Aggregates (Million Rs)
SAM Figures
FBS-National
Accounts Difference
% Difference
Consumption 3,446,932 3,107,931 339,001 10.9 Private Sector 3,037,993 2,698,992 339,001 12.6
Government 408,939 408,939 0 0.0
Investment 534,113 534,113 0 0.0 Exports 677,840 677,840 0 0.0
Imports 1,100,153 691,153 409,000 59.2 GDP MP 3,628,731 3,628,731 0 0.0
NFI 184,769 31,985 152,784 477.7 GNP MP 3,813,500 3,660,716 152,784 4.2
Net Indirect Taxes 251,633 251,633 0 0.0 GNP FC 3,561,867 3,409,083 152,784 4.5 Source: National Account figures are from Pakistan Economic Survey 2002-03, SA Table 1.6.
Factor and Household Incomes
Split of Value-added in Agriculture. The breakdown of value added by factor inputs for the five major crops (wheat, rice IRRI, rice basmati, cotton and sugarcane) are based on survey data on costs of production in Sindh, Punjab and Other Pakistan from the Agricultural Prices Commission.5 Approximate shares of value added of the three regions, Sindh, Punjab and Other Pakistan, in each crop are calculated by using their shares in total cropped area based on Agricultural Census 2000 data. The regional crops VAs are then split into labour, land, water and capital costs based on distribution of these costs from the APCOM survey data.6 The totals of regional land and labour costs (see factor shares Table 6) were then split into payments to factor sub-categories based on regional distribution of cropped area under those crops. Thus, for each activity in the SAM, it is assumed that the same technology (as represented by the input-output coefficients and factor shares) is used across regions and farm size.7
5APCOM, Price Policy Papers for Wheat, Rice, Cotton, and Sugarcane. Note that data for
other provinces is not available except for NWFP which is only for sugarcane. So that the other Pakistan was mostly proxied by Sindh based on productivity.
6The crop cost structure used for Other Pakistan is that of Sindh, except in case of
sugarcane, which is that of NWFP.
7For wheat, the breakdown of value added assumes that the share of labour and capital in
19
Table 6
Returns to Factors (% Value Added)—Major Crops
Factor Wheat-irr
Wheat-unirr Padi-irri
Padi-basmati Cotton Sugarcane Labour 34.5 34.5 17.0 9.9 32.7 13.1 Land 34.8 53.7 67.0 69.6 48.6 69.1 Water 20.0 0.0 8.4 15.6 10.2 8.6 Capital 10.7 11.8 7.7 4.9 8.6 9.2
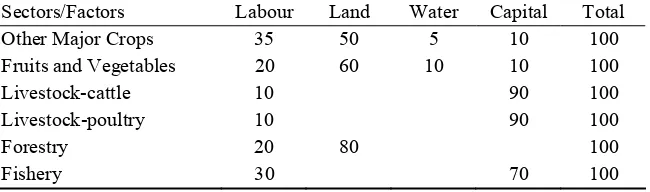
VAs in the remaining activities of the agriculture sector were split into payments for factor subcategories as follows. We first split VA into payments for labour, land, water and capital based on the authors’ judgments and evidence on the five major crops (see Table 7). For Other major crops and Fruits and vegetables, the shares for labour and land were split into further factor sub-categories based on weight estimated from PIHS 2001-02. The split of wages and land payment was based on regional shares of area under forests. We attributed whole of the capital share in Other major crops and fruits and vegetables to other agricultural capital. A ratio of 70:20 between for livestock capital and formal capital is assumed for livestock and poultry activities. Similarly a ratio of 50:20 is assumed for informal and formal capital in fishery.
Table 7
Distribution of Value-added in Selected Sectors (%)
Sectors/Factors Labour Land Water Capital Total Other Major Crops 35 50 5 10 100
Fruits and Vegetables 20 60 10 10 100
Livestock-cattle 10 90 100 Livestock-poultry 10 90 100
Forestry 20 80 100
Fishery 30 70 100
[image:21.612.109.434.394.490.2]20
The resulting distribution of payments to factors in the agricultural sector as a share of total factor payments (value added) in agricultural activities is given in the Annex Table 6. Thus, for example, wheat accounts for 2.6 percent of total value added attributed to own land for large farmers in Punjab.
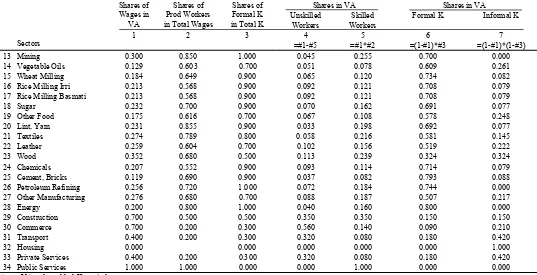
VA Splits in Industry and Service Sectors. The split of VA in manufacturing is based on estimates of the share of wages in total value added. We derived the wage shares from the employment cost in total value added and shares of production workers in labour value added from data from the Census of Manufacturing Industries. The employment costs of production workers in labour value added was used as an approximation for the share of skilled workers wages in the total wage bill. We had little data was available to estimate payments of value added to factors in mining, energy, construction and other services sectors. Hence the shares of wages in VA and production workers in wages were assumed for the mining, energy, construction and the remaining service sectors based on observed values for manufacturing activities and the authors’ judgment.
We have used standard capital ratios to split capital VA into two formal and informal categories from other countries as initial estimates, and then adjusted these numbers in the SAM balancing process. For housing, all VA is allocated to informal capital; for public administration, all VA is paid to skilled labour. Authors’ estimates of VA splits in industry and service activities VAs into wage payments to skilled and unskilled workers and interest payments to formal and informal capital is shown in Table 8.
Household Income
No complete data on household income by factor of production was available. Estimates of factor payments to households were made largely on the basis of data from the PRHS 2001-02.
Agricultural Incomes
Factors of production are defined according to operated area (size of farm), while household groups are defined according to ownership of land. Thus, there is no direct one-to-one mapping of most factor payments to household groups.
Table 8
Estimation of VA Splits in Industry and Service Sectors (Shares)
Shares in VA Shares in VA Shares of
Wages in VA
Shares of Prod Workers in Total Wages
Shares of Formal K in Total K
Unskilled Workers
Skilled Workers
Formal K Informal K
1 2 3 4 5 6 7
Sectors =#1-#5 =#1*#2 =(1-#1)*#3 =(1-#1)*(1-#3) 13 Mining 0.300 0.850 1.000 0.045 0.255 0.700 0.000
14 Vegetable Oils 0.129 0.603 0.700 0.051 0.078 0.609 0.261
15 Wheat Milling 0.184 0.649 0.900 0.065 0.120 0.734 0.082 16 Rice Milling Irri 0.213 0.568 0.900 0.092 0.121 0.708 0.079 17 Rice Milling Basmati 0.213 0.568 0.900 0.092 0.121 0.708 0.079 18 Sugar 0.232 0.700 0.900 0.070 0.162 0.691 0.077
19 Other Food 0.175 0.616 0.700 0.067 0.108 0.578 0.248 20 Lint, Yarn 0.231 0.855 0.900 0.033 0.198 0.692 0.077
21 Textiles 0.274 0.789 0.800 0.058 0.216 0.581 0.145 22 Leather 0.259 0.604 0.700 0.102 0.156 0.519 0.222
of small and medium-sized farms for each region (Punjab, Sindh, Other Pakistan) were allocated to households according to the following formula:
LandShareh = (CultAreah – rr * Land_Inh + rr * Land_Outh) /
Total Cultivated Area,
where LandShareh is the share of household h in total land revenues, CultAreah
is cultivated area of household h, rr is the rental cost of land (assumed to be 50 percent), Land_Inh is net land rented in of household h,8 and Land_Outh is net
land rented out of household h.
All own-farm labour earnings on large (medium) farms (defined in terms of cultivated area) are paid to large (medium) land-owners in the respective regions. For small farms in each region, returns to own labour are allocated between small and landless farmers according to the shares of each group in total number of farm households operating small farms in each region, using data from the PRHS 2001-02.
Payments of agricultural wage labour are allocated to households according to shares of each household in the respective total factor incomes, calculated using per capita earnings from the PRHS 2001-02 and household population totals from HIES. Similarly, returns to unskilled labour in non-agricultural activities are allocated to rural households using the per capita earnings from the PRHS 2001-02 multiplied by the household population totals from HIES. Using this formula, rural households account for 43 percent of total agricultural unskilled wage incomes. The remaining 57 percent of non-agricultural wage incomes are allocated between urban non-poor and poor households using population weights in the HIES. All skilled labour incomes are allocated to urban non-poor households.
Returns to agricultural capital are split according to the same shares as total returns to agricultural land in the SAM. Returns to livestock are split across provinces using quantity of production data for livestock of various types (Agricultural Statistics of Pakistan) multiplied by their estimated prices. The derived estimated shares of total value of production are: Sindh 25 percent; Punjab 50 percent; and Other Pakistan 25 percent. Livestock incomes across households of various types within the regions are allocated using each household type’s share of livestock income in the province calculated from PRHS 2001-02. Payments for water are split 80 percent to government (as water charges) and 20 percent to large farmers (for water rents).9
Returns to informal non-agricultural capital (which includes returns to self-employed labour in informal sector activities) are split between rural and urban households using the approximate the share of rural population in total
8Only positive values of net land rented in are used.
9Future refinements of the SAM could include estimates of returns to return from PRHS
23
population (70 percent). The split across rural households is made using shares of each household in reported incomes from non-farm enterprises, calculated using per capita earnings from the PRHS 2001-02 and household population totals from HIES. The remaining 30 percent of non-agricultural wage incomes are allocated between urban non-poor and poor households using a 85:15 ratio.10
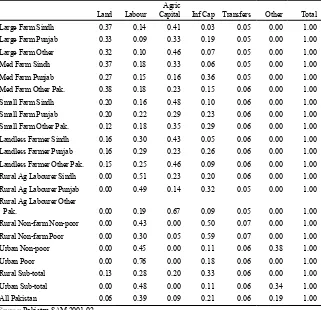
[image:25.612.110.431.230.540.2]Public transfers are estimated using HIES data on per capita transfer receipts by household. Foreign transfers are allocated across households such that these transfers are a constant share of total incomes for each household group. The resulting income shares by household group are given in Table 9.
Table 9
Pakistan: Household Income Shares (2001-02)
Land Labour
Agric
Capital Inf Cap Transfers Other Total Large Farm Sindh 0.37 0.14 0.41 0.03 0.05 0.00 1.00 Large Farm Punjab 0.33 0.09 0.33 0.19 0.05 0.00 1.00 Large Farm Other 0.32 0.10 0.46 0.07 0.05 0.00 1.00 Med Farm Sindh 0.37 0.18 0.33 0.06 0.05 0.00 1.00 Med Farm Punjab 0.27 0.15 0.16 0.36 0.05 0.00 1.00 Med Farm Other Pak. 0.38 0.18 0.23 0.15 0.06 0.00 1.00 Small Farm Sindh 0.20 0.16 0.48 0.10 0.06 0.00 1.00 Small Farm Punjab 0.20 0.22 0.29 0.23 0.06 0.00 1.00 Small Farm Other Pak. 0.12 0.18 0.35 0.29 0.06 0.00 1.00 Landless Farmer Sindh 0.16 0.30 0.43 0.05 0.06 0.00 1.00 Landless Farmer Punjab 0.16 0.29 0.23 0.26 0.06 0.00 1.00 Landless Farmer Other Pak. 0.15 0.25 0.46 0.09 0.06 0.00 1.00 Rural Ag Labourer Sindh 0.00 0.51 0.23 0.20 0.06 0.00 1.00 Rural Ag Labourer Punjab 0.00 0.49 0.14 0.32 0.05 0.00 1.00 Rural Ag Labourer Other
Pak. 0.00 0.19 0.67 0.09 0.05 0.00 1.00 Rural Non-farm Non-poor 0.00 0.43 0.00 0.50 0.07 0.00 1.00 Rural Non-farm Poor 0.00 0.30 0.05 0.59 0.07 0.00 1.00 Urban Non-poor 0.00 0.45 0.00 0.11 0.06 0.38 1.00 Urban Poor 0.00 0.76 0.00 0.18 0.06 0.00 1.00 Rural Sub-total 0.13 0.28 0.20 0.33 0.06 0.00 1.00 Urban Sub-total 0.00 0.48 0.00 0.11 0.06 0.34 1.00 All Pakistan 0.06 0.39 0.09 0.21 0.06 0.19 1.00 Source: Pakistan SAM 2001-02.
10Estimates of earnings from non-formal enterprises are perhaps the most uncertain figures
24
Household Consumption and Savings
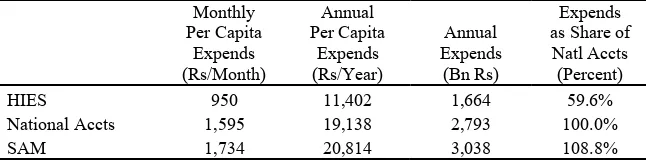
[image:26.612.108.431.219.299.2]According to the 2001-2002 Household Income and Expenditure Survey (HIES), aggregate annual national household consumption was Rs 1,664 billion (Rs 950/person/month x 12 x 145.96 million people), 59.6 percent of the household consumption figure from the national account estimates (Rs 2,793 billion) and 54.8 percent of the SAM total consumption figure (3,038 billion). (Note that the SAM figure for consumption is slightly higher than the national accounts figure because of the adjustment to manufactured product imports, as described above.) (see Table 10).
Table 10
Alternative Consumption Estimates, 2001-02 Monthly
Per Capita Expends (Rs/Month)
Annual Per Capita
Expends (Rs/Year)
Annual Expends
(Bn Rs)
Expends as Share of Natl Accts (Percent)
HIES 950 11,402 1,664 59.6%
National Accts 1,595 19,138 2,793 100.0%
SAM 1,734 20,814 3,038 108.8%
Note: 2001-02 population is 145.96 million.
Initial estimates of consumption across households are derived from the estimated total national consumption of each commodity (the residual of supply less non- private consumption demand) as follows. For major food commodities and items that are clearly specified in the HIES (e.g. textiles and leather), this total consumption is allocated across household using the share of each household group in total consumption of each commodity from the national household expenditure survey. For some commodities, (e.g. IRRI and basmati rice), consumption data in the HIES is aggregated into a single commodity (in this case, rice), and the same shares across household group are used for multiple commodities. In the absence of explicit accurate data on expenditures on other food commodities, consumption of these items is calculated using shares of total consumption of all other goods. (See Appendix Table x).
Savings across households are estimated as 10 percent of income for rural agricultural non-poor households and large land-owner farmers. For all other households except the urban non-poor, a rate of 5 percent is used. The savings rate of urban non-poor households, calculated as the residual of national household savings less savings of the other households, is 10.9 percent.
25
brings the column (or row) total in balance. Balancing the SAM in this way maintains all the estimates of production, income and non-consumption uses of commodities as described above, but forces all the adjustments in the SAM to be made to the household consumption matrix. One alternative is to use an algorithm that permits adjustment of cells throughout the SAM, such as the maximum entropy method [Robinson, Cattaneo, and El-Said (2000)].11
III. THE STRUCTURE OF HOUSEHOLD INCOMES AND EXPENDITURES IN PAKISTAN: 2001-02
SAM ESTIMATES
Household incomes and expenditures relative to those of other household groups follow similar patterns as in the PRHS and HIES surveys, though absolute levels of household incomes and expenditures are substantially higher given the apparent substantial under-reporting of expenditures (particularly on services) and informal sector incomes in the surveys.
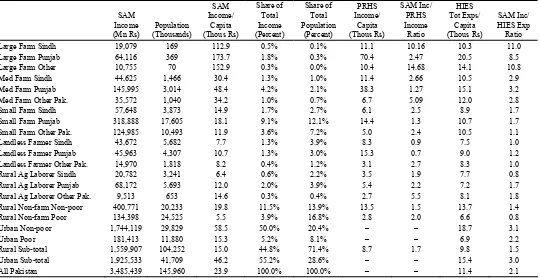
[image:27.612.109.430.455.518.2]On average, household incomes in the SAM are 2.1 times greater than household expenditures in the HIES Survey, and rural household incomes in the SAM are 1.5 times greater than rural household incomes in the PRHS survey (Table 11). These ratios vary by household group, however (Table 12). The SAM calculations suggest that incomes and expenditures of large and medium farmers are seriously understated in the HIES—by a factor of 3.8, on average. Compared to total incomes in the PRHS survey results, however, factor incomes of medium and large farmers in the SAM are only 2.8 times higher. Note that much of the difference in incomes is due to estimated returns to cultivated land. For only two household groups, rural non-farm poor and rural agricultural labour Sindh, are the SAM household incomes less than household expenditures in the HIES.12
Table 11
Pakistan: Per Capita Income (Expenditures) 2001-02, (Thousand Rs/Person/Year)
National Accounts Income
SAM Income
HIES Expend.
PRHS Income
Rural n.a. 15.0 9.8 8.7
Urban n.a. 46.2 15.4 n.a.
Total 24.9 23.9 11.4 n.a.
Source: Pakistan 2001-02 SAM; Pakistan Rural Household Survey (PRHS) 2001-02; Pakistan Household Income and Expenditure Survey (HIES) 2001-02.
11
A revised version of the SAM using this technique is planned. This future work may also entail adjustments to milling costs and other revisions to the input-output table.
12Note that, because of a lack of reliable data, the SAM does not contain household transfers
Table 12
Pakistan: Household Incomes and Expenditures, 2001-02
SAM Income (Mn Rs) Population (Thousands) SAM Income/ Capita (Thous Rs) Share of Total Income (Percent) Share of Total Population (Percent) PRHS Income/ Capita (Thous Rs) SAM Inc/ PRHS Income Ratio HIES Tot Exps/ Capita (Thous Rs) SAM Inc/ HIES Exp Ratio Large Farm Sindh 19,079 169 112.9 0.5% 0.1% 11.1 10.16 10.3 11.0 Large Farm Punjab 64,116 369 173.7 1.8% 0.3% 70.4 2.47 20.5 8.5 Large Farm Other 10,755 70 152.9 0.3% 0.0% 10.4 14.68 14.1 10.8 Med Farm Sindh 44,625 1,466 30.4 1.3% 1.0% 11.4 2.66 10.5 2.9 Med Farm Punjab 145,995 3,014 48.4 4.2% 2.1% 38.3 1.27 15.1 3.2 Med Farm Other Pak. 35,572 1,040 34.2 1.0% 0.7% 6.7 5.09 12.0 2.8
Small Farm Sindh 57,648 3,873 14.9 1.7% 2.7% 6.1 2.5 8.9 1.7 Small Farm Punjab 318,888 17,605 18.1 9.1% 12.1% 14.4 1.3 10.7 1.7
Small Farm Other Pak. 124,985 10,493 11.9 3.6% 7.2% 5.0 2.4 10.5 1.1 Landless Farmer Sindh 43,672 5,682 7.7 1.3% 3.9% 8.3 0.9 7.5 1.0 Landless Farmer Punjab 45,963 4,307 10.7 1.3% 3.0% 15.3 0.7 9.0 1.2
Landless Farmer Other Pak. 14,970 1,818 8.2 0.4% 1.2% 3.1 2.7 8.3 1.0 Rural Ag Laborer Sindh 20,782 3,241 6.4 0.6% 2.2% 3.5 1.9 7.7 0.8
Rural Ag Laborer Punjab 68,172 5,693 12.0 2.0% 3.9% 5.4 2.2 7.2 1.7 Rural Ag Laborer Other Pak. 9,513 653 14.6 0.3% 0.4% 2.7 5.5 8.1 1.8 Rural Non-farm Non-poor 400,771 20,233 19.8 11.5% 13.9% 13.5 1.5 13.7 1.4
Rural Non-farm Poor 134,398 24,525 5.5 3.9% 16.8% 2.8 2.0 6.6 0.8 Urban Non-poor 1,744,119 29,829 58.5 50.0% 20.4% – – 18.7 3.1
Urban Poor 181,413 11,880 15.3 5.2% 8.1% – – 6.9 2.2
Rural Sub-total 1,559,907 104,252 15.0 44.8% 71.4% 8.7 1.7 9.8 1.5 Urban Sub-total 1,925,533 41,709 46.2 55.2% 28.6% – – 15.4 3.0
Agricultural factor incomes account for only 23 percent of total factor incomes in Pakistan, but 60 percent of total factor incomes for agricultural households (77 percent for agricultural households in Sindh), (Table 13). 91 percent of agricultural incomes derive from land, water, own-farm labour, or livestock, so that without access to land or livestock; earnings from hired labour and (non-livestock) agricultural capital account for only 9 percent of agricultural incomes.
Table 13
Pakistan: Factor Income Shares by Household Type, 2001-02
All HHs
Rural HHs
Rur AgHHs
Sindh
Rur AgHHs Punjab
Rur AgHHs Other Pak
Rur AgHHs
All Pakistan Labour 0.522 0.298 0.248 0.24 0.19 0.232 Land 0.081 0.144 0.242 0.22 0.19 0.218 Water 0.003 0.005 0.014 0.009 – 0.008 Capital 0.394 0.553 0.497 0.531 0.62 0.542 Of which
Livestk and
Ag Capital 0.115 0.205 0.408 0.249 0.379 0.302 Total 1.000 1.000 1.000 1.000 1.000 1.000 Own-Farm and
Agric/Total
Inc 0.231 0.411 0.766 0.56 0.652 0.615 Own Farm/
Agric Income 0.906 0.906 0.890b 0.896 0.949 0.905 Source: Pakistan SAM 2001-02.
28
Table 14
Disaggregated Factor Income Shares by Household Group, Pakistan 2001-02
Agric Agric Total Non-agr Non-agr Total
Land Capital Labour Agric Capital Labour Other Income
Large Farm Owners (50+ acres) 0.34 0.36 0.00 0.70 0.15 0.10 0.05 1.00 Medium Farm Owners (12.5-50) 0.31 0.21 0.00 0.52 0.27 0.16 0.05 1.00 Small Farm Owners (<12.5 Acres) 0.18 0.32 0.04 0.55 0.23 0.16 0.06 1.00
Pure Tenants 0.16 0.35 0.09 0.60 0.15 0.20 0.06 1.00
Agricultural Labourers 0.00 0.21 0.32 0.53 0.27 0.14 0.06 1.00
Rural Non-farm Non-poor 0.00 0.00 0.00 0.00 0.50 0.43 0.07 1.00
Rural Non-farm Poor 0.00 0.05 0.00 0.05 0.59 0.30 0.07 1.00
Urban Non-poor 0.00 0.00 0.00 0.00 0.11 0.45 0.44 1.00
Urban Poor 0.00 0.00 0.00 0.00 0.18 0.76 0.06 1.00
Rural Sub-total 0.13 0.20 0.04 0.37 0.33 0.24 0.06 1.00
Rural Non-agric Households 0.21 0.29 0.06 0.56 0.23 0.16 0.06 1.00
Urban Subtotal 0.00 0.00 0.00 0.00 0.11 0.48 0.41 1.00
All Pakistan 0.06 0.09 0.02 0.17 0.21 0.37 0.25 1.00
Source: Pakistan SAM 2001-02.
Table 15
Pakistan Rural Agricultural Incomes
PRHS Agric Inc Per Capita ('000 Rs) PRHS Agric Inc Share (Percent) SAM Agric Inc Per Capita ('000 Rs) SAM Agric Inc Share (Percent) Medium and Large Farms 15.7 83.5 29.9 57.2
Small Farms 6.1 67.9 8.6 54.8 Landless Farmers 7.2 87.7 5.3 59.7 Rural Agric Workers 2.2 53.1 5.5 53.1
Rural Non-Farm Non-Poor 0.3 1.9 0.1 0.4 Rural Non-Farm Poor 0.2 6.3 0.2 4.5 Total Rural 6.1 69.7 5.6 37.2 Rural Agric Households 7.1 74.8 9.6 55.9
Source: Pakistan SAM 2001-02; Pakistan Rural Household Survey 2001-02.
IV. CONCLUSIONS
[image:30.612.111.433.300.464.2]29
reflect the changed structure of Pakistan’s economy, particularly in the industrial and services sectors.
Further disaggregation of this Pakistan SAM could focus on two additional areas. First, because the focus of this current SAM has been on rural issues, there is relatively little aggregation of the urban sectors. Possible next steps would include further disaggregation of urban household groups, use of PIHS or other surveys to construct a detailed mapping of factor incomes to households. Second, further disaggregation of both urban and rural industrial sectors would be useful, if possible by province and rural/urban areas.
Even without further disaggregation, further work could involve alternative adjustments to household income and consumption to rectify the fundamental imbalance between household survey data and consumption figures implicit in the national accounts. This SAM preserves the structure of production derived from national accounts and Agricultural Census data, along with the structure of income derived from the PRHS data, thus forcing most adjustments on household consumption estimates. Alternative approaches that would make greater adjustments to production and factor accounts, (including matrix-balancing algorithms such as maximum entropy), are also possible.
Nonetheless, in spite of the data uncertainties, the SAM does capture the major features of Pakistan’s rural economy and income distribution. By using land area cultivated data from the Agricultural Census, the SAM approach indicates significantly higher incomes of large and medium farm rural households than are indicated in household surveys. The SAM also likely better reflects the importance of non-agricultural incomes in total rural incomes. Thus, it is hoped that this SAM will serve as a useful tool for further quantitative analysis of agricultural policy and rural poverty reduction strategies.
REFERENCE
30
Annex Table 1
Mapping between SAM and National Accounts Production Sectors
SAM Activities SAM Activity Code IO91 Sector No. National Account Sector 1a Wheat Irrigated A-WHTI A1a 2 Major Crops 1b Wheat Non-irrigated A-WHTN A1b 2 Major Crops 2 Rice IRRI A-PADI A2 1 Major Crops 3 Rice Basmati A-PADB A3 1 Major Crops 4 Cotton A-COTT A4 3 Major Crops 5 Sugarcane A-CANE A5 4 Major Crops 6 Other Major Crops A-OCRP A6 5-8,12,13 Major Crops 7 Fruits/Vegetables A-HORT A7 9,10,11 Minor Crops 8 Livestock (Cattle, Milk) A-CATT A8 14 Livestock 9 Livestock (Poultry) A-POUL A9 14 Livestock 10 Forestry A-FOR A10 15 Forestry 11 Fishing A-FISH A11 16 Fishing 12 Mining A-MINE A12 17,18,19 Mining 13 Vegetable Oils A-VEGO A13 21 Manufacturing 14 Wheat Milling A-WHTF A14 22,23 Manufacturing 15 Rice Milling Irri A-RICEI A15 22 Manufacturing 16 Rice Milling Basmati A-RICEB A16 22 Manufacturing 17 Sugar A-SUG A17 24 Manufacturing 18 Other Food A-OTHF A18 25-27 Manufacturing 19 Lint, Yarn A-YARN A19 28,29 Manufacturing 20 Textiles A-TEXT A20 30-36 Manufacturing 21 Leather A-LEAT A21 37,38 Manufacturing 22 Wood A-WOOD A22 39-40 Manufacturing 23 Chemicals A-CHEM A23 41-43 Manufacturing 24 Cement, Bricks A-CEM A24 48-49 Manufacturing 25 Petroleum Refining A-PETR A25 Manufacturing 26 Other Manufacturing A-MANF A26 44-47,50-60 Manufacturing 27 Energy A-ENRG A27 61,63 (62) Electricity and Gas 28 Construction A-CONS A28 64 Construction
29 Commerce A-TRAD A29 73-74
Wholesale and Retail Trade
30 Transport A-TRNS A30 76-81
Transport and Communication 31 Housing A-HSNG A31 87,88 Ownership of Dwell
32 Private Services A-PRISV A32
82-86,89, 92,94,96,97
Services, Finance, Insurance and Banks
33 Public Services A-PUBS A33 90
Annex Table 2
Estimation of Value Additions (Million Rs)
No. Activity
VA in 1990-91
Real Gr in VA
Price Increase
VA in 2001-02
Increase in VA
(%) Data
Source/Remarks
1 Wheat Irrigated 21,820 1.35 2.35 62,200 185.1 Production increase based on AS Table 5, price increase on ES SAT 7.5 1b Wheat Non-irrigated 2,658 0.47 2.35 2,626 –1.2 Production increase based on AS Table 5, price increase on ES SAT7.5
2 Rice IRRI 3,958 0.92 2.32 8,024 102.7
Production increase based on AS Table 7, June price increase in Lahore AS Table 150
3 Rice Basmati 4,348 1.64 2.48 15,913 266.0
Production increase based on AS Table 7, June price increase in Lahore AS Table 149
4 Cotton 20,312 1.10 2.18 46,447 128.7 Production increase-ES SAT 2.4, price increase ES SAT 7.5 5 Sugarcane 9,575 1.33 2.75 33,442 249.3 Production increase-ES SAT 2.4, price increase ES SAT 2.12 6 Other Major Crops 39,071 94,476 141.8 Residual VA of major crops-ES2003
7 Fruits/Vegetables 41,208 121,067 193.8 Minor crops VA-ES2003
8 Livestock (Cattle, Milk) 71,083 1.87 2.29 348,421 390.2 VA in livestock minus estated VA in poultry
9 Livestock (Poultry) 4,470 2.35 2.29 24,062 438.2 Production from ES SAT 2.15, price increase on GDP deflator of livestock 10 Forestry 13,947 1.27 8,458 –39.4 VA in forestry-ES
11 Fishing 12,774 1.29 18,587 45.5 VA in fishing-ES 12 Mining 32,744 1.22 21,203 –35.2 VA in mining-ES
13 Vegetable Oils 2,401 1.21 2.62 7,631 217.8 Production ES SAT 3.4, wholesale price index ES SAT 7.5 14 Wheat Milling 12,669 1.25 2.61 41,420 227.0 Real and price increases on wheat production and price respectively 15 Rice Milling Irri 3,598 0.92 2.32 7,679 113.4 Real and price increases on rice irri production and price respectively 16 Rice Milling Basmati 3,953 1.64 2.48 16,075 306.7 Real and price increases on rice basmati production and price respectively
32
Annex Table 2—(Continued)
17 Sugar 13,877 1.68 2.05 47,810 244.5 Production increase ES SAT 3.4, wholesale price increase ES SAT7.5 18 Other Food 32,189 4.01 1.00 58,674 82.3
Resid VA split among other food, wood, chemical and other mfg in IO91 proportions
19 Lint, Yarn 18,902 1.74 1.93 48,578 157.0 C. yarn production ES SAT 3.3, wholesale price of yarn ES SAT 7.5 20 Textiles 31,035 1.94 1.93 121,037 290.0 Cloth prod ES SAT 3.3, price increase o wholesale price of yarn 21 Leather 1,475 2.04 1.00 3,003 103.6 VA extrapolated based on VA of leather and leather products-CMI91-96 22 Wood 12,176 1.62 1.00 22,194 82.3
Resid VA split among other food, wood, chemical and other mfg in IO91 proportions
23 Chemicals 9,105 5.81 1.00 16,597 82.3
Resid VA split among other food, wood, chemical and other mfg in IO91 proportions
24 Cement, Bricks 17,462 1.28 2.14 47,908 174.4 Production-ES SAT 3.4, price ES SAT7.5 25 Petroleum Refining 2,820 19,278 583.6
CMI 96 VA extrapolated-quantum index and WPI (fuel, lighting and lubricants) fr FBS
26 Other Manufacturing 47,343 5.59 2.28 86,297 82.3
Resid VA split among other food, wood, chemical and other mfg in IO91 proportions
27 Energy 36,113 1.66 115,073 218.6 VA in Electricity and Gas-ES 28 Construction 42,942 1.26 106,560 148.1 VA from ES
29 Commerce 161,661 1.42 516,121 219.3 VA from ES 30 Transport 65,446 1.61 399,515 510.4 VA from ES 31 Housing 67,291 1.76 164,389 144.3 VA from ES
32 Private Services 59,404 1.96 435,465 633.1 VA from ES, includes VA in Finance and Banking 33 Public Services 56,745 1.43 290,867 412.6 VA from ES
Annex Table 3
Value of Production at Market Prices (Million Rs)
Value of
Net Indirect
No. Activity
VA in 2001-02
Value of Inputs
Produc-tion
Taxes-Dom
Import Duties 1 Wheat Irrigated 62,200 60,263 122,463 117 0 1b Wheat Non-irrigated 2,626 2,544 5,169
2 Rice IRRI 8,024 5,308 13,332 40 0 3 Rice Basmati 15,913 10,526 26,439 0 0 4 Cotton 46,447 29,416 75,863 32 0 5 Sugarcane 33,442 22,266 55,708 40 0 6 Other Major Crops 94,476 38,604 133,081 73 0 7 Fruits/Vegetables 121,067 67,482 188,549 669 3,650 8 Livestock (Cattle,
Milk) 348,421 306,239 654,661 0 153 9 Livestock (Poultry) 24,062 22,530 46,591 0 0
Annex Table 4
Estimation of Commodity-wise Exports and Imports in 2001-02 (Million Rs)
No.
Commodity
Exports
1990-91 2001-02
Imports
1990-91 2001-02
1 Wheat 0 4,362 8,721 3,056 FTS Table 6 Code 041 2 Rice IRRI 0 0 1 0
3 Rice Basmati 0 0 0 0 4 Cotton 0 0 0 0 5 Sugarcane 0 0 0 0
6 Other Major Crops 809 3,530 1,974 6,153 Estimates in proportion of the IO91 share 7 Minor Crops 1,145 7,125 1,737 13,519 FTS, Table 6 Code 05
8 Livestock (Cattle, Milk) 713 369 2,296 7,156 FTS, Table 6 Code 001 minus 0014
9 Livestock (Poultry) 0 52 0 0 Exports-FTS, Table 6 Code 0014, no imports assumed 10 Forestry 1,034 3,231 765 2,384 Exports-using % change in VA, Imports using IO91 proportion 11 Fishing 1,017 7,746 5 16 Exports-FTS Table 6 Code 03, imports using IO91 proportion 12 Mining 1,213 5,292 14,969 46,657 in proportion of the IO91 share
13 Vegetable Oils 6,543 23 684 24,034 Exports-FTS Table 6 Code 4312201, Imports ES tab 8.1 14 Wheat Milling 0 3,454 0 8,406 FTS Table 6 Code 046
15 Rice Milling Irri 0 11,653 0 0 Exports-FTS Table 6 Code 0423102, no imports 16 Rice Milling Basmati 15,856 0 Exports-FTS Table 6 Code 0423101, no imports 17 Sugar 1,340 170 481 2,846 Exports and Imports-FTS Table 6 Code 0611+0612
18 Other Food 2,934 81,819 11,193 10,972 FTS-total food code 0 FBS minus a/m items except sugar and veg oil plus beverages/tobacco, code 1
35
Annex Table 4—(Continued)
19 Lint, Yarn 33,252 60,824 1,019 7,297 Exports (raw cotton, cot waste and yarn) ES SAT8.7, Imports of cotton, yarn and textiles from SBP AR
split by proportion of 90-91
20 Textiles 62,347 216,278 2,368 16,634 Exports-FTS Table 6 Code 65-651, Imports of cotton, yarn and textiles from SBP AR split by proportion of 90-91
21 Leather 6,896 15,385 539 1,130 Exports-FTS Table 6 Code 61, Imports from SBP AR SAT 9.7 converted into Rs 22 Wood 201 209 1,839 5,732 Exports-FTS Table 6 Code 63, Imports by IO91 proportion
23 Chemicals 637 9,361 9,950 114,928 SBP AR 2002 SAT 9.7 converted in Rs 24 Cement, Bricks 46 182 106 0 Exports-Es Table SA8.7
25 Other Manufacturing 8,117 112,598 145,786 366,279 Exports/imports residual 26 Energy 0 0 0
27 Construction 0 0 0
28 Commerce 102 445 697 2,172 Exports/imports residual 29 Transport 27,001 117,803 0 Exports by share 30 Housing 0 0 0
31 Private Services 17 74 16,613 51,781 Exports/imports residual 32 Public Services 0 0 0 0
Annex Table 5
Structure of the Economy, Pakistan 2001-02
Output
Value
Added Exports Imports Export/ Output
Import/ Final Demand (X) (VA) (E) (M) (E/X) (M/Q) Sector % Ratio
Agriculture
Wheat 1.83 1.92 0.64 0.28 0.0342 0.0234 Rice Irri 0.19 0.24 0.00 0.00 0.0000 0.0000 Rice Basmati 0.38 0.47 0.00 0.00 0.0000 0.0000 Cotton 1.08 1.38 0.00 0.00 0.0000 0.0000 Sugarcane 0.80 0.99 0.00 0.00 0.0000 0.0000 Other Major Crops 1.90 2.80 0.52 0.56 0.0265 0.0442 Horticulture 2.70 3.58 1.05 1.23 0.0378 0.0655 Livestock 9.36 10.32 0.05 0.65 0.0006 0.0108 Poultry 0.67 0.71 0.01 0.00 0.0011 0.0000 Forestry 0.15 0.25 0.48 0.22 0.3136 0.1879 Fisheries 0.47 0.55 1.14 0.00 0.2378 0.0005 Total 19.52 23.21 3.90 2.93 0.0194 0.0230
Industry
Mining 0.41 0.63 0.78 8.69 0.1862 0.6763 Vegetable Oil 1.38 0.23 0.00 2.18 0.0002 0.1836 Wheat Milling 2.71 1.23 0.51 0.76 0.0182 0.0424 Rice Milling Irri 0.35 0.23 1.72 0.00 0.4726 0.0000 Rice Milling Basmati 0.74 0.48 2.34 0.00 0.3072 0.0000 Sugar 2.12 1.42 0.03 0.26 0.0011 0.0177 Other Food 2.27 1.74 12.07 1.00 0.5147 0.0520 Lint, Yarn 3.21 1.44 8.97 0.66 0.2710 0.0289 Textiles 7.80 3.58 31.91 1.51 0.3965 0.0301 Leather 0.51 0.09 2.27 0.10 0.4281 0.0320 Wood 0.87 0.66 0.03 0.52 0.0034 0.0857 Chemicals 0.84 0.49 1.38 10.45 0.1590 0.6166 Cement 1.25 1.42 0.03 0.00 0.0021 0.0000 Petroleum 1.42 0.57 0.00 9.09 0.0000 0.3840 Other Manufacturing 4.86 2.56 16.61 56.93 0.3317 0.6136 Energy 2.71 3.41 0.00 0.00 0.0000 0.0000 Sub-total 33.45 20.15 78.65 92.16 0.2279 0.2816
Services
Construction 3.66 3.16 0.00 0.00 0.0000 0.0000 Trade 8.79 15.28 0.07 0.20 0.0007 0.0035 Transport, Communication 10.61 11.83 17.38 0.00 0.1588 0.0000 Housing 2.87 4.87 0.00 0.00 0.0000 0.0000 Private Services 11.65 12.89 0.01 4.71 0.0001 0.0598 Public Services 9.46 8.61 0.00 0.00 0.0000 0.0000 Sub-total 47.04 56.64 17.46 4.90 0.0360 0.0161
Total 100.00 100.00 100.00 100.00 0.0969 0.1318
Annex Table 6
Distribution of Value-added in Agricultural Activities
(Share)
Wheat-I Wheat-UI Padi-irri Padi-bas Cotton S.cane OthMcrops Horticulture Cattle Poultry Forestry Fishery Labour - agric (own)-large 0.041914 0.032629 0.025494 0.007113 0.044361 0.022488 0.046946 0.004289 0.050000 Labour - agric (own)-med Sindh 0.017368 0.001030 0.027621 0.002166 0.020978 0.010251 0.045238 0.008381 0.002964 Labour - agric (own)-med Punjab 0.041397 0.059084 0.023098 0.028442 0.096450 0.029921 0.063938 0.036144 0.020751 Labour - agric (own)-med OPak 0.060143 0.034732 0.007754 0.001081 0.000752 0.003001 0.016514 0.004144 0.051285 Labour - agric (own)-sm Sindh 0.031359 0.002374 0.047404 0.005014 0.042464 0.014623 0.037418 0.021987 0.002964 Labour - agric (own)-sm Punjab 0.133295 0.108587 0.031645 0.054062 0.121212 0.039193 0.075259 0.099445 0.020751 Labour - agric (own)-sm OPak 0.019859 0.106899 0.007013 0.001387 0.000467 0.011147 0.063093 0.022605 0.051285
Labour - agric (wage) 0.100 0.100 0.300 Land - large- Sindh 0.010025 0.000851 0.047966 0.006468 0.018305 0.055353 0.007774 0.002591 0.007905
Land - large- Punjab 0.025596 0.030514 0.030858 0.042527 0.047118 0.055339 0.059291 0.010275 0.055336 Land - large - OthPak 0.006609 0.019351 0.021567 0.000901 0.000526 0.008332 0.000000 0.000000 0.136759 Land - irrigated - med Sindh 0.017500 0.108767 0.015197 0.031187 0.054257 0.064626 0.025142
Land - irrigated - med Punjab 0.041710 0.090955 0.199511 0.143389 0.158364 0.091340 0.108433 Land - irrigated - med OthPak 0.060597 0.030535 0.007584 0.001118 0.015885 0.023591 0.012433 Land - irrigated - sm Sindh 0.031596 0.186668 0.035169 0.063129 0.077395 0.053455 0.065961 Land - irrigated - sm Punjab 0.134302 0.124612 0.379234 0.180202 0.207438 0.107513 0.298335 Land - irrigated - sm OthPak 0.020009 0.027615 0.009726 0.000695 0.058999 0.090133 0.067816
Land non-irrig - sm Sindh 0.005292 0.023715 Land non-irrig - sm Punjab 0.260615 0.166008 Land non-irrig - sm OthPak 0.220143 0.410277 Water 0.199732 0.000000 0.083816 0.155599 0.101771 0.086160 0.050000 0.100000
Capital Livestock 0.000000 0.010909 0.700 0.700 Capital Other Agric 0.106988 0.106988 0.076611 0.048819 0.085876 0.091855 0.103869 0.112020
Capital Formal 0.200 0.200 0.200
Capital Informal 0.500
PIDE Working Papers
2006: 1. Remittances, Trade Liberalisation, and Poverty in Pakistan: The Role of Excluded Variables in Poverty Change Analysis by Rizwana Siddiqui and A. R. Kemal (2006). 40pp.
2006: 2. Poverty-reducing or Poverty-inducing? A CGE-based Analysis of Foreign Capital Inflows in Pakistan by Rizwana Siddiqui and A. R. Kemal (2006). 43pp.
2006: 3. Bureaucracy and Pro-poor Change by Ali Cheema and Asad Sayeed (2006). 26pp.
2006: 4. Civil Servants’ Salary Structure by Faiz Bilquees (2006). 21pp.
2006: 5. Wheat Markets and Price Stabilisation in Pakistan: An Analysis of Policy Options by Paul Dorosh and Abdul Salam (2006). 17pp.
2006: 6. Stock Market Liberlalisations in the South Asian Region by Fazal Husain and Abdul Qayyum (2006). 19pp.
2006: 7. Volatitlity Spillover between the Stock Market and the Foreign Exchange Market in Pakistan by Abdul Qayyum and A. R. Kemal (2006). 15pp.