Asymmetric Price Adjustment in the
Small
Levy, Daniel and Chen, Haipeng (Allan) and Ray, Sourav
and Bergen, Mark
Bar-Ilan University, University of Miami, McMaster University, and
University of Minnesota
30 November 2006
Online at
https://mpra.ub.uni-muenchen.de/1097/
Asymmetric Price Adjustment in the Small*
Daniel Levy** Bar-Ilan University
Haipeng (Allan) Chen University of Miami
Sourav Ray McMaster University
Mark Bergen University of Minnesota
Last Revision: November 30, 2006
JEL Codes: E31, D11, D21, D80, L11, and M31
Keywords: Asymmetric Price Adjustment, Price Rigidity
* For constructive comments and suggestions we are grateful to the participants and especially to the discussants, Stephen Cecchetti at the November 2004 NBER Monetary Economics Program meeting and Judith Chevalier at the January 2002 North American Meeting of the Econometric Society, as well as to Gershon Alperovich, Ignazio Angeloni, Larry Ball, Bob Barsky, Susanto Basu, David Bell, Martin Eichenbaum, Ben Friedman, Xavier Gabaix, Vitor Gaspar, Wolter Hassink, Miles Kimball, Anil Kashyap, Saul Lach, John Leahy, Andy Levin, Igal Milchtaich, Benoît Mojon, Monika Piazzesi, Akshay Rao, Ricardo Reis, Christina Romer, David Romer, Stephanie Rosenkranz, Avichai Snir, Bent Sorensen, Dani Tsiddon, Alex Wolman, Andy Young, and Tao Zha. In addition we would like to thank the participants at the May 2006 Second Statistical Challenges in E-Commerce Research Symposium at the University of Minnesota, the January 2005 Tel-Aviv University Conference in Memory of Oved Yosha, the August 2005 World Congress of the Econometric Society at University College London, the November 2005 Workshop on Modeling Pricing Behavior in Macroeconomic Models at the Federal Reserve Bank of Richmond, the December 2005 Second International Meeting on Experimental and Behavioral Economics at the University of Valencia, the June 2004 T.C. Koopmans’ First International Conference on “The Economics of Pricing” at Utrecht University, the June 2002 Marketing Science Conference at the University of Alberta, and the June 2001 Midwest Marketing Conference at the University of Michigan, as well as the seminar participants at Bar-Ilan University, Ben-Gurion University, European Central Bank, and the University of Minnesota for comments, suggestions, and advice, and Manish Aggarwal, Ning Liu, and Sandeep Mangaraj for excellent research assistance. We rotate co-authorship. All errors are ours.
Asymmetric Price Adjustment in the Small
Abstract
Analyzing a large weekly retail transaction price dataset, we uncover a surprising regularity—
small price increases occur more frequently than small price decreases for price changes of up to
about 10 cents, while there is no such asymmetry for larger price changes. The asymmetry holds
for the entire sample and for individual categories. We find that while inflation can explain some
of the asymmetry, inflation is not the whole story as the asymmetry holds even after excluding
inflationary periods from the data, and even for products whose price had not increased over the
eight-year period. The findings hold for different measures of inflation and also after allowing
1. Introduction
A longstanding question in price adjustment literature is whether patterns of price
increases are different from patterns of price decreases (see, e.g., Ball and Mankiw 1994,
Cecchetti 1986, Carlton 1986, Mankiw and Romer 1991, and studies cited therein). We
sometimes hear about gas prices that are “rising like rockets... [but] falling like feathers”
(Octane, V.13-3, June 1999, pp. 6-7) or about food prices, where “retail pork prices do
not come down even if hog prices do” (New York Times, Jan. 7, 1999). Although
economists have devoted considerable attention to this issue (recent studies include Davis
and Hamilton 2004, Rotemberg 2002, and Peltzman 2000), the link between the extent of
asymmetry and the size of price changes has not received much attention.1
In this paper we offer evidence on an unusual type of asymmetric price
adjustment. We analyze transaction price data for 29 product categories over an 8-year
period from a large Mid-western supermarket chain. The dataset is quite large containing
about 100 million weekly price observations for 18,037 products. We uncover a
surprising regularity in these data—small price increases are more frequent than small
price decreases for price changes of up to about 10 cents. There is no such asymmetry for
larger price changes. These results hold for the full dataset and for almost every
individual product category. We find that while inflation can explain some of the
asymmetry, inflation is not the whole story. For example, we find that the asymmetry is
still present even if (a) we consider only a low-inflation period sample, or (b) we consider
only a deflation-period sample, or (c) we focus only on the products whose price had not
increased over the eight-year period. These findings are robust across different measures
of inflation, and after allowing for lagged price adjustments.
Building on emerging theories in economics and marketing, we offer a
consumer-based explanation for these findings. We argue that time-constrained consumers may
ignore small price changes if the cost of processing information on small price changes
exceeds the benefit. Thus, in a “small region” around the current price, the demand is less
elastic, giving the retailers incentive to make more frequent small price increases than
decreases.
Several implications are highlighted. First, as far as we know, this type of
asymmetry has not been reported in the literature before, and so far has gone unnoticed.
1
Indeed, we discuss several studies whose data contain asymmetric price adjustment in the
small although the authors fail to notice it. Second, the explanation we offer for our
findings is novel because it suggests that existence of price adjustment costs combined
with a channel structure can lead to asymmetric price adjustment (Blanchard 1983 and
1987, Gordon 1990, Basu 1995, Chevalier et al 2003, Ray et al 2006). Third, the
explanation we offer for the finding of asymmetric price adjustment in the small offers
micro-based evidence on the importance of rational inattention for individual price
dynamics. Fourth, our findings suggest that there might be important differences in the
response of markets to small vs. large changes, consistent with recent micro-level
empirical findings. Finally, our theory offers a possible explanation for the presence of
small price changes, which has been a long standing puzzle in the literature (Carlton
1986, Warner and Barsky 1995, Lach and Tsiddon 2006, Sheshinski and Weiss 1993).
We proceed as follows. In section 2, we describe the data. In section 3, we discuss
the findings. In section 4, we discuss possible explanations for the findings. Section 5
concludes by discussing some potential implications.
2. Data
We use scanner price data from Dominick’s—one of the largest supermarket
chains in the Chicago area, operating 94 stores with a market share of about 25 percent.
Large chains of this type made up about $310 billion in total sales in 1992, which was
86.3% of total retail grocery sales (Supermarket Business, 1993). In 1999 the retail
grocery sales have reached $435 billion. Dominick’s, thus, is representative of a major
class of the retail trade. Moreover, the sales of Dominick’s type large supermarket
chains constitute about 14 percent of the total retail sales of about $2.25 trillion in the
U.S. Because the retail sales account for about 9.3 percent of the GDP, our data set is a
representative of as much as 1.30 percent of the GDP, which is substantial. Thus the
market we are studying has quantitative economic significance as well.
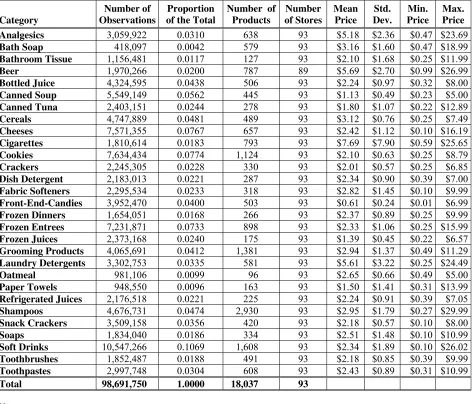
We have 400 weekly observations of retail prices in 27 product categories that
represent 30 percent of the chain’s revenues, from September 14, 1989 to May 8, 1997.2
The length of individual series varies depending on when the data collection for the
specific category began and ended. In Table 1, we list the product categories along with
some descriptive statistics. As the table indicates, the data set contains more than 98
2 Two additional categories (beers and cigarettes) are not discussed here because of the regulations and tax rules
million weekly price observations.
The data come from the chain’s scanner database, and contains the prices paid at
the cash register.3 The data consist of the actual transaction prices which is the kind of
data Lach and Tsiddon (1992, 1996) recommend for studying price adjustment because
they most closely resemble the data envisioned by pricing theory: price quotations at the
level of the price setter.
3. Empirical Findings
Before presenting the findings, consider a sample series from the data. Figure 1
displays the weekly prices of Heritage House frozen concentrate orange juice, 12oz, from
Dominick’s Store No. 78. The series contain the following “small” price changes:
(1) 1¢: 9 positive (weeks 13, 237, 243, 245, 292, 300, 307, 311, and 359) and 6 negative
(weeks 86, 228, 242, 275, 386, and 387);
(2) 2¢: 7 positive (weeks 248, 276, 281, 285, 315, 319, and 365) and 1 negative (week
287);
(3) 3¢: 3 positive (weeks 254, 379, and 380) and 2 negative (weeks 203 and 353);
(4) 4¢: 4 positive (weeks 23, 197, 318, and 354) and 1 negative (week 229); and
(5) 5¢: 1 positive (week 280) and 1 negative (week 302).
Thus, in these series there are more positive than negative price changes up to 4¢. Below
we analyze the patterns of price changes using the entire data set as well as individual
categories. We begin by studying the patterns of price changes for each possible size of a
price change by calculating the frequency of positive and negative price changes in cents,
1¢, 2¢, 3¢,..., 50¢.4
3.1. Findings for the Full Sample
Figure 2 shows the cross-category average frequency of positive and negative
price changes. We immediately note an interesting and robust regularity: there are more
frequent small price increases than decreases. We call this asymmetry “in the small.” The
asymmetry lasts for price changes of up to about 10-15 cents, which is equivalent to
about 5 percent given that the average price at a retail supermarket is about $2.50 (Levy,
3
If the item was on sale or if the retailer’s coupon was used, then the data reflect that. The prices are set on a chain-wide basis but there is some variation across the stores (Barsky et al 2003a, Chevalier et al 2003). We use the data available from all stores.
4 All the analyses reported below were repeated for price changes in percents (1%, 2%,... 50%). Our substantive
et al., 1997; Bergen, et al., 2004). Beyond that, the two lines crisscross each other and
thus, the systematic asymmetry disappears.
In Figures 3a-3c, we plot the frequency of positive and negative price changes by
product categories. Table 2 reports the corresponding z-test results. Under the null, there
are equal number of price increases and decreases for each size of price change. We
define an “asymmetry threshold” as the last point at which the asymmetry is supported
statistically, that is, the last point at which the frequency of price increases exceeds the
frequency of price decreases of the same absolute magnitude (z≥ 1.96).5 As shown in the
“Full Sample” column, in four categories the asymmetry threshold is below 5¢, and in
two categories it exceeds 25¢. In most categories, however, the asymmetry threshold
falls in the range of 5¢-25¢, averaging 11.3¢.”6
3.2. Could It Be Inflation? Findings for Low-Inflation and Deflation Periods
The most immediate explanation for the above findings might be the U.S inflation
during the sample period (see the PPI-inflation figures in Table 3).7 During inflation we
expect more price increases than decreases, ceteris paribus (Ball and Mankiw, 1994).8
We, therefore, ask whether the asymmetry found in the full sample, also holds when
inflationary periods are excluded from the analysis. Given the large sample we have,
such an analysis is indeed feasible.
We conduct two specific analyses. The first includes only those observations
during which the monthly PPI inflation does not exceed 0.1 percent, which we define as a
low-inflation period. In the second analysis, we include only those observations in which
the monthly PPI inflation rate is non-positive, which we define as a deflation-period.9
For the low-inflation sample (the middle column of Table 2), the asymmetry
5 Out statistical procedure allows for no asymmetry as well as for reverse asymmetry. In this particular analysis, we do
not find any such case. There are very few of them in later analyses too (see Tables 4-9).
6
Considering price changes of up to 50¢ appears sufficient given our focus on the asymmetry in the small. We have actually calculated the price changes of all sizes, and found that most price changes are indeed smaller than 50¢. Further, the full sample contains a total of 10,298,995 price increases and 9,438,350 price decreases, and thus in total, there are more price increases than decreases. Further, 1¢, 2¢, 3¢, 4¢, and 5¢ increases account for 3.60%, 3.50%, 3.39%, 3.30%, and 3.20% of all price increases, respectively. In other words, 17.09% of the price increases are of 5¢ or less. In contrast, 1¢, 2¢, 3¢, 4¢, and 5¢ decreases account for 2.49%, 2.88%, 2.75%, 2.99%, and 2.88% of all price increases, respectively. In other words, 14.00% of price decreases are of 5¢ or less. Thus, our findings hold for the entire data set as well.
7
These findings cannot be explained by promotions or sales, as promotions likely generate more price decreases than increases, which is opposite to what we observe. In addition, a sale-related temporary price reduction is usually followed by a price increase at the end of the sale period (Rotemberg 2002). Price promotions, therefore, cannot produce the observed asymmetry.
8
A counter-argument to this idea is that if the reason for the asymmetry was inflation, then we would see the
asymmetry not only “in the small” but also “in the large.” The data, however, do not exhibit asymmetry “in the large.”
9
threshold is 8.2¢ on average. At the category level, the asymmetry holds in all but one
category (bath soap), with some decrease in the thresholds, the majority falling between
2¢ and 20¢. In the deflation period sample, column 3 of Table 2, the threshold is 6.2¢, on
average. At the category level, we still find asymmetry “in the small” for all but two
categories, bath soap and frozen entrees.
Thus, the asymmetry thresholds decrease as we move from the full sample to the
low inflation sample and further to the deflation sample, suggesting that inflation likely
plays a role in the asymmetry. However, a substantial proportion of the asymmetry
remains unexplained.
3.3. Robustness Checks
The above analyses suggest that inflation cannot explain fully our findings. We
check the robustness of this conclusion by using six different tests. All confirm the
conclusion that inflation at best offers a partial explanation for the documented
asymmetry.
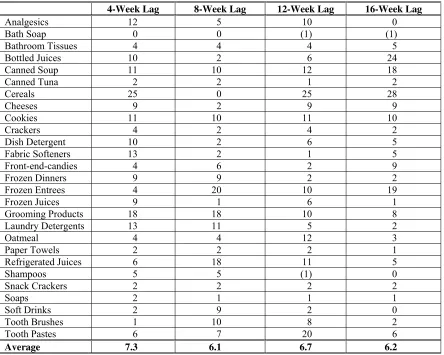
(i) Lagged Price Adjustment
The analysis so far assumed instantaneous price adjustment. We now allow
lagged adjustment. The speed of adjustment of retail prices vary between 4 weeks (Dutta,
et al. 2002; Müller and Ray, 2007) and 16 weeks (Bils and Klenow, 2004). Therefore, we
repeat the analysis under four possible lags: 4 weeks, 8 weeks, 12 weeks, and 16 weeks.
The results, reported in Table 4, suggest that the asymmetric adjustment in the small
holds for 25 of the 27 categories, the exception being bath soups and shampoos. In 99 of
the 108 cases presented in the table, that is, in 92 percent of the cases, the thresholds are
positive, averaging 6.6¢.
(ii) Alternative Measures of Inflation
The above analysis was based on the PPI. We, therefore, repeat the analysis using
two other measures of inflation: CPI, and CPI-Chicago. The latter is useful as it covers
the area where most Dominick’s stores operate. The CPI and CPI-Chicago inflation
series (Table 3) indicate fewer deflationary periods, reducing the sample size even
further. Yet, the results remain unchanged. According to Table 5 there is asymmetry in
all but two categories, with the average threshold of 6.9¢.
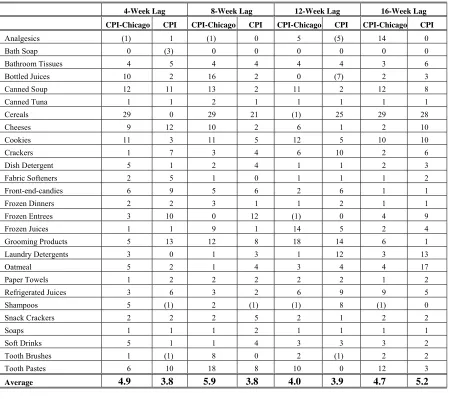
The analysis in (ii) assumes flexible prices. To allow for lagged price adjustment,
we repeat the analysis with 4-, 8-, 12-, and 16-week adjustment lags using the CPI and
the CPI-Chicago measures of inflation. The figures in Table 6 suggest that for the
overwhelming majority of the categories, the asymmetry still holds. Of the 216 cases
reported in the table, in 185, i.e., in 86% of the cases, the asymmetry still remains, with
the average threshold of 4.5¢.
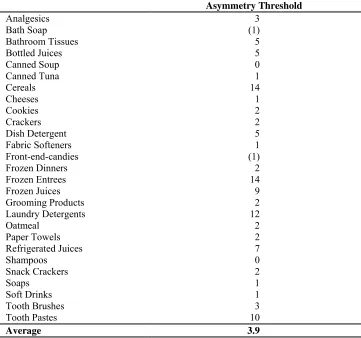
(iv) Products for Which Prices Have Not Increased During the Sample Period
As another test we consider only the products for which prices have not increased
during the sample period.10 The figures in Table 7 indicate that in 23 of the 27 categories,
i.e., in over 85 percent of the cases, we observe asymmetry. Thus, even if we limit the
analysis only to the products whose prices have not increased, we find that the asymmetry
in the small still holds.
(v) First Year of the Sample Period vs. the Last Year of the Sample Period
The period from September 1989 to May 1997 is characterized by a downward
inflation trend. For example, the inflation rate was higher during 1989−1990 (the start of our sample) than during 1996−1997 (the end of our sample): PPI, 5.0 percent vs. -0.01 percent; CPI, 5.3 percent vs. 2.2 percent; and CPI-Chicago, 4.8 percent vs. 2.2 percent. If
inflation is the main reason for the asymmetry, then the asymmetry should be stronger
during the first 12 months than during the last 12 months. The results are reported in
Table 8. Six of the 27 product categories had no observations during the first year. In the
remaining 21 categories, we have only two categories (canned tuna and soft drink), where
the asymmetry threshold is higher in the first 12 months. In the remaining 19 categories,
that is, in over 90 percent of the categories, we see greater asymmetry in the last 12
months of the sample, averaging 9.0¢ in comparison to 0.6¢ in the first 12 months. A
paired t-test comparing the asymmetry thresholds across the 19 product categories
indicates that on average the asymmetry threshold is bigger in the last 12 months than in
the first 12 months of the sample (t20 = 4.799, p = .000).11 Thus, for the overwhelming
majority of the cases, there was a stronger asymmetry at the end of the sample when
10
We compare the average prices during the first 4-weeks and the last 4-weeks of the sample period. The use of an 8-week window yielded similar results. In this comparison, we use the list price, if it differs from the actual price, in order to avoid any effect of sales on the results. In conducting the asymmetry analysis, however, we use the actual prices to make the current results comparable to the previous results.
11
inflation was low.
(vi) Asymmetry and Annual Inflation Rates
In our data, deflation months are scattered throughout the eight-year period.
Therefore, in order to further check how asymmetry varies with inflation rates, we
calculate the asymmetry threshold for each product category for each of the 7 calendar
years in the data, and match them up with the annual inflation rates (see Table 9). This
analysis reveals a negative linear relationship between the asymmetry threshold and the
annual inflation rate (with PPI, t = 1.87, d.f. = 171, 1-tailed p = .03; with CPI-national, t =
3.15, d.f. =171, p < .01; with CPI-Chicago t = 2.04, d.f. = 171, p < .05). Thus the
asymmetry diminishes as inflation increases, further calling into question the role of
inflation as a sole cause of the observed asymmetry.
4. Explaining Asymmetric Price Adjustment “in the Small”
“MINNEAPOLIS (AP) - The cost of General Mills cereals such as Wheaties Cheerios, and Total is increasing an average of 2 percent. The price jump averages out to roughly 6 or 7 cents a box for cereals such as Chex, Total Raisin Bran and Total Corn Flakes, ... which typically cost around $3 in the Minneapolis area, ... John French, 30, doubted he would even notice the higher prices for cereal on his next grocery trip. ‘A few cents? Naw, that’s no big deal,’ said French, of Plymouth, MN” (our emphasis.)
Associated Press, June 2, 2001, 7:20am ET (“General Mills Hikes Prices”)
The analyses presented in section 3 suggest that inflation cannot account fully for
the observed asymmetry in the small. Next, therefore, we examine the possibility that
other existing theories of price adjustment can explain our findings. The main existing
theories of asymmetric price adjustment besides inflation include capacity constraints,
vertical market linkages, imperfect competition, and menu costs under inflation (Blinder,
et al. 1998).
Although these theories can explain asymmetric price adjustment in general, it
appears that they are unable to explain the specific form of asymmetric price adjustment
we document here. For example, the theory of capacity constraints emphasizes the
asymmetry in the sellers’ ability to adjust inventory to price fluctuations. This theory,
however, predicts that asymmetric adjustment should be observed especially for large
price changes because small price changes are less likely to make capacity constraints
binding. This is the opposite of what we observe in our data. Similarly, theories based on
vertical channel linkages (Peltzman 2002) and imperfect competition (Neumark and
Sharpe, 1992) cannot explain simultaneous asymmetry in the small and symmetry in the
systematically between small and large price changes. Clearly, large-scale changes in the
market or the channel structure are too slow and infrequent to explain variation in
adjustment across small and large price changes.12 Another possible explanation is menu
cost (Levy et al., 1997 and 1998; Dutta et al., 1999) under inflation (Tsiddon, 1993; Ball
and Mankiw, 1994). However, if the reason for the asymmetry we find were inflation and
menu cost, then we should not have seen asymmetry in periods of low-inflation, and
even more so in periods of deflation. Therefore, it is unlikely that the observed
asymmetry is completely driven by inflation.13
Thus, the findings of asymmetric price adjustment in the small but symmetric
adjustment in the large seem inconsistent with the existing models of price adjustment.
We, therefore, offer another possible explanation. We posit that consumers may choose
to be inattentive to information about small price changes if processing and responding to
such information is costly. Customers are often engaged in purchasing tens and
occasionally hundreds of—different goods. The costs of processing and reacting to the
large amount of information are non-trivial. Calculating the optimal purchase behavior
for every possible price, for example, is a costly process requiring time and mental
resources. Because consumers have limited time and other resources to process the large
amount of information they face every day, they must rely on cost-benefit analysis to
decide what information is worth their attention. If the cost of processing information on
a price change exceeds the benefit, then the customer might choose to ignore and not
react to the price change. This is most likely to happen for small price changes, because
the costs of processing and reacting to small price changes might outweigh the benefits.
Yet, when the price changes are large, the benefit of processing the price change
information might exceed the cost, and thus the consumer will likely respond to large
price changes. This explanation is consistent with the recent literature on rational
inattention (Akerlof, 2000; Ball, Mankiw and Reis, 2005; Adam, 2005; Mankiw and Reis
2002; Sims, 2003; Reis 2006a, 2006b; Woodford 2002; Shugan, 1980).
Now, consider a retailer who faces inattentive customers and thus sees a region
on the demand curve around the current price where his customers’ price sensitivity is
low for both small price increases and small price decreases. The consumers’ reduced
12
This conclusion likely holds for any explanation that relies on institutional features and arrangements.
13
price sensitivity to small price decreases makes small price decreases less valuable to the
retailer because the lower price does not trigger the consumer’s response: she does not
buy more. However, a small price increase will be very valuable to the retailer for the
same reason: his consumer will not reduce her quantity purchased. In other words, the
reduced price sensitivity in both directions will give the retailer an incentive to undertake
more frequent small price increases than decreases. A large price change, however,
triggers customer reaction, and thus the retailer has no incentive to make asymmetric
price changes. Consumers know that retailers know about their inattention. Both firms
and consumers, therefore, will expect asymmetric price adjustment in the small and thus
asymmetric price adjustment in the small can emerge as an equilibrium outcome.14,15
The idea that there exists a small region of inattention around the current price
along the demand curve is consistent with the theoretical findings of Fibich, et al. (2007),
as well as with the experimental evidence of Kalwani and Yim (1992), showing that
promotional price changes must exceed certain minimum thresholds to produce any
effect on purchase behavior. Our findings are also consistent with the empirical findings
reported in the marketing literature on “price indifference bands” (Kalyanaram and
Little, 1994). For example, according to McKinsey & Company (Baker, et al. 2001) the
price indifference band is 17 percent for health-and-beauty products and 10 percent for
engineered industrial components. Consistent with this, the common managerial intuition
is that price reductions of less than 15 percent do not attract enough customers to a sale
(Della, et al 1980; Gupta and Cooper 1992). This region of inaction is consistent also
with the literature on “just noticeable difference” in marketing (Monroe, 1970)
suggesting that, in lieu of Weber’s Law, people may be unable to perceive small
14
We shall note that in a world inhabited by inattentive consumers, small price decreases are still possible. The costs of consumer information processing may depend on, among other things, consumer’s opportunity cost of time, the ease with which she can carry out such calculations, her experience with doing this type of calculations which may be a function of the retail competitive environment among other things, and the amount of the calculations required. Pricing decisions, therefore, could vary over seasons (e.g., holiday vs. non-holiday), over competitors’ actions, across
individual products, across product categories, etc. because of the variation in the level of customer attentiveness across these and other dimensions. Also, there might be other possible reasons for why supermarket chains might choose to reduce prices by small amounts. First, small price changes may be induced by competitive factors, such as price guarantees and price matches (Levy, et. al., 1997 and 1998), as well as by changes in supply conditions (Dutta, et. al., 2002; Levy, et al., 2002) and demand conditions (Warner and Barsky, 1995; Chevalier, et. al., 2003). Second, some food items sold by retail supermarket chains have an expiration date, and some of these products may go on sale as their expiration date approaches. And third, managers may be following simple pricing rules, such as “reduce all prices in some categories by 2%,” which could lead to small price reductions.
15
differences in the stimulus, and with Emery’s (1970) observation that “there is a region
of indifference about a standard price such that changes in price within this region
produce no change in perception.”16
The difference in how consumers react to small versus large price changes
resonate with Samuelson and Zeckhauser’s (1988, p. 35) claim that in the context of retail
shopping, “... it may be optimal for individuals to perform an analysis once, as their
initial point of decision, and defer to the status quo choice in their subsequent decisions,
barring significant changes in the relevant circumstances” (emphasis ours). To a similar
effect, Tobin (1982, p. 189) observes that “Some decisions by economic agents are
reconsidered daily or hourly, while others are reviewed at intervals of a year or longer
except when extraordinary events compel revisions” (our emphasis). Frank and
Jagannathan (1998, p. 188) suggest a similar mechanism in explaining stock price
behavior: “The idea is that for many investors it is not worth paying attention to small
dividends, while at sufficiently high dividend levels almost all investors pay attention.”
5. Potential Implications and Conclusion
We find overwhelming evidence of asymmetry for price changes of up to about
10 cents or 5 percent, on average. The asymmetry disappears for larger price changes. In
other words, we find a form of downward price rigidity which holds only "in the small."
These results hold for the full dataset and for almost every individual product category.
We find that inflation can offer only a partial explanation. Indeed, we find asymmetry
even if we consider only a low-inflation period sample, or only a deflation-period sample,
or if we consider only the products whose price had not increased. The findings are
robust across different measures of inflation, and after allowing for lagged price
adjustments. We explain our findings by arguing that price-setters might act strategically
to take advantage of the fact that their consumers face information processing costs by
making asymmetric price adjustments “in the small.”
Several implications follow. First, as far as we know, this type of asymmetry has
not been reported in the literature before, often flying under the radar screen. For
example, Peltzman (2000) finds no asymmetry in Dominick’s dataset (because of his
focus on large and more time aggregated—i.e., monthly instead of weekly—price
16
The possibility that consumers may be inattentive to small price changes is also consistent with the observation that the retailers find it necessary to alert the public about their promotions by posting sale signs (often large and in color, and at the end of the aisle) indicating the new reduced price. Such signs help ensure that shoppers notice and react to
changes). Baudry, et al. (2004) study French micro data for the 1994-2003 period. Figure
9 in their paper (on p. 55) clearly indicates an asymmetric price adjustment “in the small”
although the authors fail to “notice” it... and thus they never discuss it. A similar form of
asymmetry is found also in Spanish data for the 1993-2001 period (Álvarez and
Hernando, 2004), although these authors also fail to notice and discuss it. These suggest
that asymmetric price adjustment in the small might be more prevalent than we think.17
Second, the explanation we offer for our findings is novel because it suggests that
the existence retail price adjustment costs combined with a channel structure can lead to
asymmetric price adjustment. It is widely accepted that price adjustment costs can be a
source of price rigidity (e.g., Mankiw, 1985). However, if we think of the information
processing cost of consumers as a form of price adjustment cost in a broad sense of the
term, then it follows that price adjustment cost in a channel setting can also lead to
asymmetric price adjustment in the small, i.e., to downward price rigidity “in the small”
(Blanchard 1983 and 1987, Gordon 1990, Basu 1995, Chevalier et al 2003, and Ray, et al,
2006).
This explanation for the finding of asymmetric price adjustment in the small is
consistent with the idea of rational inattention, as formulated by Akerlof, 2000; Ball,
Mankiw and Reis, 2005; Adam, 2005; Mankiw and Reis 2002; Sims, 2003; Reis 2006a,
2006b; and Woodford 2002. Most of these studies, however, focus on aggregate
implications of rational inattention. We believe that our findings offer micro-based
evidence on a possible importance of rational inattention for the dynamics of individual
prices. In addition, at the level of individual price fluctuations, we find patterns that are
different from what the standard monetary economy models predict. This adds additional
micro-level evidence to the findings of Golosov and Lucas (2003), Klenow and Kryvtsov
(2003), Klenow and Willis (2006), Warner and Barsky (1995), and Knotek (2006) who
explore explanations for the divergent behavior of individual prices on the one hand and
aggregate price level on the other.
Taken together, our findings and their explanation suggest that there might be
important differences in the response of markets to small vs. large changes. This is
consistent with recent empirical findings that price reactions to small cost shocks differ
from price reactions to large cost shocks (Dutta, et al. 2002), and with recent empirical
field work that studies organizations’ conduct when they face decisions about small vs.
17
large price changes (Zbaracki, et al. 2004 and 2006). This is also consistent with
theoretical work exploring how the size of the price change impacts firms pricing
decisions (Cecchetti 1986, Rotemberg 1987, and Blinder et al 1998).
Our theory, thus, offers a possible explanation for the presence of small price
changes, which has been a long standing puzzle in the price adjustment literature. See, for
example, Carlton (1986), Kashyap (1995), Warner and Barsky (1995), Sheshinski and
Weiss (1993), and Lach and Tsiddon (2007). Our theory suggests that when the costs of
making small changes (menu costs) are offset by the possible gains accrued from an
inelastic demand curve, firms may find it optimal to engage in small price changes,
especially in small price increases.
We conclude with a brief discussion of the likely generalizability of our results. In
our setting, the retailer faces buyers with little at stake in the price of an individual item.
It is likely, therefore, that asymmetric price adjustment in the small will be present in
other settings such as Target, Wal-Mart, etc., where low-priced, commonly consumed
retail goods are sold. It is unclear, however, how generalizable our findings are to other
types of goods or markets. We know that are markets where attention is critical. For
example, in financial and business-to-business markets where transactions often involve
large quantities of the same asset, buyers will be more attentive. In fact, in these markets,
there are people whose only job is to pay attention to pennies or even less. In such
settings, it is unlikely to see asymmetry in the small. It is less clear whether inattentive
behavior will be optimal in other settings. For example, in markets for big-ticket items
people are likely to be more attentive because these transactions involve large
expenditures (Bell, et al., 1998; Nagle and Holden, 2002). However, even when
considering big-ticket items, shoppers might be inattentive—they may ignore some
rightmost digits (Lee et. al., 2006). For example, car shoppers may choose to be
inattentive to the rightmost digits, and thus focus on fourteen thousand eight hundred
dollars when the actual price is $14,889.00. This would create some room for asymmetric
price adjustment in the small. In future work, therefore, it will be valuable to study other
References
Adam, Klaus (2005), “Optimal Monetary Policy with Imperfect Common Knowledge,” Working Paper.
Akerlof, G., et al. (2000), “Near-Rational Wage and Price Setting and the Optimal Rates of Inflation and Unemployment,” manuscript.
Álvarez, L. and I. Hernando (2004), “Price Setting Behavior in Spain: Facts Using Consumer Price Micro Data,” Working Paper, Banco de España (October). Bacon, R (1991) “Rockets and Feathers: The Asymmetric Speed of Adjustment of UK
Retail Gasoline Prices to Cost Changes,” Energy Economics 13, 211-8. Ball, L and N.G. Mankiw (1994), “Asymmetric Price Adjustment and Economic
Fluctuations,” Economic Journal 104(423), 247-261.
Ball, L N.G. Mankiw, and R. Reis (2005), “Monetary Policy for Inattentive Economies,”
Journal of Monetary Economics 52, 703-725.
Barsky, R. and E. Warner (1995), “The Timing and Magnitude of Retail Store Markdowns: Evidence from Weekends and Holidays,” Quarterly Journal of Economics 110, 321-52.
Barsky, R., et al. (2003a), “What Can the Price Gap between Branded and Private Label Products Tell Us about Markups?” in Scanner Data and Price Indexes, R. Feenstra and M. Shapiro, ed. (Chicago: University of Chicago Press), pp. 165-225.
Barsky, R., M. Kimball, and C. House (2003b), “Do Flexible Durable Goods Prices Undermine Sticky Price Models?” NBER Working Paper, No. 8932.
Basu, S (1995) “Intermediate Goods and Business Cycles: Implications for Productivity and Welfare,” American Economic Review 85(3), 512-531.
Baudry L, et al (2004) “Price Rigidity: Evidence from French CPI Micro-Data” ECB Working Paper 384.
Bell, D., et al. (1998), "Determining Where to Shop: Fixed and Variable Costs of Shopping," Journal of Marketing Research 35(3), August, 360-9.
Bergen M et al (2004) “When Little Things Mean a Lot: On the Inefficiency of Item Price Laws,” Bar-Ilan University and Emory University Working Paper.
Bils, M. and P. Klenow (2004), “Some Evidence on the Importance of Sticky Prices,”
Journal of Political Economy112(5), 947-985.
Blanchard, O.J. (1983), “Price Asynchronization and Price-Level Inertia,” in Dornbusch, R., Simonsen, M.H. (Eds.), Inflation, Debt, and Indexation (The MIT Press,
Cambridge, MA), pp. 3-24.
Blanchard, O.J. (1987), “Aggregate and Individual Price Adjustment,” Brookings Papers on Economic Activity 1, 57-109.
Blinder, A et al. (1998) Asking About Prices: A NewApproach to Understanding Price Stickiness (Russell Sage Foundation: NY, NY).
Boyde, M.S. and W.B. Brorsen (1988) "Price Asymmetry in the U.S. Pork Marketing Channel," North Central Journal of Agricultural Economics 10, 103-9.
Caplin, A. (1993), “Individual Inertia and Aggregate Dynamics,” in Optimal Pricing, Inflation, and the Cost of Price Adjustment, Eitan Sheshinski and Yoram Weiss (Cambridge: MIT Press), 19-45.
Caplin, A., et al. (2004), “The Absent-Minded Consumer,” NBER WP, No. 10216. Carlton, D. (1986), “The Rigidity of Prices,” American Economic Review 76, 637-58. Cecchetti, S. (1986), “The Frequency of Price Adjustment: A study of the Newsstand
Prices of Magazines,” Journal of Econometrics 31, 255-274.
Chevalier, Judith, Anil Kashyap, and Peter Rossi (2003), “Why Don’t Prices Rise during Periods of Peak Demand? Evidence from Scanner Data,” American Economic Review 93, 15-37.
Davis, M and J Hamilton (2004), “Why Are Prices Sticky? The Dynamics of Wholesale Gasoline Prices,” Journal of Money, Credit and Banking 36, Number 1, 17-37. Downs, Anthony (1957) An Economic Theory of Democracy (New York: Harper). Dutta, S., et al. (2002) “Price Flexibility in Channels of Distribution: Evidence from
Scanner Data,” Journal of Economic Dynamics and Control 26, 1845-1900.
Dutta, S., et al. (1999), “Menu Costs, Posted Prices, and Multiproduct Retailers,” Journal of Money, Credit, and Banking 31(4), 683-703.
Frank M and R Jagannathan (1998) "Why Do Stock Prices Drop by Less than the Value of the Dividend?" Journal of Financial Economics 47, 161-88.
Fibich et al (2007) “Optimal Price Promotion in the Presence of Asymmetric Reference-Price Effects” Managerial and Decision Economics, Special Issue on "Price Rigidity and Flexibility: Recent Theoretical Developments," forthcoming.
Gordon, R. (1990) “What is New-Keynesian Economics?” Journal of Economic Literature
1115-1171.
Hannan, T and A Berger (1991), “The Rigidity of Prices: Evidence from the Banking Industry,” American Economic Review 81, 938-45.
Kahneman, D., et al. (1986), "Fairness as a Constraint on Profit Seeking: Entitlements in the Market," American Economic Review, Volume 76, No. 4 (September), 728-741. Kalyanaram, G and J.D.C. Little (1994), “An Empirical Analysis of Latitude of Price
Acceptance in Consumer Package Goods”, Journal of Consumer Research 21, No. 3, (December), 408-418.
Karrenbrock, J.D. (1991) “The Behavior of Retail Gasoline Prices: Symmetric or Not?”
Federal Reserve Bank of St. Louis Review73, 19-29.
Kashyap, A. (1995), “Sticky Prices: New Evidence from Retail Catalogues,” Quarterly Journal of Economics110, 245-274.
Klenow P and J. Willis (2006), "Sticky Information and Sticky Prices," manuscript, Federal Reserve Bank of Kansas City.
Knotek, E.S. II (2006), "A Tale of Two Rigidities: Sticky Prices in a Sticky-Information Environment," manuscript, Federal Reserve Bank of Kansas City.
Lach, S., Tsiddon, D., 1992. The behavior of prices and inflation: an empirical analysis of disaggregated data. Journal of Political Economy 100(2), 349-389.
Lach, S. and D. Tsiddon (1996), “Staggering and Synchronization in Price-Setting: Evidence from Multiproduct Firms.” American Economic Review 86, 1175-1196. Lach, S. and D. Tsiddon (2007), “Small Price Changes and Menu Costs,” Managerial
and Decision Economics, Special Issue on "Price Rigidity and Flexibility: New Empirical Evidence," forthcoming.
Lee Dongwon, et al (2006), “Price Points and Price Rigidity,” manuscript, Bar-Ilan University.
Levy, D., et al. (1997), “The Magnitude of Menu Costs: Direct Evidence from Large U.S. Supermarket Chains,” Quarterly Journal of Economics 112(3), 791-825.
Levy, D., et al. (2002), “Heterogeneity in Price Rigidity: Evidence from a Case Study Using Micro-Level Data” Journal of Money, Credit and Banking 34(1), 197-220. Levy, D. and A. Young (2004), “The Real Thing: Nominal Price Rigidity of the Nickel
Coke, 1886-1959,” Journal of Money, Credit and Banking 36(4), 765-799.
Mankiw, NG and D Romer (1991) New Keynesian Economics, Volumes 1 and 2 (The MIT Press, Cambridge, MA).
Mankiw NG and R Reis (2002) “Sticky Decisions versus Sticky Prices: A Proposal to Replace the New Keynesian Phillips Curve” Quarterly Journal of Economics, 1295-1328.
Müller, G. and S. Ray (2007), “Asymmetric Price Adjustment: Evidence from Weekly Product-Level Scanner Price Data,” Managerial and Decision Economics, Special Issue on "Price Rigidity and Flexibility: New Empirical Evidence," forthcoming. Nagle, T. and R. Holden (2002), The Strategy and Tactics of Pricing (Prentice Hall). Neumark D and S Sharpe (1992) “Market Structure and the Nature of Price Rigidity:
Evidence from the Market for Consumer Deposits” Quarterly Journal of Economics
Volume 107, 657-80.
Oh, W. and H. Lucas (2006), “Information Technology and Pricing Decisions: Price Adjustments in Online Computer Markets,” MIS Quarterly, forthcoming. Okun A (1981) Prices and Quantities: A Macroeconomic Analysis (Washington DC:
Brookings Institution).
Peltzman S (2000) “Prices Rise Faster than They Fall” Journal of Political Economy, Volume 108, 466-502.
Pick, D, J Karrenbrock and H Carmen (1991) "Price Asymmetry and Marketing Margin Behavior: An Example for California-Arizona Citrus" Agribusiness 6, 75-84.
Ray, S. et al. (2006), “Asymmetric Wholesale Pricing: Theory and Evidence,” Marketing Science 25(2), March-April 2006, 131-154.
Reis R (2006a) “Inattentive Consumers” Journal of Monetary Economics 53, 1761-1800. Reis R (2006b) “Inattentive Producers,” Review of Economic Studies73, 793-821.
Rotemberg, J. (1987), “The New Keynesian Microfoundations,” NBER Macroeconomics Annual, 69-104.
Rotemberg, J. (2002), “Customer Anger at Price Increases, Time Variation in the Frequency of Price Changes, and Monetary Policy,” NBER WP, No. 9320. Samuelson, W. and R. Zeckhauser (1988), “Status Quo Bias in Decision-Making,”
Journal of Risk and Uncertainty1, 7-59.
Shugan, S. (1980), “The Cost of Thinking,” Journal of Consumer Research 7, 99-111. Sims C (2003) “Implication of Rational Inattention” Journal of Monetary Economics
Volume 50, 665-90.
Tobin, J. (1982), “Money and Finance in the Macroeconomic Process,” Journal of Money, Credit and Banking 14(2), 171-204.
Tsiddon, D. (1993), "The (Mis)Behavior of the Aggregate Price Level," Review of Economic Studies, Volume 60, 889-902.
Urbany, J, et al. (1996), “Price Search in Retail Grocery Markets,”Journal of Marketing, 90-104.
Ward R (1982) "Asymmetry in Retail, Wholesale and Shipping Point Pricing for Fresh Vegetables" American Journal of Agricultural Economics 14, 205-12.
Zbaracki, M et al (2004), “Managerial and Customer Cost of Price Adjustment: Direct Evidence from Industrial Markets” Review of Economics and Statistics 86, 514-33. Zbaracki, M et al (2006), “The Anatomy of a Price Cut: Discovering Organizational
Category
Number of Observations
Proportion of the Total
Number of Products
Number of Stores
Mean Price
Std. Dev.
Min. Price
Max. Price
Analgesics 3,059,922 0.0310 638 93 $5.18 $2.36 $0.47 $23.69
Bath Soap 418,097 0.0042 579 93 $3.16 $1.60 $0.47 $18.99
Bathroom Tissue 1,156,481 0.0117 127 93 $2.10 $1.68 $0.25 $11.99
Beer 1,970,266 0.0200 787 89 $5.69 $2.70 $0.99 $26.99
Bottled Juice 4,324,595 0.0438 506 93 $2.24 $0.97 $0.32 $8.00
Canned Soup 5,549,149 0.0562 445 93 $1.13 $0.49 $0.23 $5.00
Canned Tuna 2,403,151 0.0244 278 93 $1.80 $1.07 $0.22 $12.89
Cereals 4,747,889 0.0481 489 93 $3.12 $0.76 $0.25 $7.49
Cheeses 7,571,355 0.0767 657 93 $2.42 $1.12 $0.10 $16.19
Cigarettes 1,810,614 0.0183 793 93 $7.69 $7.90 $0.59 $25.65
Cookies 7,634,434 0.0774 1,124 93 $2.10 $0.63 $0.25 $8.79
Crackers 2,245,305 0.0228 330 93 $2.01 $0.57 $0.25 $6.85
Dish Detergent 2,183,013 0.0221 287 93 $2.34 $0.90 $0.39 $7.00
Fabric Softeners 2,295,534 0.0233 318 93 $2.82 $1.45 $0.10 $9.99
Front-End-Candies 3,952,470 0.0400 503 93 $0.61 $0.24 $0.01 $6.99
Frozen Dinners 1,654,051 0.0168 266 93 $2.37 $0.89 $0.25 $9.99
Frozen Entrees 7,231,871 0.0733 898 93 $2.33 $1.06 $0.25 $15.99
Frozen Juices 2,373,168 0.0240 175 93 $1.39 $0.45 $0.22 $6.57
Grooming Products 4,065,691 0.0412 1,381 93 $2.94 $1.37 $0.49 $11.29
Laundry Detergents 3,302,753 0.0335 581 93 $5.61 $3.22 $0.25 $24.49
Oatmeal 981,106 0.0099 96 93 $2.65 $0.66 $0.49 $5.00
Paper Towels 948,550 0.0096 163 93 $1.50 $1.41 $0.31 $13.99
Refrigerated Juices 2,176,518 0.0221 225 93 $2.24 $0.91 $0.39 $7.05
Shampoos 4,676,731 0.0474 2,930 93 $2.95 $1.79 $0.27 $29.99
Snack Crackers 3,509,158 0.0356 420 93 $2.18 $0.57 $0.10 $8.00
Soaps 1,834,040 0.0186 334 93 $2.51 $1.48 $0.10 $10.99
Soft Drinks 10,547,266 0.1069 1,608 93 $2.34 $1.89 $0.10 $26.02
Toothbrushes 1,852,487 0.0188 491 93 $2.18 $0.85 $0.39 $9.99
Toothpastes 2,997,748 0.0304 608 93 $2.43 $0.89 $0.31 $10.99
Total 98,691,750 1.0000 18,037 93
Note:
[image:19.612.73.547.108.512.2]Full Sample Low-Inflation Sample Deflation Sample
Analgesics 30 10 10
Bath Soap 6 0 0
Bathroom Tissues 6 4 4
Bottled Juices 12 15 12
Canned Soup 12 12 10
Canned Tuna 1 2 1
Cereals 29 24 1
Cheeses 9 9 9
Cookies 11 11 9
Crackers 10 2 4
Dish Detergent 5 4 6
Fabric Softeners 5 11 7
Front-end-candies 5 5 5
Frozen Dinners 2 10 6
Frozen Entrees 20 22 0
Frozen Juices 9 9 10
Grooming Products 20 12 12
Laundry Detergents 16 13 17
Oatmeal 25 2 5
Paper Towels 2 2 2
Refrigerated Juices 15 9 6
Shampoos 0 10 10
Snack Crackers 11 2 2
Soaps 1 1 1
Soft Drinks 5 3 5
Tooth Brushes 20 3 3
Tooth Pastes 18 14 6
Average 11.3 8.2 6.2
Note:
*PPI = Producer Price Index
[image:20.612.91.522.109.478.2]Year Month PPI %∆PPI CPI %∆CPI CPI-Chicago %∆CPI-Chicago 1989 September 113.6 - 125.0 - 127.1 -
1989 October 114.9 1.14 125.6 0.5 126.8 −0.2
1989 November 114.9 0.00 125.9 0.2 126.7 −0.1
1989 December 115.4 0.44 126.1 0.2 126.5 −0.2
1990 January 117.6 1.91 127.4 1.0 128.1 1.3
1990 February 117.4 −0.17 128.0 0.5 129.2 0.9
1990 March 117.2 −0.17 128.7 0.5 129.5 0.2
1990 April 117.2 0.00 128.9 0.2 130.4 0.7
1990 May 117.7 0.43 129.2 0.2 130.4 0.0
1990 June 117.8 0.08 129.9 0.5 131.7 1.0
1990 July 118.2 0.34 130.4 0.4 132.0 0.2
1990 August 119.3 0.93 131.6 0.9 133.2 0.9
1990 September 120.4 0.92 132.7 0.8 133.8 0.5
1990 October 122.3 1.58 133.5 0.6 133.3 −0.4
1990 November 122.9 0.49 133.8 0.2 134.2 0.7
1990 December 122.0 −0.73 133.8 0.0 134.6 0.3
1991 January 122.3 0.25 134.6 0.6 135.1 0.4
1991 February 121.4 −0.74 134.8 0.1 135.5 0.3
1991 March 120.9 −0.41 135.0 0.1 136.2 0.5
1991 April 121.1 0.17 135.2 0.1 136.1 −0.1
1991 May 121.8 0.58 135.6 0.3 136.8 0.5
1991 June 121.9 0.08 136.0 0.3 137.3 0.4
1991 July 121.6 −0.25 136.2 0.1 137.3 0.0
1991 August 121.7 0.08 136.6 0.3 137.6 0.2
1991 September 121.4 −0.25 137.2 0.4 138.3 0.5
1991 October 122.2 0.66 137.4 0.1 138.0 −0.2
1991 November 122.3 0.08 137.8 0.3 138.0 0.0
1991 December 121.9 −0.33 137.9 0.1 138.3 0.2
1992 January 121.8 −0.08 138.1 0.1 138.9 0.4
1992 February 122.1 0.25 138.6 0.4 139.2 0.2
1992 March 122.2 0.08 139.3 0.5 139.7 0.4
1992 April 122.4 0.16 139.5 0.1 139.8 0.1
1992 May 123.2 0.65 139.7 0.1 140.5 0.5
1992 June 123.9 0.57 140.2 0.4 141.2 0.5
1992 July 123.7 −0.16 140.5 0.2 141.4 0.1
1992 August 123.6 −0.08 140.9 0.3 141.9 0.4
1992 September 123.3 −0.24 141.3 0.3 142.7 0.6
1992 October 124.4 0.89 141.8 0.4 142.1 −0.4
1992 November 124.0 −0.32 142.0 0.1 142.4 0.2
1992 December 123.8 −0.16 141.9 −0.1 142.9 0.4
1993 January 124.2 0.32 142.6 0.5 143.2 0.2
1993 February 124.5 0.24 143.1 0.4 143.6 0.3
1993 March 124.7 0.16 143.6 0.3 144.1 0.3
1993 April 125.5 0.64 144.0 0.3 144.7 0.4
1993 May 125.8 0.24 144.2 0.1 145.7 0.7
1993 June 125.5 −0.24 144.4 0.1 145.6 −0.1
1993 July 125.3 −0.16 144.4 0.0 145.5 −0.1
1993 October 124.6 0.65 145.7 0.4 147.2 0.3
1993 November 124.5 −0.08 145.8 0.1 146.4 −0.5
1993 December 124.1 −0.32 145.8 0.0 146.1 −0.2
1994 January 124.5 0.32 146.2 0.3 146.5 0.3
1994 February 124.8 0.24 146.7 0.3 146.8 0.2
1994 March 124.9 0.08 147.2 0.3 147.6 0.5
1994 April 125.0 0.08 147.4 0.1 147.9 0.2
1994 May 125.3 0.24 147.5 0.1 147.6 −0.2
1994 June 125.6 0.24 148.0 0.3 148.1 0.3
1994 July 126.0 0.32 148.4 0.3 148.3 0.1
1994 August 126.5 0.40 149.0 0.4 149.8 1.0
1994 September 125.6 −0.71 149.4 0.3 150.2 0.3
1994 October 125.8 0.16 149.5 0.1 149.4 −0.5
1994 November 126.1 0.24 149.7 0.1 150.4 0.7
1994 December 126.2 0.08 149.7 0.0 150.5 0.1
1995 January 126.6 0.32 150.3 0.4 151.8 0.9
1995 February 126.9 0.24 150.9 0.4 152.3 0.3
1995 March 127.1 0.16 151.4 0.3 152.6 0.2
1995 April 127.6 0.39 151.9 0.3 153.1 0.3
1995 May 128.1 0.39 152.2 0.2 153.0 −0.1
1995 June 128.2 0.08 152.5 0.2 153.5 0.3
1995 July 128.2 0.00 152.5 0.0 153.6 0.1
1995 August 128.1 −0.08 152.9 0.3 153.8 0.1
1995 September 127.9 −0.16 153.2 0.2 154.0 0.1
1995 October 128.7 0.63 153.7 0.3 154.3 0.2
1995 November 128.7 0.00 153.6 −0.1 154.0 −0.2 1995 December 129.1 0.31 153.5 −0.1 153.8 −0.1
1996 January 129.4 0.23 154.4 0.6 154.6 0.5
1996 February 129.4 0.00 154.9 0.3 155.2 0.4
1996 March 130.1 0.54 155.7 0.5 156.3 0.7
1996 April 130.6 0.38 156.3 0.4 156.4 0.1
1996 May 131.1 0.38 156.6 0.2 156.9 0.3
1996 June 131.7 0.46 156.7 0.1 157.6 0.4
1996 July 131.5 −0.15 157.0 0.2 157.7 0.1
1996 August 131.9 0.30 157.3 0.2 158.1 0.3
1996 September 131.8 −0.08 157.8 0.3 158.3 0.1
1996 October 132.7 0.68 158.3 0.3 158.8 0.3
1996 November 132.6 −0.08 158.6 0.2 159.4 0.4
1996 December 132.7 0.08 158.6 0.0 159.7 0.2
1997 January 132.6 −0.08 159.1 0.3 160.4 0.4
1997 February 132.2 −0.30 159.6 0.3 161.1 0.4
1997 March 132.1 −0.08 160.0 0.3 161.0 −0.1
1997 April 131.6 −0.38 160.2 0.1 160.9 −0.1
1997 May 131.6 0.00 160.1 −0.1 161.1 0.1
Note: PPI – Producer Price Index
CPI – Consumer Price Index
4-Week Lag 8-Week Lag 12-Week Lag 16-Week Lag
Analgesics 12 5 10 0
Bath Soap 0 0 (1) (1)
Bathroom Tissues 4 4 4 5
Bottled Juices 10 2 6 24
Canned Soup 11 10 12 18
Canned Tuna 2 2 1 2
Cereals 25 0 25 28
Cheeses 9 2 9 9
Cookies 11 10 11 10
Crackers 4 2 4 2
Dish Detergent 10 2 6 5
Fabric Softeners 13 2 1 5
Front-end-candies 4 6 2 9
Frozen Dinners 9 9 2 2
Frozen Entrees 4 20 10 19
Frozen Juices 9 1 6 1
Grooming Products 18 18 10 8
Laundry Detergents 13 11 5 2
Oatmeal 4 4 12 3
Paper Towels 2 2 2 1
Refrigerated Juices 6 18 11 5
Shampoos 5 5 (1) 0
Snack Crackers 2 2 2 2
Soaps 2 1 1 1
Soft Drinks 2 9 2 0
Tooth Brushes 1 10 8 2
Tooth Pastes 6 7 20 6
Average 7.3 6.1 6.7 6.2
Note:
[image:23.612.86.530.105.460.2]Table 5. Asymmetry Thresholds in Cents, Deflation Period, Based on CPI-Chicago and CPI
CPI-Chicago CPI
Analgesics 7 10
Bath Soap (1) (1)
Bathroom Tissues 4 9
Bottled Juices 8 9
Canned Soup 14 10
Canned Tuna 1 1
Cereals 33 28
Cheeses 5 8
Cookies 4 11
Crackers 1 1
Dish Detergent 9 7
Fabric Softeners 8 3
Front-end-candies 7 9
Frozen Dinners 1 1
Frozen Entrees 11 10
Frozen Juices 5 7
Grooming Products 23 13
Laundry Detergents 20 9
Oatmeal 4 2
Paper Towels 2 2
Refrigerated Juices 9 6
Shampoos 5 (1)
Snack Crackers 6 3
Soaps 6 2
Soft Drinks 2 1
Tooth Brushes 1 8
Tooth Pastes 6 6
Average 7.4 6.4
Note:
4-Week Lag 8-Week Lag 12-Week Lag 16-Week Lag
CPI-Chicago CPI CPI-Chicago CPI CPI-Chicago CPI CPI-Chicago CPI
Analgesics (1) 1 (1) 0 5 (5) 14 0
Bath Soap 0 (3) 0 0 0 0 0 0
Bathroom Tissues 4 5 4 4 4 4 3 6
Bottled Juices 10 2 16 2 0 (7) 2 3
Canned Soup 12 11 13 2 11 2 12 8
Canned Tuna 1 1 2 1 1 1 1 1
Cereals 29 0 29 21 (1) 25 29 28
Cheeses 9 12 10 2 6 1 2 10
Cookies 11 3 11 5 12 5 10 10
Crackers 1 7 3 4 6 10 2 6
Dish Detergent 5 1 2 4 1 1 2 3
Fabric Softeners 2 5 1 0 1 1 1 2
Front-end-candies 6 9 5 6 2 6 1 1
Frozen Dinners 2 2 3 1 1 2 1 1
Frozen Entrees 3 10 0 12 (1) 0 4 9
Frozen Juices 1 1 9 1 14 5 2 4
Grooming Products 5 13 12 8 18 14 6 1
Laundry Detergents 3 0 1 3 1 12 3 13
Oatmeal 5 2 1 4 3 4 4 17
Paper Towels 1 2 2 2 2 2 1 2
Refrigerated Juices 3 6 3 2 6 9 9 5
Shampoos 5 (1) 2 (1) (1) 8 (1) 0
Snack Crackers 2 2 2 5 2 1 2 2
Soaps 1 1 1 2 1 1 1 1
Soft Drinks 5 1 1 4 3 3 3 2
Tooth Brushes 1 (1) 8 0 2 (1) 2 2
Tooth Pastes 6 10 18 8 10 0 12 3
Average 4.9 3.8 5.9 3.8 4.0 3.9 4.7 5.2
Note:
[image:25.612.83.534.107.506.2]the First 4 Weeks Was Greater or Equal to the Average Price during the Last 4 Weeks
Asymmetry Threshold
Analgesics 3
Bath Soap (1)
Bathroom Tissues 5
Bottled Juices 5
Canned Soup 0
Canned Tuna 1
Cereals 14
Cheeses 1
Cookies 2
Crackers 2
Dish Detergent 5
Fabric Softeners 1
Front-end-candies (1)
Frozen Dinners 2
Frozen Entrees 14
Frozen Juices 9
Grooming Products 2
Laundry Detergents 12
Oatmeal 2
Paper Towels 2
Refrigerated Juices 7
Shampoos 0
Snack Crackers 2
Soaps 1
Soft Drinks 1
Tooth Brushes 3
Tooth Pastes 10
Average 3.9
Note:
[image:26.612.124.485.120.458.2]Sample Size Asymmetry Threshold First 12 Months Last 12 Months First 12 Months Last 12 Months
Analgesics 312534 430029 0 16
Bath Soap 0 98529 - -
Bathroom Tissues 111584 165986 2 4
Bottled Juices 391379 611627 11 12
Canned Soup 657039 406997 0 24
Canned Tuna 290860 203939 3 2
Cereals 550364 672046 0 13
Cheeses 748883 949382 (1) 22
Cookies 970126 922640 1 10
Crackers 242707 402834 1 11
Dish Detergent 266158 308769 (4) 15
Fabric Softeners 243900 299302 0 1
Front-end-candies 525912 517081 (1) 1
Frozen Dinners 0 327646 - -
Frozen Entrees 782633 976451 1 20
Frozen Juices 236961 306801 1 13
Grooming Products 0 1010036 - -
Laundry Detergents 347556 376475 1 6
Oatmeal 0 168849 - -
Paper Towels 100437 119194 1 4
Refrigerated Juices 192878 319187 0 10
Shampoos 0 1209605 - -
Snack Crackers 377000 460508 (1) 3
Soaps 0 354449 - -
Soft Drinks 918306 1890469 0 (1)
Tooth Brushes 226573 238089 (3) 1
Tooth Pastes 317591 424639 1 2
Average 0.6 9.0
Note:
[image:27.612.72.540.107.569.2]1990 1991 1992 1993 1994 1995 1996
Analgesics (1) 7 8 3 0 8 3
Bath Soap - - 0 (1) 0 0 (1)
Bathroom Tissues 3 1 1 4 6 9 5
Bottled Juices 15 0 4 7 5 1 18
Canned Soup 0 12 0 10 11 8 9
Canned Tuna 1 1 2 2 1 0 2
Cereals 4 24 0 25 19 1 12
Cheeses (1) 5 1 9 2 2 23
Cookies 4 (1) 4 8 14 3 10
Crackers 1 2 1 2 4 1 10
Dish Detergent (3) 2 2 10 4 2 11
Fabric Softeners 0 5 11 5 1 1 1
Front-end-candies (1) 1 1 15 0 1 10
Frozen Dinners - - 9 4 1 1 1
Frozen Entrees (1) 0 10 10 (1) 1 20
Frozen Juices 0 (2) 2 3 9 9 9
Grooming Products - - 12 20 5 1 16
Laundry Detergents (4) 3 2 9 1 1 2
Oatmeal - 5 12 4 1 2 9
Paper Towels 1 0 1 1 2 9 1
Refrigerated Juices 0 4 2 8 3 9 25
Shampoos - - 6 20 2 (1) (1)
Snack Crackers (2) 0 2 2 1 12 9
Soaps - - 4 6 1 1 1
Soft Drinks 1 (1) (1) 5 3 4 13
Tooth Brushes (1) 8 8 (1) 3 7 1
Tooth Pastes 1 7 0 6 2 12 (1)
Average 0.8 3.8 3.9 7.3 3.7 3.9 8.1
Note:
The figures reported in the table are the cutoff points of what might constitute a “small” price change for each category. The cutoff point is the last point at which the asymmetry is supported statistically. The figures in parentheses indicate a reverse asymmetry, and 0 means that there is no asymmetry.
[image:28.612.97.518.91.456.2]0.30 0.40 0.50 0.60 0.70 0.80 0.90 1.00 1.10 1.20 1.30 1.40 1.50
0 16 32 48 64 80 96 112 128 144 160 176 192 208 224 240 256 272 288 304 320 336 352 368 384 400
Weeks
Figure 1. Price of Frozen Concentrate Orange Juice, Heritage House, 12oz (UPC = 3828190029, Store 78), September 14, 1989–May 8, 1997 (Source: Dutta, et al., 2002, and Levy, et al., 2002).
Notes: (1) Week 1 = Week of September 14, 1989, and Week 399=Week of May 8, 1997. (2) There are 6 missing observations in the series.
0 5000 10000 15000 20000 25000
0 10 20 30 40 50 60 70 80 90 100
[image:30.612.97.504.64.346.2]Price Change in Cents
Figure 2. Average Frequency of Positive and Negative Price Changes, All 29 Categories
0 2000 4000 6000 8000 10000 12000
0 5 10 15 20 25 30 35 40 45 50
Price Change in Cents
Positive 0 500 1000 1500 2000
0 5 10 15 20 25 30 35 40 45 50
Price Change in Cents
Positive 0 2000 4000 6000 8000 10000 12000 14000 16000 18000
0 5 10 15 20 25 30 35 40 45 50
Price Change in Cents
Bathroom Tissue Negative
Positive 0 5000 10000 15000 20000 25000
0 5 10 15 20 25 30 35 40 45 50
Price Change in Cents
Beer Negative Positive 0 5000 10000 15000 20000 25000 30000
0 5 10 15 20 25 30 35 40 45 50
Price Change in Cents
Bottled Juice Negative
Positive 0 10000 20000 30000 40000 50000 60000
0 5 10 15 20 25 30 35 40 45 50
Price Change in Cents
Canned Soup Negative
Positive 0 2000 4000 6000 8000 10000 12000 14000 16000 18000
0 5 10 15 20 25 30 35 40 45 50
Price Change in Cents
Canned Tuna Negative
Positive 0 5000 10000 15000 20000 25000
0 5 10 15 20 25 30 35 40 45 50
Price Change in Cents
Cereals Negative Positive 0 10000 20000 30000 40000 50000 60000 70000 80000 90000
0 5 10 15 20 25 30 35 40 45 50
Price Change in Cents
Cheeses Negative Positive 0 500 1000 1500 2000 2500 3000 3500
0 5 10 15 20 25 30 35 40 45 50
Price Change in Cents
Cigarettes Negative
[image:31.612.87.514.48.724.2]Positive
0 10000 20000 30000 40000 50000 60000
0 5 10 15 20 25 30 35 40 45 50
Price Change in Cents
Positive 0 5000 10000 15000 20000 25000
0 5 10 15 20 25 30 35 40 45 50
Price Change in Cents
Positive 0 5000 10000 15000 20000 25000
0 5 10 15 20 25 30 35 40 45 50
Price Change in Cents
Dish Detergent Negative
Positive 0 2000 4000 6000 8000 10000 12000 14000 16000
0 5 10 15 20 25 30 35 40 45 50
Price Change in Cents
Fabric Softeners Negative Positive 0 5000 10000 15000 20000 25000 30000 35000
0 5 10 15 20 25 30 35 40 45 50
Price Change in Cents
Front-End-Candies Negative Positive 0 1000 2000 3000 4000 5000 6000 7000 8000 9000 10000
0 5 10 15 20 25 30 35 40 45 50
Price Change in Cents
Frozen Dinners Negative
Positive 0 5000 10000 15000 20000 25000 30000 35000 40000 45000
0 5 10 15 20 25 30 35 40 45 50
Price Change in Cents
Frozen Entrees Negative
Positive 0 5000 10000 15000 20000 25000 30000 35000
0 5 10 15 20 25 30 35 40 45 50
Price Change in Cents
Frozen Juices Negative
Positive 0 5000 10000 15000 20000 25000 30000 35000 40000
0 5 10 15 20 25 30 35 40 45 50
Price Change in Cents
Grooming Products Negative Positive 0 2000 4000 6000 8000 10000 12000 14000 16000
0 5 10 15 20 25 30 35 40 45 50
Price Change in Cents
[image:32.612.89.517.53.720.2]Laundry Detergents Negative Positive
0 1000 2000 3000 4000 5000 6000
0 5 10 15 20 25 30 35 40 45 50
Price Change in Cents
Positive 0 2000 4000 6000 8000 10000 12000
0 5 10 15 20 25 30 35 40 45 50
Price Change in Cents
Positive 0 5000 10000 15000 20000 25000
0 5 10 15 20 25 30 35 40 45 50
Price Change in Cents
Refrigerated Juices Negative Positive 0 5000 10000 15000 20000 25000 30000 35000 40000 45000
0 5 10 15 20 25 30 35 40 45 50
Price Change in Cents
Shampoos Negative Positive 0 5000 10000 15000 20000 25000 30000 35000 40000
0 5 10 15 20 25 30 35 40 45 50
Price Change in Cents
Snack Crackers Negative
Positive 0 2000 4000 6000 8000 10000 12000 14000
0 5 10 15 20 25 30 35 40 45 50
Price Change in Cents
Soaps Negative Positive 0 50000 100000 150000 200000 250000
0 5 10 15 20 25 30 35 40 45 50
Price Change in Cents
Soft Drinks Negative
Positive 0 2000 4000 6000 8000 10000 12000
0 5 10 15 20 25 30 35 40 45 50
Price Change in Cents
Toothbrushes Negative Positive 0 5000 10000 15000 20000 25000 30000
0 5 10 15 20 25 30 35 40 45 50
Price Change in Cents
Toothpastes Negative Positive 0 100000 200000 300000 400000 500000 600000 700000 800000 900000
0 5 10 15 20 25 30 35 40 45 50
Price Change in Cents
Total Negative
[image:33.612.86.508.54.726.2]Positive
In Figure R1 we present the cross-category average frequency of positive and negative price changes in cents for the low/zero-inflation period sample.
In Figures R1.1a–R1.1c we present the frequency of positive and negative price changes in cents by categories for the low/zero-inflation period sample.
In Figure R2 we present the cross-category average frequency of positive and negative price changes in cents for the deflation period sample.
0 2000 4000 6000 8000 10000 12000 14000
0 10 20 30 40 50 60 70 80 90 100
[image:35.612.99.504.62.347.2]Price Change in Cents
Figure R1. Average Frequency of Positive and Negative Price Changes All 29 Categories, Low/Zero Inflation Period
Figure R1.1a. Frequency of Positive and Negative Retail Price Changes in Cents by Category, Low/Zero Inflation Period
0 200 400 600 800 1000 1200
0 5 10 15 20 25 30 35 40 45 50
Price Change in Cents
Positive 0 1000 2000 3000 4000 5000 6000 7000 8000 9000 10000
0 5 10 15 20 25 30 35 40 45 50
Price Change in Cents
Bathroom Tissue Negative
Positive 0 2000 4000 6000 8000 10000 12000 14000
0 5 10 15 20 25 30 35 40 45 50
Price Change in Cents
Beer Negative Positive 0 2000 4000 6000 8000 10000 12000 14000 16000 18000
0 5 10 15 20 25 30 35 40 45 50
Price Change in Cents
Bottled Juice Negative
Positive 0 5000 10000 15000 20000 25000
0 5 10 15 20 25 30 35 40 45 50
Price Change in Cents
Canned Soup Negative
Positive 0 1000 2000 3000 4000 5000 6000 7000 8000 9000 10000
0 5 10 15 20 25 30 35 40 45 50
Price Change in Cents
Canned Tuna Negative
Positive 0 2000 4000 6000 8000 10000 12000 14000
0 5 10 15 20 25 30 35 40 45 50
Price Change in Cents
Cereals Negative Positive 0 5000 10000 15000 20000 25000 30000 35000 40000 45000
0 5 10 15 20 25 30 35 40 45 50
Price Change in Cents
Cheeses Negative Positive 0 500 1000 1500 2000 2500 3000
0 5 10 15 20 25 30 35 40 45 50
Price Change in Cents
Cigarettes Negative Positive 0 1000 2000 3000 4000 5000 6000
0 5 10 15 20 25 30 35 40 45 50
Price Change in Cents