Journal of Criminal Law and Criminology
Volume 19
Issue 4
February
Article 10
Winter 1929
Study of the Relationship Between Intelligence and
Crime, A
Milton Hylan Erickson
Follow this and additional works at:
https://scholarlycommons.law.northwestern.edu/jclc
Part of the
Criminal Law Commons
,
Criminology Commons
, and the
Criminology and Criminal
Justice Commons
This Article is brought to you for free and open access by Northwestern University School of Law Scholarly Commons. It has been accepted for inclusion in Journal of Criminal Law and Criminology by an authorized editor of Northwestern University School of Law Scholarly Commons.
Recommended Citation
INTELLIGENCE AND CRIME
MILTON HYLAND ERICKSON, M. A., M. D.*
(References in the text are to the Bibliography on the last pages of this article.)
INTRODUCTION
The question of delinquency, which has ever constituted a grave social problem, is arousing a constantly increasing interest as a result of the recent application of scientific methods to the study of crime in all its varied phases. Indeed, before a truly scientific interest could be developed, it was necessary that there be a development of those sciences which throw light on human conduct and behavior such as biology, psychology, sociology, and psychiatry, and particularly so this last-named science. However, the great significance of the problem is scarcely appreciated as yet, and the field of study, so wide and fertile, is relatively untouched, although significant progress has been made in some directions. Possibly, the most notable of advances made has been the beginning recognition of delinquency as a problem belonging al-most entirely to the field of psychiatry rather than to the legal realm or to sociology, that field of normal human relationships. The avenues of approach for the study of this problem of delinquency and the aspects for consideration are exceedingly numerous, since every crime is the product of the complexities of human nature reacting in devious and incomprehensible ways to the complexities of the social order. For-merly, only the dull prosaic facts of social and economic existence were considered the sum total of essential knowledge concerning the crim-inal. Quite otherwise now, a study of crime necessitates in addition an investigation into the behavior reactions, mental attitudes, intellectual and emotional endowments, physical development, habits, predilections. idiosyncrasies, and all possible intimate and personal details of the indi-vidual offender in his daily life. Accordingly, any attempt at investiga-tion of this quesinvestiga-tion of such great moment to the welfare of societ, must be confined of necessity to one particular phase. Nor can any investigation hope to do more than add some small fact to the aggre-gate of knowledge essential for a proper evaluation and comprehension
of this most complex and intricate problem of human relationships. Only in this fashion may be reached, sometime in the remote future, a solution to this serious ill of civilization.
In this investigation, realizing that the intellectual endowment of the criminal might well constitute a significant force in anti-social behavior, an attempt has been made to throw some light upon the problem of crime by a study grounded fundamentally upon the grade of intelligence possessed by delinquents. Especially was this felt to be a valuable aspect for study since a careful survey of the literature revealed that practically nothing of a detailed and systematic nature had been done to ascertain the actual force exerted by the intellectual endowment upon criminalistic tendencies. Indeed, the literature obtainable yielded nothing more than broad speculations and generalizations upon feeble-mindedness and crime, with no attempt to specify or determine actual significant details and relationships of intelligence and criminality. This has been attempted in this investigation by grouping delinquents accord-ing to the general level of intelligence possessed, and then analyzaccord-ing these groups in accordance with various pertinent details concerning the individual. By so doing, it was hoped to reveal various crimino-logical trends and tendencies together with group differences and simi-larities, divergencies and peculiarities, direct and indirect relationships significant either positively or negatively of the influence exercised by intelligence, or the lack thereof, upon the manifestation of anti-social behavior, or tending in any way to explain the phenomena of crime. In addition, an effort was made to note any outstanding characteristics or associated facts becoming manifest during the course of the investi-gation which might serve to enable a better understanding of offenders either singly or collectively.
MATERIAL AND METHOD
this undertaking were the Milwaukee County House of Correction at Milwaukee, the \Visconsin State Prison at Waupun, and the Wisconsin State Reformatory at Green Bay. The period of time covered by this observation extends from July 1, 1926 to June 1, 1928, a period of nearly two years. From the entire number of examinations made for this period of tifue, a selection was made, based on sex, race, and age, and only those histories of white males twenty-one or more years of age were accepted, all duplicates being discarded. This was done to avoid the complications of sex and race and to exclude minors who may not, in all fairness, be compared to adults. A total of 1690 indi-vidual cases answering to the above specifications was thus obtained, and these cases were then divided into the four following groups:
1. Normal Intelligence Group comprising ... 852 cases
2. Subnormal or Low Intelligence Group comprising ... 327 cases
3. ttigh Grade Feebleminded Group comprising ... 408 cases 4. Low Grade Feebleminded Group comprising ... 103 cases
It may be very well stated here that the particular grade of intelli-gence possessed by the individual, if not obviously normal as shown by the scholastic record, was determined at the time of examination by the application of the Stanford Revision of the Binet-Simon Intelligence Tests. This was done by a qualified psychologist, with the result of the first examination confirmed, in many instances, by a retest. In addition, the history of the individual was regarded as confirmatory, and always considered in the diagnosis of the degree of intelligence possessed. particularly so in regard to the diagnosis of feeblemindedness. The Intelligence Quotient, or I. 0. as it is commonly termed, of .75, accepted by the American Association for the Study of Feebleminded-ness, was taken as the dividing line between mental deficiency and non-feeblemindedness. In establishing this Intelligence Quotient as the dividing line. no particular weight has been accorded the present aca-dlemic dispute aniong psychologists concerning the most acceptable and exact dividing point. Whether the dividing line is an Intelligence Quo-tient of .75, .70, .68, or .65, is essentially irrelevant to the purposes of this investigation, since it is desired only to determine the existence, positively or negatively, of an influence exerted by intelligence or the iack thereof upon criminality. There is neither hope nor expectation of determining the exact degree of this influence nor of ascertainin' the exact weight or quality of any possible relationship. Further, when
adjusment, as evidenced by conviction for criminality, justifies classifi-cation as feebleminded from medical. social, and legal aspects, if not entirely so from the viewpoint of academic psychology.
The range of the Intelligence Quotient for each of the intelligence levels indicated by the above groupings is presented in the following table taken from Richmond' and agreeing with Terman's classifi-cation :2
Intelliqence Quotient Range Normal Intelliqence ... .90 or more Subnormal or Low Intellqence ... .75 to .90 Hiqh Grade Feeblemindedness (High Grade Mllorons) ... 60 to .75 Low Grade Feeblemindedness (Low Grade Aforons) ... Below .60
The respective groups were then carefully analyzed in accordance with the tables given in the appendix to this paper, the tables showing both the numerical totals and the percentages for each item. From these tables, the significant facts and important percentages have been abstracted for use in the body of this discussion. thus obviating any need for constant reference to them.
DISTRIBUTION OF INTELLIGENCE
Since the recognition of the need of studying the criminal as an individual member of society, there has been a growing realization of the necessity of understanding and appreciating the extent and nature of his mental and intellectual endowment. With the develop-ment of standardized psychometric tests, a valuable means of estimating the intellectual endowment of the individual became practicable. The results of the application of these tests to the offenders included in this
investigation show the following genefal distribution:
Normal Intelligence Group ... 50.41% of all cases Subnormal or Low Intelligence Group ... 19.36%, of all cases High Grade Moron Group ... 24.14% of all cases Low Grade Moron Group ... 6.09% of all cases
Brigham,3 and the absolute errors of selection, improper methods of application, and the use of untrained testers, according to Terman,' render the results of the army tests exceedingly unreliable and not a fair criterion of the intelligence of the general public. Common judg-ment would lead, however, to the conclusion that far less than fifty per cent of the general public are subnormal. And this conclusion is substantiated by the findings of Terman who found less than 20% of a total of one thousand unselected school children with an I. Q. below 90,1 and similar findings have been made by other investigators in the same field. While results obtained with children may not be strictly comparable with those obtained with adults, there can be little question of their significance, especially in regard to such a matter as intellectual endowment. Further, the above findings have been more than corrob-orated by Kuhlmann' working in the reformatories of Minnesota where he found, in a total of 1962 cases, 78% below normal intelli-gence, a considerably greater figure than that-given by the above table. However, the delinquents studied by Kuhlmann, were, on the whole, considerably younger than those of this investigation which may account for the difference in percentages. Likewise in New York, Slawson7 found a total of 77o below normal intelligence in a series of 553 juvenile male delinquents, and 60% below normal in another series of 98 cases. While these cases are not wholly comparable to those of adults, the indications of a direct correlation between delin-quency and subnormal intelligence are exceedingly strong.
found 20% to 25% feebleminded;" Anderson, after his investigations in the problem, reached a conclusion that 27%6 to 29o of all prisoners are feebleminded;1 2
and the Wisconsin Psychiatric Field Service, in a total of over 8,000 examinations of the inmates of the various state penal and correctional institutions, has found an average of 27% of all offenders feebleminded, the percentages varying from 20% to 35% depending upon the particular institution concerned.'3 Also, various
wan-dering into forbidden paths all along the way, knowing no better and unable to know better.
CRIMINAL HISTORY
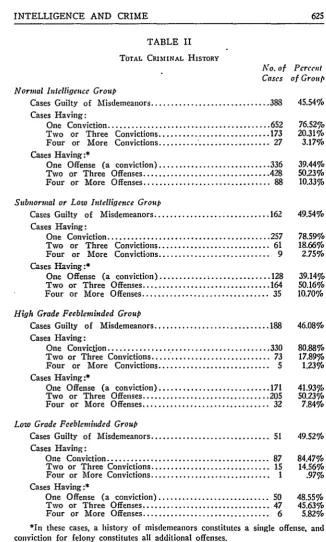
That there is a relationship between deficiency of intelligence and criminality has just been pointed out. Whether that relationship is direct or indirect, as would be shown by group comparisons, may be some-what indicated in the following table which shows the present extent of the criminal histories of the individuals of the various groups under examination :
Nor- Sub- High Low
mal normal Grade Grade
Present Crim- Intell. Intell. Moron Moron
inal History Group Group Group Group
Misdemeanors ... 45.54% 49.54% 46.08% 49.52%
One Conviction ... 76.52% 78.59% 80.88% 84.47% 2-3 Convictions ... 20.31% 18.66% 17.89% 14.56% 4 or 'More Convictions ... 3.17% 2.75% 1.23% .97%
Careful scrutiny of the above table suggests that, while the tend-ency toward crime does occur more often among the mentally deficient, the manifestation of that tendency in the individual does not vary in extent and frequency with the degree of intelligence possessed. In other words, while deficiency of intelligence allows for a greater number of individuals with criminalistic tendencies, the manifestation of those tendencies, in so far as the total number of offenses committed is con-cerned, varies in no degree from the manifestation of the criminalistic tendencies of the non-feebleminded. Indeed, the parity of the group per-centages for each item of the above table very strongly suggests an indirect relationship between criminality and ifntelligence, and indicates that the criminal tendency is a thing apart from the intellectual endow-ment and hence little influenced directly by the degree of intelligence possessed. However, the degree of intelligence may play a role in the particular form of specific manifestations of anti-social behavior. As a conclusion, justified by the above findings, it may be stated that the tendency to criminal behavior appears to be dependent upon fac-tors other than intelligence, and that deficiency of intelligence seems conducive to criminality only by virtue of allowing a. more frequer' occurrence of this tendency.
the inclusion of all offenses against the law, misdemeanors as well as felonies, percentages for recidivism are markedly increased. That the inclusion of misdemeanors in calculating recidivism is entirely justi-fiable in a study of the nature of criminalty is not to be doubted, since there is nothing inherent in an offense against the law which makes it either a felony or a misdemeanor.' Indeed, the mere circumstances of the situation often determine whether the particular manifestation of criminal tendencies constitutes a misdemeanor or a felony,2' and in the vast majority of cases, the standards of judgment are entirely arbitrary. Accordingly, the following table is given showing the percentages with the inclusion of all offenses:
Nor- Sub- High Low
mal normal Grade Grade
Total Present Intell. Intell. Moron Moron
Criminal History Group Group Group Group
One Offense ... 39.44% 39.14% 41.93% 48.55% 2-3 Offenses ... 50.23% 50.16% 50.23% 45.63% 4 or More Offenses ... 10.33% 10.70% 7.84% 5.82%
In the foregoing table, for each individual, a history of misde-meanors, whether one or many, is considered as a single offense, and actual convictions of felonies constitute all additional offenses. Since all individuals included in this study have at least one conviction, the first item of the above table shows the percentages of those having one conviction with no history of misdemeanors, while the other two items show the percentages based upon the inclusion of misdemeanors with felonies.
accord-ing him treatment designed for that class of offenders is at once apparent.2 8
Further, the very fact there is such a high percentage of repeaters shows the ineffectuality of our present penitentiary sys-tem both for correction and intimidation.29
Likewise deserving of comment is the marked extent of habitual criminality, which ranges from 6% for the low grade feebleminded criminals to 10% for those of normal intelligence, an average of 9.9% of all criminals. That one-tenth of criminals are habitual of-fenders emphasizes the seriousness of the problem constituted by such individuals alone, and renders at once apparent the need of some special socio-legal provisions for such unfortunate individuals. It is,
indeed, fortunate that the greater part of the crimes committed by habitual offenders are petty in nature.
A fourth consideration apparent from the above table is the ex-tent of recidivism among the low grade morons. As has been men-tioned above, 45% of the low grade morons have been in court and found guilty of crime two or three times. In addition, approxi-mately 6% are habitual offenders. Yet these low grade morons have not been recognized for what they are and placed in the pr6per institutions. Likewise, and to an even greater extent, the same holds true for the high grade morons, hence rendering the social wrong much greater. Thus is the inadequacy of the present judiciary system made apparent as well as the inadequacy of present social provision for such individuals, since there are provided as yet neither the means of recognizing such social unfits nor the institutions to receive them. Indeed, a total of 6% of adult criminals coming into the courts are low grade morons who may be cared for properly only by institu-tionalization. Yet that they are not recognized as such, but are treated in the same fashion as their fellows of unimpaired intellect constitutes, both a social tragedy and a severe criterion upon social enlightenment. Further, as shown above, 307 of all adult criminals are feebleminded and 56.7% of these are either recidivistic or habitual criminals. Hence they are obviously in need, at the very least, of constant and careful supervision from the standpoint of deficiency of intelligence alone, not to mention criminalistic tendencies, in order to conduct
LENGTH OF SENTENCE
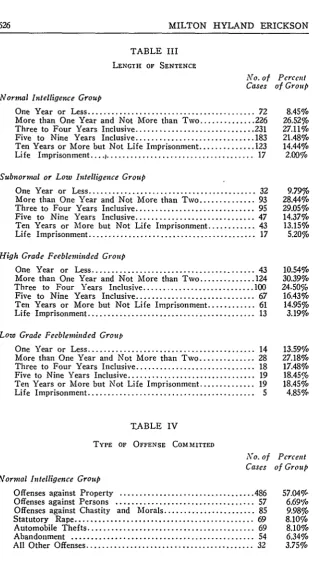
Serving to substantiate the points made above concerning re-cidivism and the inadequacy of present social and judicial provision in regard to the recidivistic mentally deficient are the findings in regard to the length of the sentence imposed upon the offender by the court
of trial, given in the following table:
Nor- Sub- High Low
Length mal normal Grade Grade
of Intell. Intell. Moron Moron
Sentence Group Group Group Group
1 year or less ... 8.45% 9.79% 10.540 13.59% 2 years or less ... 26.52% 28.44% 30.39% 27.18% 3 to 4 years ... 27.11% 29.05% 24.50% 17.48% 5 to 9 years ... 21.48% 14.37% 16.43% 18.45% 10 years or more ... 14.44% 13.15% 14.95% 18.45% Life imprisonment ... ... 2.00% 5.20% 3.19% 4.85%
offense is not a characteri.,tic of deficient intelligence. On the con-trary, intelligence apparently plays little part in determining the seri-ousness of the crime committed except in regard to the low grade moron, and there it probably is the lack of intelligence which con-stitutes the important factor. Indeed, the gravely dangerous criminal tendencies in the mentally deficient are even more serious since they have not the saving grace of intelligence wherewith to hope for a control, even partial, of their anti-social tendencies. The gravity of this is further emphasized by reference to the preceding table which shows-the failure of the courts to recognize the mentally deficient even upon the occasion of many court visits. All this stresses greatly the total inadequacy of the present court system, which falsely considers only the offense and not the offender, which is the empirical method of treating the symptoms without specifically considering the disease causing them. Thus the laws fail to protect society because they are concerned with the superficial criterion of the crime and not with the essential criterion of the nature of the delinquent"' and hence there can be no treatment of the criminal in direct accordance with his own particular needs. The latter is an easy matter only in regard to the mentally deficient where institutionalization or colonization might solve the problem most satisfactorily.
Illustrative to a still further degree of the point made above concerning the ineffectualness of the present penal system are the results of a comparison of the percentages for recidivism with those for long-term sentences. As may be seen above, although 56.7% of offenders are recidivistic or habitual offenders and hence incorrigible in the main, as has been mentioned above, only 16% to 23% are serving long term sentences. This fact, then, signifies that the greater per cent of recidivists are serving terms of more or less brevity. That little benefit to society may be expected from such terms is not to be doubted since sentences of three to five and even ten years are without effect upon recidivistic offenders and possess value only by virtue of segregating the offender for a while and thus sparing society a greater or less number of crimes.3' At best, such sentences, in so far as recidivists are concerned, constitute nothing more than a flimsy makeshift in dealing with the problem of repeated criminality. In-(ieed, the statistics of crime as well as the teachings of history con-firm the absolute inadequacy of the present system of punishments against crime.12
and completely militates against any possibility of regeneration or cor-rection. That penalties are established by statutes and are based wholly upon a consideration of the material act constitutes an actual social injury since society thereby derives a false sense of having adequately and securely provided against a danger. In reality, it has not, for the harm is merely postponed. Commitment to prison should be determined not by the nature of the offense but by the nature of the offender,3 3
and with a view toward the causes of the delinquency, the effect upon the individual, and the moral prognosis.3 4
Only in this way may adequate social provision be made for the warped, deficient, defective, and unregenerate enemies of the social order.
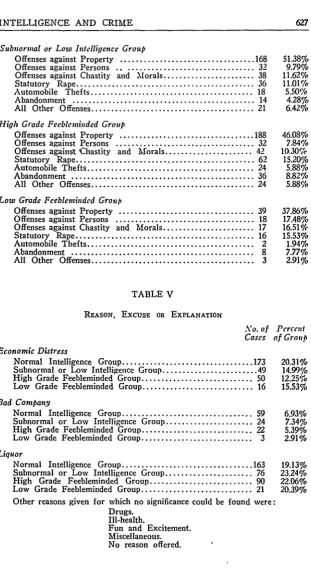
TYPE or CRIMES COMMITTED
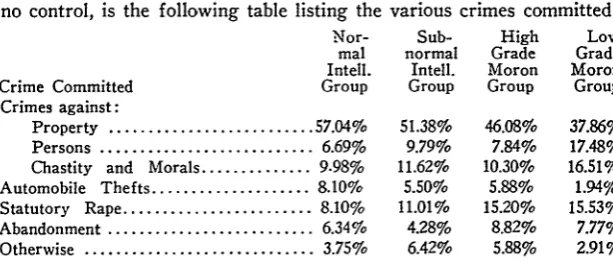
It is generally conceded that the particular crime committed, with few exceptions, is of no particular significance in the compre-hension of the problem of the criminal. Blanc has very rightly said that the essence of crime does not lie in the material act but in the psychical state of the agent and that there are no crimes but only criminals.35 Similarly, Aschaffenburg in his text-book on crime de-clares that criminals are not particular in their choice of crimes of psychologically equal value."! Indeed, crime is only a manifesta-tion of an unsocial or anti-social nature, in reality, merely a symptoT o-f disease or distortion of social relationships. The particular type of crime committed is, within the reasonable limits established by the fundamental nature and capacities of the individual, determined almost entirely by the circumstances serving to call forth the malefaction.
no control, is the following table listing the various crimes committed:
Nor- Sub- High Low
mal normal Grade Grade
Intell. Intell. Moron Moron
Crime Committed Group Group Group Group
Crimes against:
Property ... 57.04% 51.38% 46.08% 37.86%
Persons ... 6.69% 9.79% 7.84% 17.48%
Chastity and Morals ... 9.98% 11.62% 10.30% 16.51% Automobile Thefts ... 8.10% 5.50% 5.88% 1.94% Statutory Rape ... 8.10% 11.01% 15.20% 15.53% Abandonment ... 6.34% 4.28% 8.82% 7.77%
Otherwise ... 3.75% 6.42% 5.88% 2.91%
It is evident from the above table that the distribution of offenses is essentially the same for each of the various groups with only slight group differences. Thus, automobile thefts occur more fre-quently among those of normal intelligence, in all probability be-cause of the need of intelligence in conceiving and executing such a theft. The same interpretation probably holds true for the com-parative decrease in the incidence among low grade morons of crimes against property, since many such crimes require good intelligence and careful planning. On the other hand, abandonments occur to a greater extent among the mentally deficient than among those not feebleminded, because of the increased difficulty entailed by deficiency of intelligence in bearing family responsibilities, as had been noted in a previous investigationY.7
[image:14.431.55.362.110.241.2]SUBJECTIVE CAUSATIVE I-ACTORS UNDERLYING CRIME
Subjective causative factors underlying crime would be sought most naturally in the table of Reasons, Excuse, or Explanation offered by the offender. However, it must be recognized from the very out-set that the rationalized explanation of his crime given by the crim-inal upon inquiry, unless substantiated by case work, so desirable for accurate information, is most unreliable from a scientific point of view. Hence, conclusions drawn therefrom must be made cautiously. Nevertheless, the very remarkable agreement in percentages between the various groups so widely divergent on the scale of intelligence necessarily gives the explanations offered a significant, if not indis-putable, cast of reliability. Therefore, the various outstanding reasons given are presented for consideration and their possible significance suggested:
Nor- Sub- High Low
mal normal Grade Grade
Intell. Intell. Moron Moron
Reason Given Group Group Group Group
Economic Distress ... 20.31% 14.99% 12.25% 15.53% Bad Company ... 6.93% 7.34% 5.39% 2.91% Liquor ... 19.13% 23.24% 22.06% 20.39% Miscellaneous ... 41.54% 43.42% 48.05% 51.46% No Reason ... 12.09% 11.01% 12.25% 9.71%
Careful scrutiny of the above table shows no outstanding subjective causative factor peculiar to any one group. The feebleminded give the same reasons as those not feebleminded, and do so in approximately the same proportion of cases. Accordingly, the factors represented above must be considered as purely environmental in nature, or that the deficiency of intelligence in the feebleminded is of such nature as to prevent their true recognition of the impelling factors in their criminality. The latter is difficultly tenable as an explanation.
in the production of crime. Thus, while poverty may have a sub-jective value in impelling toward anti-social conduct, its force is not determined by individual peculiarities or deficiencies but by the en-vironmental force of circumstances.
That Bad Company constitutes a no more important subjective factor for the feebleminded than for those not mentally deficient as shown by the above table is presumably false, since the feebleminded are probably entirely incapable of properly appreciating the influence exercised over them by bad associates. The part played by evil com-panions is unquestionable, as individual cases frequently show, but the extent of that part is, in all probability, unmeasurable.
general it appears that the degree of intelligence possessed bears no relation to the tendency toward alcoholic indulgence in so far as sub-jective appreciation is concerned.
MILITARY SERVICE AND DELINQUENCY
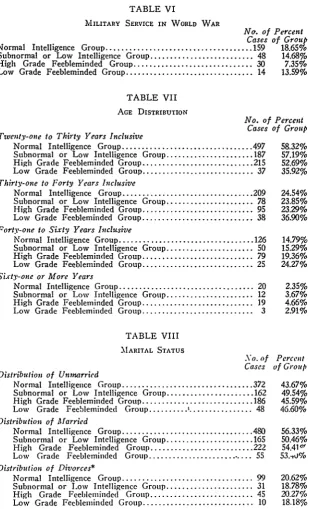
In the first part of his "Utopia," Sir Thomas More makes the earliest mention of the significance of war in the production of in-creased delinquency." This opinion he based upon observations fol-lowing the wars with France. Since his time, following every war, the same general observation has been made. After the Civil War, an extensive investigation into this question was made, and a marked increase in crime incidence following the war was noted.4 3 However, because of various errors of inclusion and selection of data, the re-liability of the results of the investigation is somewhat questionable.41 In this investigation, a history of participation in the World War seems to be of very considerable significance in regard to the crim-inogenic factors of delinquency, as may be gleaned from the follow-ing table:
Service in the World [Var
Normal Intelligence Group ... 18.65% Subnormal or Low Intelligence Group ... 14.68%o High Grade Moron Group ... 7.35%
Low Grade Moron Group ... 13.59% WEIGHTED AVERAGE FOR ALL GROUPS ... 14.76%
the general comparable population in 1920 serving in the World War. In the eight years since 1920, vast numbers of minors have reached their majority, thus markedly changing the constituency of the general population. Hence the proportion of the present comparable population having a history of service in the World War is unquestionably and decidedly less than the 12.1% given above, as contrasted to the 14.76% of the present criminal population. Bearing this in mind, it is at once evident that the percentage of ex-service men among offenders against the law is disproportionately high, a fact holding true, es-sentially, for each of the various groups, and to a similar degree, showing no striking relationship between degree of intelligence and history of military service. That approximately one out of every seven criminals has served in the World War as compared to one out of every ten or more of the general population suggests a direct re-lationship between that service and the anti-social behavior of the individual. ]'his same high percentage of ex-service men among the inmates of penal and correctional institutions has been previously noted by Lorenz4 who found a total of 25% for Wisconsin in 1923. Accordingly, the potency of military service as a factor in delinquency is not to be doubted, whether directly as consequent upon the dis-organization of personality due to military experiences, or indirectly either as consequent upon the difficulties of re-adjustment in civil life in the post-war period, or as a result of army-learned habits and morals carried over into civil life."' This disproportion of ex-service men among criminals may be appreciated to a still further d gree by calling to mind the very significant facts that the age group of 21 to 24 years inclusive has the greatest crime incidence as shown by the census report of 1904,4" and the census report of 1923,50 and that the median age of those committed to penal servitude for a term of one year or more, which would include the 1,690 cases of this study, is 28 years.' Indeed, criminality is an attribute of personality which tends to show itself early in life.2 These facts strongly emphasize the increased percentage of World War veterans inasmuch as they are. on the average, well beyond these ages. Accordingly, even for a long time afterwards, nearly ten years in this study, delinquency must be regarded as a due toll of war.
A'w DISTRIBUTION
Age Groupings
21-30 31-40 41-60 61-Normal Intelligence Group ... 58.32% 24.54% 14.79% 2.35%
Subnormal Intelligence Group ... 57.19% 23.85% 15.29% 3.67% High Grade Moron Group ... 52.69% 23.29% 19.36% 4.66% Low Grade Moron Group ... 35.92% 36.90% 24.27%- 2.91%
It is at once evident from the above table that there is a consider-able degree of relationship between the amount of intelligence possessed by the offenders and their age distribution. The greater proportion of younger offenders is to be found in the more highly intelligent groups, while the greater proportion of older offenders is to be found in the groups of lowest intelligence. As shown above, 64% of the low grade morons have passed the age of 30 years, as compared to 429(, of those of normal intelligence. Similarly, 49% of all feebleminded delinquents have passed that age as compared to 42% of those not feebleminded. Further, the per cent of mentally deficient delinquents included by the age period of 41 to 60 years is relatively 36% greater than the same percentage for those of more normal intelligence. This increase is even more marked in the case of the low grade feeble--minded, who show a relative increase ranging from 25% above the high grade morons to 67% above the normal intelligence group. Ap-parently then, delinquency among feebleminded adults occurs at a considerably later age on the average than among those not feeble-minded. An interpretation that may bc suggested for this is that the passing of the years renders the problems of life more and more strenu-ous for the mentally deficient individual because of his naturally de-creased powers of occupational adaptation and consequently dede-creased powers of social adaptation. Accordingly, he finds the burdens of life relatively more difficult than his fellow of more normal intelligence who is not compelled to confine his efforts to sustain life to the "draw-ing of water and the hew"draw-ing of wood." And in individuals of al-ready weak moral fiber, any added strain may e sufficient to break the slender threads holding the individual from wrong conduct. On the other hand, rather than a postponement of the age of incidence, it may be that the curve of crime incidence for the feebleminded. after reaching its highest point at the age group of 18 to 24 years, does not decline as does the curve for crime incidence in general.53
well-justified expectation of the feebleminded acquiring wisdom with one experience with penalization. On the contrary, it seems reasonable to expect that the tendency toward crime would remain unchanged and that the manifestations would continue- unaffected and undiminished in number.
MARRIAGE AND DELINQUENCY
Marriage is well-recognized as a stabilizing influence for the individual,54 and constitutes an actual moral force in the prevention of crime by providing happiness and stimulating worthy activity.55
Accordingly, a decreased incidence of marriage or an increased dis-ruption of marriage might reasonably be expected among criminals. In substantiation of this inference is the report of the Census Bureau which shows that the unmarried among criminals outnumber the mar-ried more than two times per 100,000 population of the age of 15 years or more."0 However, this is probably a distortion of the real truth since the criminal population with that age limit contains an exceed-ingly great proportion of juvenile and young adult offenders, as is shown by the census reports mentioned above on the age of crime in-cidence. This investigation, however, includes only individuals of marriageable age, and their marital status has been investigated for any significant manifestations. The findings are given in the follow-ing table together with similar findfollow-ings for the general comparable population of the United States :57
Nor- Sub- High Low U. S.
mal normal Grade Grade General
Intell. Intell. Moron Moron Comparable
Marital State Group Group Group Group Population*
Single ... 43.67% 49.54% 45.59% 46.60% 25.1% Married ... 56.33% 50.46% 54.41% 53.40% 68.3%
Separated ... 5.83% 4.84% 2.25% 3.63% 1
Divorced ... 20.62% 18.78% 20.27% 18.18% - 6.6%
Widowed ... 5.62% 12.72% 9.91% 7.27%J
*White race and 21 or more years of age.
As may be readily seen, there is no striking disproportion between the married and the unmarried of the criminal classes. The one state obtains essentially as frequently as the other, the married
con-stitution of the delinquent is of such a nature that he is frequently antagonistic toward the assumption and maintenance of marital duties and thus fails even to experience contact with any presumably stabiliz-ing influences of marriage. At any rate, marriage, together with any of the beneficial influences it may exert upon the individual, is of markedly less frequent occurrence among criminal classes than among the general population.
A second point concerning the decreased incidence of marriage among malefactors as shown above, is the similarity of the percentages for the various groups. There is no decrease in the extent of marriage concomitant with the decrease in the intellectual endowment as might be expected from the assumption that intelligence is a requisite for the assumption of matrimonial duties. Moreover, the equality of the percentages for the feebleminded groups and the non-feebleminded groups demonstrates that even deficient intelligence is infinitely far from constituting an effectual barrier to the marriage of the unfit-even those unfit who manifest the combined defects of criminality and of mental deficiency!
That slightly over 50% of criminals, including even the low grade morons, are married with the consequently increased possibilities of the propagation of the species is somewhat disheartening. How-ever, a more hopeful aspect of the matter is obtained by bringing into consideration similar statistics in regard to the marriage of col-lege graduates who undeniably represent the better stock of the land. Investigation in the alumni records of Harvard and Yale for the period of 1851 to 1890 shows the percentage of male graduates mar-ried rahging between 74% and 78%."' A similar investigation at
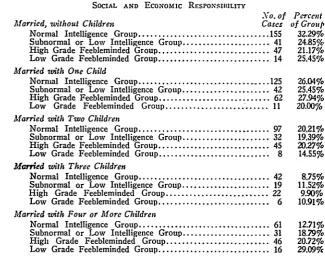
SOCIAL AND ECONOMIC RESPONSIBILITIES
Related in significance to the table above on Marital Status is the table on Social and Economic Responsibilities. This table includes data only for those individuals who are married or have been married at some time. Following is the table:
Nor- Sub- High Low
mal normal Grade Grade
(Married Indi- Intell. Intell. Moron Moron
viduals Only) Group Group Group Group
Without childi'en ... 32.29% 24.85% 21.17% 24.45% With children
With one child ... 26.04% 25A5% 27.94% 20.00% With two children ... 20.21% 19.39% 20.27% 14.55% With three children ... 8.75% 11.52% 9.90% 10.91%
With four or more (average of five) 12.71% 18.79% 20.72% 29.09% AVERAGE NUMBER OF
CHIL-DREN PER FAMILY ... 1.56 1.93 2.02 2.27
which gives the college bred man of Harvard the lead over even the low grade moron delinquent. Further, it has been estimated by Kehrer that the proportion of childless marriages for civilized countries ranges between 10% and 15%,"; which means that the ordinary middle-class citizen, taking the criminalistic and the college-bred classes as the extremes, bears the burden of restocking the population. This renders less alarming the belief of the overfecundity of the defective and de-ficient classes. Nevertheless, that over 50% of the criminal classes are married and tend, despite the prevalence of disrupted marriages, to reproduce themselves to the same extent as our leading intellectual classes constitutes an indisputable ill to society. Nor can there be any doubt of the gravity of this when it is realized that for the 328,820 adult male delinquents in prison67 there are only 508,714 men enrolled as students in universities, colleges, and professional gchools in the United States,"' a figure including minors as well as adults.
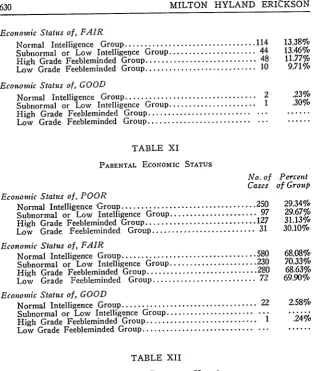
INDIVIDUAL ECONOMIC STATUS
Possibly the first author to discuss the relationship between poverty and criminality was Sir Thomas More in his "Utopia. ' 9 Since his time poverty has become very widely recognized as more or less of an inseparable companion to crime in general.7 0
The exact role played by poverty in its relation to crime is not known, but in all probability, its role is indirect since poverty generally means low status, with little to lose, little to respect, little to be proud of, and little to sustain efforts at improvement.71 In this study, poverty is strikingly
mani-fest in regard to the individuals of each of the groups of offenders. Following is the table showing the Economic Status of the Individual:
Poor Fair Good
Normal Intelligence Group ... 86.39% 13.38% 0.23% Subnormal or Low Intelligence Group ... 86.24% 13.46% 0.30% High Grade Moron Group ... 88.23% 11.77% ...
Low Grade Moron Group ... 90.29% 9.71% ...
percentage of hand-to-mouth existences would fall far short of that shown by criminals. This same opinion is concurred in by Gillin, Bonger, Garofalo, and Sutherland in their respective texts upon criminology, all of which tends to substantiate the reliability of the above table and the conclusions that may be drawn therefrom. Indeed, various investigations have shown that less than 50% of the general popula-tion is without property as compared to the 86% to 90%0 of criminals given in the table above.7 2 Thus it is evident that a very considerable stabilizing force is lacking in the lives of the criminal class, since the possession of property serves as a preventative to crime by creating a sense of responsibility and reliability and by awakening the acquisitive instinct.7 3 '
It is to be noted, strikingly enough, that there are no real differ-ences between the percentages for the various groups, and that the feebleminded show no greater incidence of poverty than those not mentally deficient. This similarity in percentages suggests very emphat-ically one of two things, and possibly both. The first of these is the environmental nature of poverty as a factor in delinquency. The second is the possibility of a fundamental deficiency in the character .of crim-inals which renders poverty a characteristic accompaniment in that it represents a level of existence to which they naturally descend.74
Both of these interpretations are further suggested by the fact that of the vast numbers of the poor, only a comparatively small part become delinquent, and further by the fact that virtue may thrive as richly in poverty-stricken homes as in those of wealth. Nevertheless, poverty itself does weaken the moral sentiments and thus it does pave the way for anti-social behavior.5 Moreover, it constitutes an obstacle to educa-tion, the want of which may prevent moral development." However, that poverty may have a direct relationship to delinquency must not be overlooked, as individual cases will show, a relationship dependent upon individual factors and made manifest by circumstances. Accordingly, while the conclusion that there is a relationship between crime and poverty may be drawn justly in view of the above evidence, this "con-clusion does not signify that the disappearance of poverty would herald the end of crime nor even modify the extent of occurrence of social dereliction to any considerable degree.7 7
PARENTAL ECONOM!IC STATUS
the parents from home, the lack of proper and needed discipline, resort to the streets and bad companions, denial of safe and simple pleasures, lack of recreation, and consequent social starvation-all of which forms a wide background of deprivation in youthful lives with no instruction or opportunity of satisfying normal safe desires."' In addition, it results in bad environments, and the deprivation of educational and cultural opportunities.7 9 Thus even those individuals capable of absorbing the
sound principles of law and morality are all too often not even exposed to such teachings. Instead, they are exposed to the undesirable teach-ings and evil precepts of the wretched environments in which they are compelled to live. And in such environments bad habits are learned by imitation," and( actual delinquency is often directly attributable to the deleterious influencc of the community, as has been shown by investiga-tions,"' and court records,"2- for criminality, whether in the family group or in the community, always breeds crime.83 The extent of parental poverty among criminal classes for this particular investigation is shown in the following table on the Parental Economic Status, the descriptive terms of which have the same significance as in the previ-ous table on Indi4dual Economic Status:
Percent Having Parents with Economic Status
of:-Poor Fair Good Normal Intelligence Group ... 29.34%o 68.08% 2.58% Subnormal or Low Intelligence Group ... 29.67%0 70.33% ... High Grade Moron Group ... 31.13%o 68.63% 0.24% Low Grade Moron Group ... 30.10% 69.90% ...
The above percentages do not, in all probability, reflect the exact truth since they are based on remote memory, and especially would this he so in regard to the feebleminded. However, comparison of the per-centages for the different groups leads to the conclusion that they may be considered as fairly reliable, especially the first two groups. The gen-eral trend of the figures is in accord with common judgment and the various group)s, so widely divergent in mental endowment, agree in gen-eral most consistently. Accordingly, the above table shows an obvi-ously great dearth of homes affording educational and cultural oppor-tunities and a distressfully large extent of hand-to-mouth existences in the parental home conditions. The influence of parental poverty in the production of anti-social behavior has been recognized repeatedly, an( the above findings are fully substantiated by those of Breckenridge and Abbott.4
develop-ment of the individual, and by the continuance of those conditions of life which allow for the further reproduction and development of such faultily constituted individuals.8" With homes of defective quality, the social harvest in a vast number of cases must necessarily be poor indeed!
DISRUPTED HOMES AND DELINQUENCY
Along with parental poverty, another factor, probably of much greater significance in the production of social derelicts, is the matter of broken or disrupted home conditions in the childhood and youth of the individual. The following table shows the status of the home previous to the eighteenth birthday of the offender:
Percent
of Homes
Disrupted, Per- by Death, cent Divorce, of Desertion, Homes or Sepa-Unbroken ration Normal Intelligence Group ... 63.97% 36.03% Subnormal or Low Intelligence Group ... 62.08% 37.92%
cases were individuals whose childhood home had been disrupted. 4 And Brace, in his early study of adult offenders, found that 55% of the adult criminals in New York penitentiaries came from disrupted homes. ' Thus, as a conclusion, it may be considered that the disruption of the home during the developmental period of the individual exerts an inimical influence upon normal social development, and may lead indi-rectly to the production of soil fertile for the growth of anti-social behavior. The reasons therefor are undoubtedly many and varied. Increased economic difficulties of life, deprivation of educational and developmental opportunities otherwise available, and the failure of the normal guiding influences of home training may each constitute serious handicaps to correct social development. In addition, disruption of the home frequently leads to child labor which causes delinquency by plac-ing the individual under responsibilities and in situations with which the ability to cope is lacking or undeveloped, or by rendering the individ-ual pecuniarily independent at an age when the need of guidance is greatest.G A still further consideration and one wholly unmeasurable
but worthy of serious consideration is the probable inheritance of various undesirable traits of personality which served to disrupt the home in many instances, and which render social adaptation more diffi-cult for the child of that home.
As will be noted from the table above, the percentage of disrupted homes for the low grade morons is considerably below that of the other groups, and is but little higher than Shideler's estimate for the general population. While the exact significance of this is difficult of determina-tion, abstract reasoning suggests either that the home of the low grade moron is devoid of influence in the development of the individual, or that the influence is of such a nature that little difference is made whether the home is disrupted or not. Or it may be that the mental deficiency of the low grade moron is so severe that criminalistic tend-encies are a matter of endowment rather than distortion of development as may be the case with those of better mental endowment. At any rate, disruption of the childhood home of the low grade moron appears to be without particularly marked effect upon the individual of that home.
PARENTAL NATIVITY
the state. This may be judged from the following table showing the
Parental Nativity:
One Parents Parents Native, One
Native-
Foreign-Born Born Born
Normal Intelligence Group ... 48.95% 38.96% 12.09% Subnormal or Low Intelligence Group ... 47.40% 40.98% 11.62% High Grade Moron Group ... 44.36% 44.86% 10.78% Low Grade Moron Group ... 22.33% 73.78% 3.89% United States Population in General9 7 (white race
only) ... 61.60% 31.00c 7.40%
The above table shows clearly that the foreign-born stock does pro-duce more than its due quota of our specified delinquents, especially so in regard to those of deficient intelligence. This is most marked regard-ing the low grade morons, where the foreign-born stock produces more than 235% of its due quota of offenders as determined by population ratios while the proportions for the other three groups ranges from
125% for the group of normal intelligence to 144% for the high grade feebleminded delinquents. This finding is substantiated by the findings of the Immigration Commission of 1910.98 and also by Laughlin in his report to the Congressional Committee.99 And similar findings have been reported by the Massachusetts Department of Corrections.'" In addi-tion, Laughlin also found that the second generation of foreign stock had an increased crime incidence over and above that of foreign stock in general, probably because that generation represents the transitional stage between the discarding of the customs of the old country and the adopting of those of the new. Undoubtedly this fact accounts for a proportion of the increased percentages in the above table. Obviously then, there is an undeniable danger in the admission of unselected for-eign stock, both from the aspect of their own undesirability and from the aspect of their reproduction of their kind. Hence, there is an unquestionable and appealing need of a closer and more intelligent supervision of immigration, with more ample provision for the means of so doing.
of the home in the proper rearing of the child, with defective homes resulting in social loss and injury.
INDIVIDUAL CITIZENSHIP
That the individual of foreign birth himself, if not of unselected and inherently faulty stock, is not an undesirable citizen, is evident from the following table showing the Individual Citizenship:
First Natur-Native Alien Papers alized Normal Intelligence Group ... 84.28% 4.58% 3.05% 8.09% Subnormal Intelligence Group ... 82.87% 6.73% 3.06% 7.34% High Grade Moron Group ... 78.92% 8.83% 5.88% 6.37% Low Grade Moron Group ... 52.43% 26.21% 10.68% 10.68% United States Populationlo3 (white race
only) ... 85.50% ... ...
Here it is evident that the foreign-born individual, unless of sub-normal or deficient intelligence, is responsible for no more than a fair
alter nor palliate one iota the fundamental fact of his undesirability. Particularly in this table is the need made evident of an intelligent and selective system of immigration with adequate and complete facilities for culling the undesirables who constitute both a detriment and a men-ace to the social and economic welfare of the whole country.
Another revelation of the above table is that 26.21% of the low grade feebleminded delinquents are aliens and that an average of 10.41o of all criminals are aliens and hence subject to deportation. Were the proper and adequate provisions in existence to meet this prob-lem fully, society would experience a most decided benefit, probably at no greater economic cost than that of their criminality. Nor does this conjecture take into consideration the item of the social cost of crim-inality, which, so often, is infinitely more than the economic.
A further matter of interest in the above table is the percentages of the feebleminded delinquents who have either applied for citizenship papers or who have been granted them. For the low grade feeble-minded this percentage amounts to 21.36% and the weighted average for both groups of mentally deficient totals 16.66%. That such a large proportion of the feebleminded, particularly so of the low grade men-tally deficient, have been granted citizenship constitutes an exceedingly severe criterion upon society. It evidences a failure to provide the judiciary with the ways and means of evaluating, understanding, and classifying the individuals who come before it. Until society makes the adequate provision essential to enable the courts to understand with what sort of human material they are dealing, there can be no good hope for the dispensation of justice nor the protection of citizenship. Especially is this so in criminal cases-indeed, in all. cases where the primary consideration is human nature itself!
SUMMARY OF CONCLUSIONS
The conclusions reached in this investigation and apparently justi-fied by the data at hand are as follows:
1. There appears to be a very definite relationship between crim-inality and deficiency of intelligence. This relationship becomes decid-edly more marked the greater the deficiency.
2. The feebleminded or mentally deficient constitute 30% of our specified delinquents, a proportion fifteen to sixty times greater than that of the general population.
4. The relationship between criminality and intelligence may be considered indirect since criminal tendencies are manifested to a similar degree and with a similar frequency by offenders regardless of
intellec-tual endowment.
5. Recidivism appears unrelated to the intellectual endowment since it occurs with essentially the same frequency among the mentally deficient offenders as among those of better intellectual capacities.
6. Recidivism, both for the feebleminded and those not feeble-minded, is responsible for 49% of crime, thereby indicating by its very extent the ineffectualness of the present penal system for both deter-rence and correction.
7. Habitual criminality appears to be accountable for 9.9% of offenders, and is more frequently found in offenders of normal or nearly
normal intelligence.
8. There appears to be none or slight relationship between the gravity of the offense committed and the degree of intelligence poss-essed since both high and low grade feebleminded commit crimes as serious as those of their more intellectually gifted fellows.
9. There appears to be a greater tendency on the part of the low grade feebleminded to commit a greater number of the more serious crimes as judged by the duration of the sentence administered.
10. The extent of feeblemindedness among recognized criminals and the marked recidivism among mentally deficient delinquents as well as among those not feebleminded indicates an utter inadequacy of the present social, judiciary, and penal systems to cope satisfactorily with the problems of criminality.
11. The feebleminded delinquents, despite the very questionable outlook of regeneration for them and regardless of their evident need of permanent segregation or supervision, receive the same sort of sentences and consequent treatment as their more normal brothers.
12. Only 16% to 23% of offenders, whether of normal, subnor-mal, or deficient intelligence, receive long term sentences despite the fact that an average of 56.7% are recidivistic or habitual offenders and hence difficult and doubtful in the main of regeneration.
14. Economic distress has a subjective value, approximately equally so for each level of intelligence, in the causation of crime, and as such a factor, it appears to be entirely environmental in nature.
15. The influence of bad company has no greater subjective value in the causation of delinquency for the feebleminded than for those of more superior intelligence.
16. Alcoholism is a definitely recognizable subjective factor in delinquency. It is recognized to a similar extent at each level of intelli-gence, and hence may be considered as environmental rather than indi-vidual in nature.
17. For each level of intelligence, a disproportionately high per-centage of ex-service men are included among delinquents, thereby indicting military service as a genetic force in crime.
18. There appears to be a considerable degree of relationship between the endowment of intelligence and the age distribution of offenders. The greater proportion of younger offenders is in the groups of greater intelligence, and the greater proportion of older offenders is in the groups of lesser intelligence.
19. There appears to be a somewhat decreased incidence of mar-riage among criminals in general, which is manifest to a similar extent for each level of intelligence.
20. The combined defects of subnormal or deficient intelligence and criminality do not constitute an effective barrier to the marriage of the unfit.
21. The extent of conjugal incompatibility among criminal classes, as evidenced by divorce and separation, is markedly increased above that of the general population. This holds true for each level of intelligence, but least so for the lowest level.
22. The disruption of marital life may constitute a causative fac-tor in the production of delinquency, or it may be coincidental evidence of additional inherent constitutional defects in the nature of the criminal.
23. The criminal classes tend to reproduce themselves to almost the same extent as do the college-bred classes, the greater fecundity of the criminal classes being shown by the groups of lowest intelligence. 24. Individual poverty appears to be a very definite factor in the causation of delinquency. As such a factor, it seems to be entirely environmental in nature since it is equally distributed for the various
levels of intelligence.
equal degree for each level of intelligence. And as a result of this parental poverty, there is a very great dearth of homes affording edu-cational and cultural opportunities.
26. A significantly large percentage of criminals come from dis-rupted childhood homes, thereby suggesting that such homes are inimical to correct social development. With a decrease in intelligence there is a concomitant decrease in the percentage, with the low grade morons having the fewest number of disrupted childhood homes, thereby sug-gesting a lesser value for their type of homes.
27. Individuals of foreign parentage appear to. be responsible for an increased quota of crime as determined by population ratios. This is increasingly manifest as the endowment of intelligence decreases, the low grade moron of foreign parentage being responsible for more than 235% of the population quota of crime.
28. There appears to be an increased proportion of mixed percent-age, one native-born, one foreign-born, among criminal classes thereby suggesting the probability of an unfortunate social result of such a home.
29. The foreign-born individual not of subnormal or deficient intelligence appears to be responsible for no more than a fair share of delinquency as determined by population ratios.
30. The foreign-born individual of subnormal or deficient intelli-gence appears to be responsible for an overwhelmingly increased inci-dence of crime as determined by population ratios. This increased incidence reaches the proportion of 327% of the fair quota for the low grade morons.
31. Of the low grade feebleminded offenders, 26% are aliens, and an average of 10% of all criminals are non-citizens.
32. Of the foreign-born feebleminded delinquents, a proportion equalling 16% of the entire number of mentally deficient have either applied for citizenship papers or have been granted them. This signifies a failure of the social provision of proper judicial machinery for the best handling of human material, and the protection of citizenship.
APPENDIX OF TABLES TABLE I
GENERAL DISTRIBUTION ACCORDING TO INTELLIGENCE Na. of
TABLE II
TOTAL CRIMINAL HISTORY
No. of Percent Cases of Group Normal Intelligence Group
Cases Guilty of Misdemeanors ... 388 45.54% Cases Having:
One Conviction ... 652 76.52% Two or Three Convictions ... 173 20.31% Four or More Convictions ... ... 27 3.17% Cases Having:*
One Offense (a conviction) ... 336 39.44% Two or Three Offenses ... 428 50.23% Four or More Offenses ... 88 10.33%
Subnormal or Low Intelligence Group
Cases Guilty of Misdemeanors ... 162 49.54% Cases Having:
One Conviction ... 257 78.59% Two or Three Convictions ... 61 18.66% Four or More Convictions ... 9 2.75% Cases Having :*
One Offense (a conviction) ... 128 39.14% Two or Three Offenses ... 164 50,16% Four or More Offenses ... 35 10.70%
High Grade Feebleminded Group
Cases Guilty of Misdemeanors ... 188 46.08% Cases Having:
One Convic.jon ... 330 80.88% Two or Three Convictions ... 73 17.89% Four or More Convictions ... 5 1.23% Cases Having:*
One Offense (a conviction) ... 171 41.93% Two or Three Offenses ... 205 50.23% Four or More Offenses ... 32 7.84%
Low Grade Feebleminded Group
Cases Guilty of Misdemeanors ... 51 49.52% Cases Having:
One Conviction ... 87 84.47% Two or Three Convictions ... 15 14.56% Four or More Convictions ... 1 .97% Cases Having:*
[image:35.431.53.380.69.612.2]TABLE III
LENGTH OF SENTENCE
No. of Percent Cases of Group Normal Intelligence Group
One Year or Less ... 72 8.45% More than One Year and Not More than Two ... 226 26.52% Three to Four Years Inclusive ... 231 27.11% Five to Nine Years Inclusive ... 183 21.48% Ten Years or More but Not Life Imprisonment ... 123 14.44% Life Imprisonment .... ) ... 17 2.00%
Subnornil or Low Intelligence Group
One Year or Less ... 32 9.79% More than One Year and Not More than Two ... 93 28.44% Three to Four Years Inclusive ... 95 29.05% Five to Nine Years Inclusive ... 47 14.37% Ten Years or More but Not Life Imprisonment ... 43 13.15% Life Imprisonment ... 17 5.20%
High Grade Feebleminded Group
One Year or Less ... 43 10.54% More than One Year and Not More than Two ... 124 30.39% Three to Four Years Inclusive ... 100 24.50% Five to Nine Years Inclusive ... 67 16.43% Ten Years or More but Not Life Imprisonment ... 61 14.95% Life Imprisonment ... 13 3.19%
Low Grade Feebleminded Group
One Year or Less ... 14 13.59% More than One Year and Not More than Two ... 28 27.18% Three to Four Years Inclusive ... 18 17.48% Five to Nine Years Inclusive ... 19 18.45% Ten Years or More but Not Life Imprisonment ... 19 18.45% Life Imprisonment ... 5 4.85%
TABLE IV
TYPE OF OFFENSE COMMITTED
No. of Percent Cases of Group Normal Intelligence Group
[image:36.431.57.370.65.631.2]Subnormal or Low Intelligence Group
Offenses against Property ... 168 51.38% Offenses against Persons ... 32 9.79%
Offenses against Chastity and Morals... 38 11.62%
Statutory Rape ... 36 11.01% Automobile Thefts ... 18 5.50% Abandonment ... 14 4.28% All Other Offenses ... 21 6.42%
High Grade Feebleminded Group
Offenses against Property ... 188 46.08% Offenses against Persons ... 32 7.84% Offenses against Chastity and Morals ... 42 10.30% Statutory Rape ... 62 15.20% Automobile Thefts ... 24 5.88% Abandonment ... 36 8.82% All Other Offenses ... 24 5.88%
Low Grade Feebleminded Group
Offenses against Property ... 39 37.86% Offenses against Persons ... 18 17.48% Offenses against Chastity and Morals ... 17 16.510 Statutory Rape ... 16 15.53% Automobile Thefts ... 2 1.94% Abandonment ... 8 7.77% All Other Offenses ... 3 2.91%
TABLE V
REASON, EXCUSE OR EXPLANATION
No. of Percent Cases of Group Economic Distress
Normal Intelligence Group ... 173 20.31% Subnormal or Low Intelligence Group ... 49 14.99% High Grade Feebleminded Group ... 50 12.25%
Low Grade Feebleminded Group ... 16 15.53%
Bad Company
Normal Intelligence Group ... 59 6.93% Subnormal or Low Intelligence Group ... 24 7.34%
High Grade Feebleminded Group ... 22 5.39% Low Grade Feebleminded Group ... .3 2.91%
Liquor
Normal Intelligence Group ... 163 19.13% Subnormal or Low Intelligence Group ... 76 23.24% High Grade Feebleminded Group ... 90 22.06% Low Grade Feebleminded Group ... 21 20.39% Other reasons given for which no significance could be found were:
Drugs. Ill-health.
[image:37.431.69.381.63.649.2]