T E C H N I C A L N O T E S
Open Access
Impact of motion correction on
reproducibility and spatial variability of
quantitative myocardial T
2
mapping
Sébastien Roujol
1, Tamer A. Basha
1,2, Sebastian Weingärtner
1,3, Mehmet Akçakaya
1, Sophie Berg
1,
Warren J. Manning
1,4and Reza Nezafat
1*Abstract
Background:To evaluate and quantify the impact of a novel image-based motion correction technique in myocardial T2mapping in terms of measurement reproducibility and spatial variability.
Methods:Twelve healthy adult subjects were imaged using breath-hold (BH), free breathing (FB), and free breathing with respiratory navigator gating (FB + NAV) myocardial T2mapping sequences. Fifty patients referred for clinical CMR
were imaged using the FB + NAV sequence. All sequences used a T2prepared (T2prep) steady-state free precession
acquisition. In-plane myocardial motion was corrected using an adaptive registration of varying contrast-weighted images for improved tissue characterization (ARCTIC). DICE similarity coefficient (DSC) and myocardial boundary errors (MBE) were measured to quantify the motion estimation accuracy in healthy subjects. T2mapping reproducibility and
spatial variability were evaluated in healthy subjects using 5 repetitions of the FB + NAV sequence with either 4 or 20 T2prep echo times (TE). Subjective T2map quality was assessed in patients by an experienced reader using a 4-point
scale (1-non diagnostic, 4-excellent).
Results:ARCTIC led to increased DSC in BH data (0.85 ± 0.08 vs. 0.90 ± 0.02,p= 0.007), FB data (0.78 ± 0.13 vs. 0.90 ± 0.21,p< 0.001), and FB + NAV data (0.86 ± 0.05 vs. 0.90 ± 0.02,p= 0.002), and reduced MBE in BH data (0.90 ± 0.40 vs. 0.64 ± 0.19 mm,p= 0.005), FB data (1.21 ± 0.65 vs. 0.63 ± 0.10 mm,p< 0.001), and FB + NAV data (0.81 ± 0.21 vs. 0.63 ± 0.08 mm,p< 0.001). Improved reproducibility (4TE: 5.3 ± 2.5 ms vs. 4.0 ± 1.5 ms,p= 0.016; 20TE: 3.9 ± 2.3 ms vs. 2.2 ± 0.5 ms,p= 0.002), reduced spatial variability (4TE: 12.8 ± 3.5 ms vs. 10.3 ± 2.5 ms, p < 0.001; 20TE: 9.7 ± 3.5 ms vs. 7.5 ± 1.4 ms) and improved subjective score of T2map quality (3.43 ± 0.79 vs. 3.69 ± 0.55,p< 0.001) were obtained using
ARCTIC.
Conclusions:The ARCTIC technique substantially reduces spatial mis-alignment among T2-weighted images and
improves the reproducibility and spatial variability of in-vivo T2mapping.
Keywords:Motion correction, Image registration, Quantitative myocardial tissue characterization, Myocardial T2
mapping
* Correspondence:[email protected]
1
Department of Medicine (Cardiovascular Division), Beth Israel Deaconess Medical Center, 330 Brookline Ave, Boston, MA 02215, USA
Full list of author information is available at the end of the article
Background
The T2 relaxation time is dependent on the amount of
free water [1] and can be exploited as a potential marker of inflammation and edema [2–7]. In cardiac MR (CMR), T2 changes are generally assessed using a dark
blood T2-weighted acquisition [8]. Elevated signal
inten-sity in T2-weighted images have been reported in presence
of several cardiomyopathies such as myocarditis [2, 3], Tako-Tsubo [4], and acute myocardial infarction [5–7]. However, this technique only provides qualitative mea-surements and image interpretation can be limited by sev-eral factors including regional signal variations induced by phased array coil, elevated signal induced by sub-endocar-dial stagnant blood, and signal loss caused by through-plane motion [9, 10].
Quantitative myocardial T2mapping [11, 12] is an
al-ternative technique, which shows promise for reducing uncertainties in interpretations of dark blood T2
-weighted images. In this technique, several T2-weighted
images are acquired, each with a different T2 contrast.
The signal intensity obtained from the T2-weighted
im-ages is then fit to a physical model of T2signal decay on
a per-pixel basis, leading to the creation of a T2 map.
The acquisition of each T2-weighted image was initially
performed using either spin echo/fast spin echo acquisi-tions [11–14] with varying echo times (TE) which results in very long scan time. Recently, T2-prepared (T2prep)
[15] steady-state free precession (SSFP) acquisitions have been proposed and provide higher imaging efficiency [16]. These sequences can be acquired within a breath-hold [16, 17] or under free breathing conditions with re-spiratory motion correction techniques [16, 18, 19].
Despite the promise of this technique, its in-vivo repro-ducibility and precision have not been fully characterized. These two factors play a major role for clinical acceptance of any quantitative myocardial tissue characterization technique [20, 21]. The presence of motion among T2
-weighted images is one of the main challenges in T2
map-ping and is expected to have important impact on the technique precision and reproducibility.
Breath-hold acquisitions can be used to reduce the im-pact of respiratory motion. However, some motion can still be detected in 40-60 % of patients due to their lim-ited breath-holding capabilities, as reported by several T1 mapping studies using breath-held acquisitions of
~11-17 heart beats [22–25]. The breath-hold approach imposes severe time limitations on the number of ac-quired T2-weighted images (typically ~3-4) since a rest
time of ~4-6 heart beats is required between each acqui-sition to allow for full longitudinal magnetization recov-ery. Therefore, the use of a free breathing acquisition is attractive as it enables the acquisition of a larger number of T2-weighted images which may be beneficial to
im-prove precision and reproducibility. On the other hand,
free breathing acquisitions require the use of respiratory navigators to account for through plane motion and image registration algorithms to correct for residual in-plane motion [18].
We recently developed a technique for Adaptive Regis-tration of varying Contrast-weighted images for im-proved TIssue Characterization (ARCTIC) which we have evaluated for myocardial T1mapping [23]. In this
study, we sought to investigate the performance of ARC-TIC for T2mapping and its impact on in-vivo
reprodu-cibility and spatial variability of myocardial T2estimates.
Methods
All subjects were scanned using a 1.5 T Philips Achieva (Philips Healthcare, Best, The Netherlands) scanner with a 32-channel cardiac phased array receiver coil. This study was health insurance portability and accountability act (HIPAA) compliant and the imaging protocol was approved by our institutional review board (Committee on Clinical Investigations (CCI)) at the Beth Israel Deaconess Medical Center. Written informed consent was obtained from each participant.
T2mapping acquisition scheme
T2mapping was performed using our recently reported
T2 mapping sequence [26] in which multiple T2
-weighted images are acquired using an electrocardio-gram (ECG)-triggered T2prep steady-state free
preces-sion (SSFP) acquisition with different T2prep echo times
(TET2P). A rest cycle of 6 s was used between the
acqui-sitions of two successive T2-weighted images to ensure
full re-growth of the longitudinal magnetization. The TET2P= 0 image was acquired using 90° pulse followed
immediately by a -90° pulse and a crusher gradient to ensure consistency with all other images in term of lon-gitudinal signal reduction induced by imperfect 90° and -90° flip angles used in the T2prep. Finally, to model
the signal re-growth induced by the SSFP imaging pulses, an infinitely long T2prep echo time (TET2P=∞)
was simulated by acquiring an image immediately after a saturation pulse. In this study, this sequence has been evaluated with 4 T2prep echo times (T2P4TE: 0, 25, 50,
∞) and 20 T2prep echo times (T2P20TE: 0, 25, 30, 35,
…, 95, 100, ∞,∞, ∞). For free breathing acquisitions, a respiratory navigator positioned immediately prior to the T2prep was used for end expiratory gating (window
size = 5 mm). No T2prep or imaging pulses were
ap-plied if the navigator signal was outside the gating win-dow to enable the acquisition of undisturbed signal in the next heartbeat.
In-plane motion correction
approach, all images are registered individually to a com-mon reference image, which was chosen as the first image of the series (TET2P= 0). The motion was then
es-timated in a two-step process. Affine motion descriptors are first estimated over a region of interest surrounding the heart. This global transformation is then provided as input of a more sophisticated local non-rigid motion es-timation step using an extended formulation of the op-tical flow problem which enables the simultaneous estimation of both motion field and intensity variations on a per-pixel basis [27]. An additional term is used to constrain the motion estimates based on prior automatic tracking of specific feature points in the images [28–30]. In this algorithm, both motion field and intensity vari-ation map are solved using an iterative scheme. A multi-resolution approach was used for the local non-rigid motion estimation step where the optical flow is initially estimated from first sub-resolution images and then re-fined using the full resolution images [31]. For each resolution level, the iterative scheme used 100 iterations and was repeated fifty times. These parameters were em-pirically optimized in this study. Since optical flow algo-rithms are well suitable for parallelization on graphic processing unit (GPU) [32–34], a GPU implementation of the method was used based on the compute unified device architecture (CUDA). More details about the al-gorithm can be found in [23].
T2map reconstruction
T2maps were reconstructed offline using a 3-parameter
curve fitting model.
S A;ð B;T2;TnÞ ¼Aetn=T2þB: ð1Þ
where tn is the T2prep echo time of nthT2-weighted
image, and A, B, and T2are the model parameters. A, B,
and T2are estimated independently for each pixel using
a Levenberg-Marquard optimizer with the online library provided in [35].
In-vivo study in healthy subjects
Twelve healthy adult subjects (32 ± 16 years, 6 male) without any history of cardiovascular disease underwent CMR examination. Each subject was imaged using eight T2mapping sequences in the following order:
1. Breath-held T2P4TE
2. Free breathing T2P4TEwithoutrespiratory navigator 3. Free breathing T2P4TEwithrespiratory navigator 4. Free breathing T2P20TEwithrespiratory navigator
(5 repetitions).
All sequences were acquired in the short axis view using a single-shot ECG-triggered acquisition with SSFP
imaging readout and the following parameters: field of view = 240 × 240 mm2, in-plane resolution = 2.5 × 2.5 mm2, slice thickness = 8 mm, TR/TE = 2.7 ms/ 1.35 ms, flip angle = 85°, 10 linear ramp-up pulses, SENSE rate = 2, acquisition window = 138 ms, number of phase encoding lines = 51, linear k-space ordering. All T2 scans were acquired in the same short axis
orienta-tion at the mid-diastolic cardiac phase using one single mid-ventricular slice.
Accuracy of motion correction was evaluated in the first three scans (T2p4TE) by quantifying the motion be-tween the T2-weighted images without (uncorrected)
and with in-plane motion correction using ARCTIC (motion corrected). Endocardial and epicardial contours were manually drawn in all T2-weighted images of all T2
mapping scans. The two contours were used to create a binary representation of the myocardium for each T2
-weighted image. The DICE similarity coefficient (DSC) [36] was then calculated between the myocardial binary mask of the reference image (Mref) and the myocardial
binary mask of each kthT2-weighted image (Mk) as follows:
DSC¼ 2area Mð ref∩MkÞ
area Mð refÞ þarea Mð kÞ ð
2Þ
The myocardial boundary error (MBE), which provides a local alignment measure is also reported. MBE was measured as the average distance between the myocardial boundary of each T2-weighted image (boundary of Mk)
and the myocardial boundary of the reference image (boundary ofMref) as follows:
MBE Mk; Mref¼N1XN i¼1
Pi MK−P
Closest−i Mref
2 ð3Þ
Where PiMKis the ith point along the boundary of Mk,
PClosest−i
Mref is the closest point ofP
i
MK located on the boundary ofMref. Since TET2P=∞images are very low signal-to-noise
ratio (SNR) images, which makes the detection of the myo-cardial borders very difficult, no DSC/MBE were measured in those images. The statistical significant difference be-tween DSCs (and MBEs) obtained with and without motion correction was evaluated using Wilcoxon signed rank tests. Statistical significance was considered atp< 0.05.
The impact of in-plane motion correction on the re-producibility and spatial variability of T2 mapping was
evaluated using the five T2P20TE scans. For each scan,
T2 maps were reconstructed without (uncorrected) and
with prior in-plane motion correction using ARCTIC (motion corrected). The endocardial and epicardial border of the myocardium and the insertion point were manually drawn on each T2 map. A six myocardial
4:inferior, 5:inferolateral, 6:anterolateral). Segment-based analysis of reproducibility and spatial variability of T2
estimates was then performed. Spatial variability was defined as the standard deviation of T2 estimates over
a given segment. Reproducibility was defined as the standard deviation over the 5 scans of the spatial average T2 values in one given segment. Both
reprodu-cibility and spatial variability are reported in average over all segments for each subject, and in average over all subjects for each segment. To investigate the mo-tion influence in T2mapping sequences using a limited
number of T2prep echo times, this overall analysis was
repeated using a subset of the T2-weighted images from
each scan (4 T2prep echo times of 0, 25, 50, ∞). The
statistical significant difference between uncorrected and ARCTIC motion corrected T2reproducibility (and
spatial variability) measured for each subject (in aver-age over all myocardial segments) was evaluated using Wilcoxon signed rank tests.
In-vivo study in patients
Fifty patients referred for clinical CMR (56 ± 14 y, 29 male) were imaged using the free breathing T2P4TE T2
mapping sequence with respiratory navigator. All se-quences were acquired in the short axis view using a sin-gle-shot ECG-triggered acquisition with SSFP imaging readout and the following parameters: field of view = 360 × 360 mm2, in-plane resolution = 2 × 2 mm2, slice thickness = 8 mm, slice number = 3, TR/TE = 2.9 ms/ 1.45 ms, flip angle = 85°, 10 linear ramp-up pulses, SENSE rate = 2, acquisition window = 270 ms, number of phase encoding lines = 93, linear k-space ordering. T2
maps were reconstructed without and with ARCTIC motion correction.
A subjective qualitative analysis was performed by an experienced cardiologist. The initial motion level in un-corrected data was assessed for each slice as “no mo-tion”, “small motion”, or “large motion” by visual inspection of all uncorrected T2-weighted images.
Sub-jective assessment of uncorrected and motion correction T2 maps (150 T2 maps) followed. Each pair of
uncor-rected and motion correction T2maps were shown
sim-ultaneously to the reader side by side in a random order. The reader was blinded to the reconstruction approach (uncorrected vs. motion corrected). Each map was assessed in term of overall quality (1-non diagnostic/large artifacts/ no confidence in interpreting T2values in more than half
of the myocardial segments, 2-fair/moderate artifacts/con-fidence in interpreting T2values in more than half of the
myocardial segments, 3-good/small motion artifacts/no confidence in interpreting T2values in at most one
myo-cardial segment, 4-excellent/no motion artifact/confidence in interpreting T2values in all myocardial segments).
Fur-thermore, for each pair of T2maps, the reader was asked
to evaluate if any of the two T2map had “1-inferior”,“
2-similar”, or“3-superior”quality. Wilcoxon signed rank test was used to test the null hypothesis that the difference of overall T2 map quality scores between uncorrected and
motion corrected T2maps was zero. Statistical significance
was considered at p < 0.05.
Results
All scans were successful. The nominal scan time (assuming 100% gating efficiency) corresponded to 13 heart beats for the T2P4TE sequence and to 99 heart
beats for the T2P20TE sequence. The employed ARCTIC
motion correction and reconstruction of one T2 map
with 20 T2prep echo times was 20s.
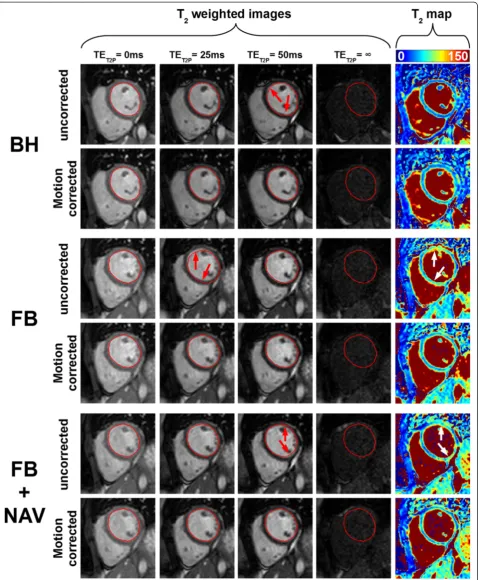
Figure 1 shows an example of the remaining in-plane motion between T2-weighted images acquired in one
healthy subject using the T2P4TE sequence under
breath-hold, free breathing, and free breathing with re-spiratory navigator gating. Motion artifacts can be ob-served in the reconstructed T2maps (see white arrows).
In-plane motion correction improves the spatial align-ment of T2-weighted images and results in visually
im-proved T2map quality (Figure 1).
Figure 2 shows quantitative metrics of motion accur-acy (DSC and MBE) obtained in healthy subjects using the three aforementioned acquisition sequences. In-creased DSC and reduced MBE were observed in each of the three acquisition sequences. In the remaining part of this paragraph, DSC and MBE are reported as (uncor-rected data vs. motion cor(uncor-rected data using ARCTIC). On average for all subjects, the DSC increased in breath-hold data (0.85 ± 0.08 vs. 0.90 ± 0.02, p= 0.007), free breathing data (0.78 ± 0.13 vs. 0.90 ± 0.21,p< 0.001), and free breathing data with respiratory navigator gating (0.86 ± 0.05 vs. 0.90 ± 0.02, p= 0.002). The MBE de-creased in breath-hold data (0.90 ± 0.40 vs. 0.64 ± 0.19 mm, p= 0.005), free breathing data (1.21 ± 0.65 vs. 0.63 ± 0.10 mm, p< 0.001), and free breathing data with respiratory navigator gating (0.81 ± 0.21 vs. 0.63 ± 0.08 mm,p< 0.001).
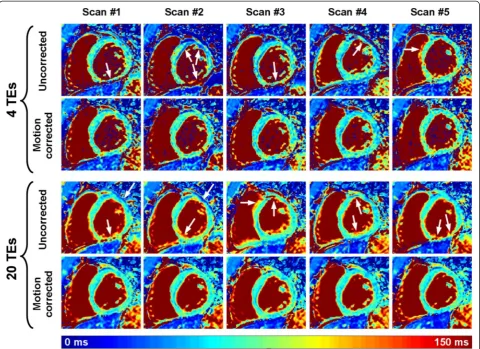
Figure 3 shows an example of multiple T2 maps
ob-tained in one healthy subject using the T2P20TE
se-quence acquired under free breathing conditions with respiratory navigator gating. T2 maps are shown when
reconstructed from only 4 T2prep echo times and from
all 20 T2prep echo times. The level of artifacts in
uncor-rected T2maps appears higher than in motion corrected
T2maps (see white arrows). As expected, motion artifact
patterns have high spatial variability in uncorrected T2
maps. Furthermore, the spatial variability of the myocar-dial T2estimates appears well reduced when using all 20
T2prep echo times compared to only 4 T2prep echo
Fig. 1T2scans from one subject acquired using the T2P4TE sequence under breath-hold (BH), free breathing (FB), and free breathing with
respiratory navigator gating (FB + NAV). Data are shown without (uncorrected) and with (motion corrected) in-plane motion correction. The endocardial contour of the LV myocardium, drawn on the reference image (1stimage) of each scan, is reported in all subsequent T
2-weighted
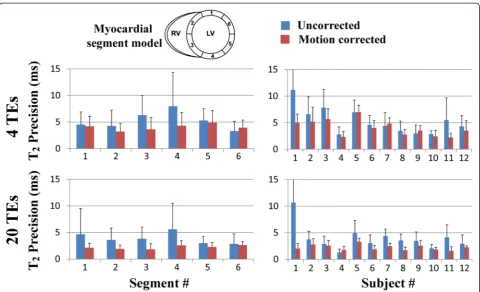
[image:5.595.60.540.88.669.2]Figures 4 and 5 summarize the reproducibility and spatial variability of T2 measurements obtained in
healthy subjects using the T2P20TE sequence. Results
are shown for uncorrected and motion corrected T2
maps reconstructed using either 4 T2prep echo times or
20 T2prep echo times. Reproducibility and spatial
vari-ability are reported as uncorrected T2maps vs. motion
corrected T2maps using ARCTIC. Improved
reproduci-bility was observed over all subjects and myocardial seg-ments in T2 maps reconstructed from 4 T2prep echo
times (5.3 ± 2.5 ms vs. 4.0 ± 1.5 ms, p= 0.016) and 20 T2prep echo times (3.9 ± 2.3 ms vs. 2.2 ± 0.5 ms, p=
0.002). Similarly, reduced spatial variability was observed over all subjects and myocardial segments in T2 maps
reconstructed from 4 T2prep echo times (12.8 ± 3.5 ms
vs. 10.3 ± 2.5 ms, p< 0.001) and 20 T2prep echo times
(9.7 ± 3.5 ms vs. 7.5 ± 1.4 ms,p= 0.005).
As expected, T2 maps reconstructed using 20 T2prep
echo times had better reproducibility than those recon-structed using only 4 T2prep echo times in both
uncor-rected data (3.9 ± 2.3 ms vs. 5.3 ± 2.5 ms, respectively,p= 0.007) and motion corrected (2.2 ± 0.5 ms vs. 4.0 ± 1.5 ms, respectively,p< 0.001). The spatial variability of myocardial T2 estimates reconstructed using 20 T2prep echo times
was also lower than the one obtained with 4 T2prep echo
times in both uncorrected data (9.7 ± 3.5 ms vs. 12.8 ±
3.5 ms, respectively,p< 0.001) and motion corrected data (7.5 ± 1.4 ms vs. 10.3 ± 2.5 ms, respectively,p< 0.001).
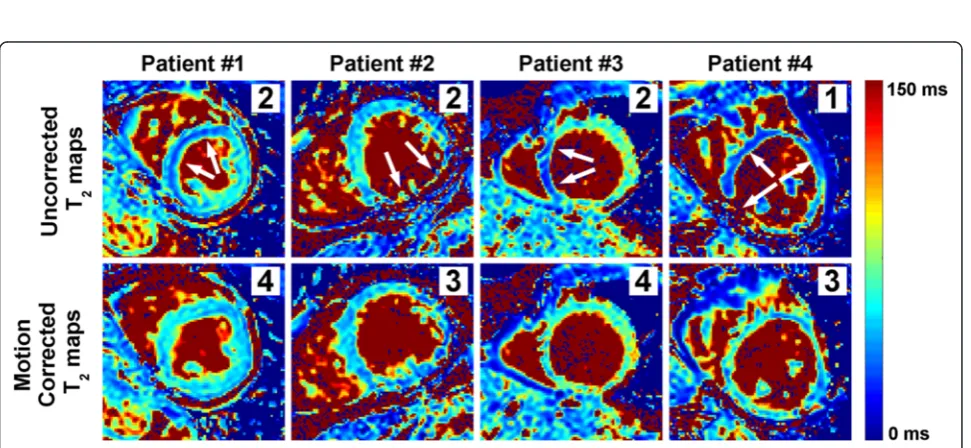
Figure 6 shows example uncorrected and ARCTIC motion corrected T2 maps obtained in four patients.
Large regional variations and artifacts can be observed in uncorrected T2 maps (see white arrows). The
pro-posed ARCTIC motion correction substantially im-proved the T2map quality in all 4 patients.
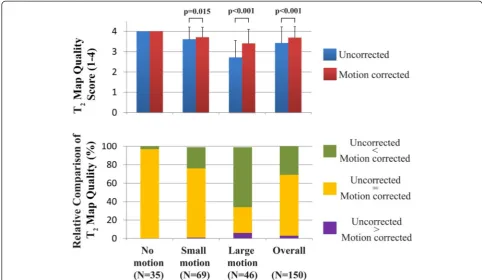
Figure 7 shows the subjective assessment of T2
map quality obtained in 50 patients. Overall (N= 150 T2 maps), ARCTIC motion corrected T2 maps
had higher quality score than uncorrected T2 maps
(3.69 ± 0.55 vs. 3.43 ± 0.79, p< 0.001). In the relative comparison of T2 map quality, uncorrected T2 maps
has superior, similar, and inferior quality than ARC-TIC motion corrected T2 maps in 4 maps (3 %), 99
maps (66 %), and 47 maps (31 %), respectively. Fur-thermore, the motion level was assessed as “no mo-tion” in 35 slices (23%), “small motion” in 69 slices (46%), and “large motion” in 46 slices (30%). In “no motion” data, all ARCTIC motion corrected and un-corrected T2maps received a subjective quality score
of 4.0 and 97 % of them had similar relative quality. In
“small motion” data, ARCTIC motion corrected T2maps
had higher subjective quality score (3.71 ± 0.49 vs. 3.61 ± 0.60, p= 0.015) and superior (23%), similar (75%) and
Fig. 2Dice similarity coefficient (DSC) (a,b) and myocardial boundary error (MBE) (c,d) obtained using the T2P4TE sequence under breath-hold
(BH), free breathing (FB), and free breathing with respiratory navigator gating (FB + NAV). DSCs and MBEs of all T2-weighted images are shown in
(a) and (b), respectively. (b) and (d) show DSC and MBE as average (central dot), standard deviation (box size) and minimum/maximum (whiskers) over all subjects and all T2-weighted images (except the T2prep =∞images). In-plane motion correction improves the DSC and reduces the MBE
[image:6.595.59.537.89.329.2]inferior (1%) relative quality than uncorrected T2maps. In
“large motion” data, ARCTIC motion corrected T2maps
had higher subjective quality score (3.41 ± 0.69 vs. 2.72 ± 0.83,p< 0.001) and superior (65%), similar (28%) and in-ferior (6%) relative quality than uncorrected T2maps.
Discussion
In this study, we demonstrate the benefit of vivo in-plane ARCTIC motion correction in myocardial T2
mapping. The method provides improved alignment of the myocardium in T2-weighted images acquired with
breath-hold acquisitions and free breathing acquisitions with and without respiratory navigator gating. ARCTIC motion correction improves T2 map quality which
re-sults in improved reproducibility and spatial variability of myocardial T2 estimates. Finally, the CPU/GPU
im-plementation of ARCTIC substantially reduces the com-putation time of the T2map reconstruction to 20s which
is suitable for clinical applicability.
DSCs and MBEs found in this study are in good agree-ment with previous studies [23–25, 38]. As expected higher mis-alignments were observed using free breath-ing acquisitions without respiratory navigator gatbreath-ing. DSCs/MBEs improvement was obtained in all three types of acquisitions. This confirms the benefit of mo-tion correcmo-tion, even for data acquired with a breath-hold. This is likely because 40-60% of patients fail to sustain a stable breath-hold in these conditions [23–25]. Furthermore, similar DSCs/MBEs were obtained after motion correction using the three acquisition conditions (breath-hold and free breathing with and without re-spiratory navigator). It is important to note that through-plane motion cannot be compensated when using the free breathing acquisition without respiratory navigator gating. In this case, the efficacy of in-plane motion correction algorithms depends on the subject’s heart orientation in relation to his respiratory move-ment. The use of respiratory navigator appears thus
Fig. 3Example of multiple T2maps acquired on the same subject using the T2P20TE sequence acquired under free breathing conditions
with respiratory navigator gating. T2maps were reconstructed with all T2prep echo times (20 TEs) or only a subset of the T2prep echo
times (0 ms, 25 ms, 50 ms,∞) (4 TEs). While the remaining in-plane motion generates artifacts on the directly reconstructed T2maps
(uncorrected), substantial improvement of T2map quality was obtained using in-plane motion correction (motion corrected). As expected,
[image:7.595.58.539.89.438.2]desirable to enable through plane motion compensation in free breathing acquisitions. The registration accuracy was not evaluated in the TET2P=∞ images since the
contrast is too low to identify the myocardium. Motion correction is expected to have slightly lower accuracy in those images due to the expected limited ability to com-pensate for complex motion.
The ARCTIC approach successfully corrected the en-countered motion in all subjects. In this study, the heart motion patterns were mainly influenced by the breathing activity of the subjects and to lesser extent to their RR-interval variations. However, the motion pattern can be more complex in patients imaged during arrhythmic events. The performance of the method in such condi-tions was not investigated and should be addressed in future work.
The reproducibility and spatial variability of T2
map-ping was improved using ARCTIC. The use of 20 T2
-weighted images improved the reproducibility and the spatial variability of T2 mapping (over the use of only
4 T2-weighted images) by a factor of 2 and 1.4,
respect-ively. Therefore, the choice of the number of T2prep
echo times depends on the desired trade-off between ac-quisition time and T2 map quality. Further studies are
warranted to determine the clinically relevant threshold
providing satisfactory T2 map quality in a reasonable
amount of time.
Reproducibility and spatial variability of T2 estimates
were found similar in all myocardial segments when using 20 TEs. However, slight differences seemed to be observed when using 4TEs only, especially in the myo-cardial segment #4 (inferior wall). Several factors could have contributed to this observation including 1) in-creased sensitivity to cardiac motion and partial volum-ing in the free wall due to reduced wall thickness, 2) increased field inhomogeneity in myocardial segments located at the heart/lung interface. Future studies are warranted to study the impact of each of these factors.
In this study, the data were acquired using our re-cently developed T2 mapping sequence. The ARCTIC
approach is expected to provide similar motion correc-tion performance using other T2 mapping sequences.
Nevertheless, the impact of motion correction on the re-producibility and spatial variability of other T2mapping
sequences may be different and is beyond the scope of this study. Furthermore, all data were acquired in 2D. 3D myocardial T2mapping may represent a valuable
ap-proach for true 3D assessment of pathological tissues [39, 40]. The extension of the ARCTIC approach to 3D is straightforward and is expected to provide similar
Fig. 4Reproducibility of T2mapping using the T2P20TE sequence acquired under free breathing with respiratory navigator gating. Reproducibility
was evaluated for T2maps reconstructed using only a subset of the T2prep echo times (0 ms, 25 ms, 50 ms,∞) (4TEs) (a,b) and using all 20
T2prep echo times (20 TEs) (c,d). Average and standard deviation of T2reproducibility is reported over all subjects for each segment (a,c) and
[image:8.595.58.539.87.379.2]Fig. 5Spatial variability of T2mapping in all subjects using the T2P20TE sequence acquired under free breathing conditions with respiratory navigator
gating. Spatial variability was evaluated for T2maps reconstructed using only a subset of the T2prep echo times (0 ms, 25 ms, 50 ms,∞) (4TEs) (a,b)
and using all 20 T2prep echo times (20 TEs) (c,d). Average and standard deviation of T2spatial variability is reported over all subjects for each segment
(a,c) and over all segments for each subject (b,d). In-plane motion correction using ARCTIC reduced the spatial variability of T2mapping
Fig. 6Example uncorrected and ARCTIC motion corrected T2maps obtained in patients. Subjective T2map quality scores are shown for each
map (right upper corner). Motion among T2-weighted resulted in large regional variations/artifacts in myocardial T2estimates of uncorrected
[image:9.595.60.538.88.378.2] [image:9.595.57.543.474.698.2]improvement of the reproducibility and spatial variability of 3D T2mapping.
There are several limitations in this study. In the in-vivo analysis of reproducibility and spatial variability, the 4TEs data were extracted from the T2P20TE sequence
and were thus not acquired using the T2P4TE sequence.
However, since the T2P20TE sequence was acquiring
with respiratory gating, the potential bias in reproduci-bility and spatial variareproduci-bility obtained in the 4TEs data should have been kept to the minimum. Finally, the study was only performed in healthy adult subjects with limited sample size. Further studies are warranted to confirm the benefit of the ARCTIC approach to improve the reproducibility and spatial variability of myocardial T2mapping in patients.
Conclusions
The ARCTIC technique substantially reduces spatial mis-alignment among T2-weighted images. This method
improves the reproducibility and reduces the spatial variability of in-vivo T2 mapping. Furthermore, the
in-vivo reproducibility and spatial variability of T2mapping
is improved using a higher number of T2prep echo times
combined with ARCTIC motion correction.
Abbreviations
T2prep:T2 prepared; ARCTIC: Adaptive registration of varying contrast-weighted images for improved tissue characterization; BH: Breath-hold; FB: Free breathing; FBNAV: Free breathing conditions with respiratory navigator gating; DSC: DICE similarity coefficient; MBE: Myocardial boundary errors (MBE); TE: Eecho times; SSFP: Steady-state free precession; HIPAA: Health insurance portability and accountability act; ECG: Electrocardiogram; TET2P: T2prep echo times; TR: Repetition time; FOV: Field of view; SENSE: Sensitivity encoding; SNR: Signal-to-noise ratio; GPU: Graphic processing unit; CUDA: Compute unified device architecture.
Competing interests
SR, WJM and RN have a pending patent for methods for correcting motion for tissue characterization sequences. TB, MA, WJM, and RN have a pending patent for system and method for assessing T2relaxation times with
improved accuracy.
Authors’contributions
SR participated in the study design and coordination, developed the ARCTIC approach, carried out the motion correction/reconstruction of the data, performed the data analysis and drafted the manuscript. TB developed the prospective T2mapping sequence and participated in data acquisition. SW
developed the T2mapping reconstruction code. MA participated in the data
acquisition. SB was in charge of subject recruitment. WJM helped in revising the manuscript. RN conceived the study, participated in the study design and interpretation of the data. All authors read and approved the final manuscript.
Acknowledgements
The project described was partially supported by NIH R01EB008743-01A2, and Samsung Electronics, Suwon, South Korea.
Fig. 7Subjective assessment of T2map quality in patients. In-plane motion correction using ARCTIC increased T2map quality scores (3.69 ± 0.55
[image:10.595.55.538.89.369.2]Author details
1
Department of Medicine (Cardiovascular Division), Beth Israel Deaconess Medical Center, 330 Brookline Ave, Boston, MA 02215, USA.2Biomedical Engineering Department, Cairo University, Giza, Egypt.3Computer Assisted Clinical Medicine, University Medical Center Mannheim, Heidelberg University, Mannheim, Germany.4Radiology, Beth Israel Deaconess Medical Center and Harvard Medical School, Boston, MA, USA.
Received: 29 January 2015 Accepted: 1 May 2015
References
1. Higgins CB, Herfkens R, Lipton MJ, Sievers R, Sheldon P, Kaufman L, et al. Nuclear magnetic resonance imaging of acute myocardial infarction in dogs: alterations in magnetic relaxation times. Am J Cardiol. 1983;52(1):184–8. 2. Abdel-Aty H, Boye P, Zagrosek A, Wassmuth R, Kumar A, Messroghli D, et al.
Diagnostic performance of cardiovascular magnetic resonance in patients with suspected acute myocarditis: comparison of different approaches. J Am Coll Cardiol. 2005;45(11):1815–22.
3. Friedrich MG, Sechtem U, Schulz-Menger J, Holmvang G, Alakija P, Cooper LT, et al. Cardiovascular magnetic resonance in myocarditis: A JACC White Paper. J Am Coll Cardiol. 2009;53(17):1475–87.
4. Abdel-Aty H, Cocker M, Friedrich MG. Myocardial edema is a feature of Tako-Tsubo cardiomyopathy and is related to the severity of systolic dysfunction: insights from T2-weighted cardiovascular magnetic resonance. Int J Cardiol. 2009;132(2):291–3.
5. Abdel-Aty H, Zagrosek A, Schulz-Menger J, Taylor AJ, Messroghli D, Kumar A, et al. Delayed enhancement and T2-weighted cardiovascular magnetic resonance imaging differentiate acute from chronic myocardial infarction. Circulation. 2004;109(20):2411–6.
6. Raman SV, Simonetti OP, Winner 3rd MW, Dickerson JA, He X, Mazzaferri Jr EL, et al. Cardiac magnetic resonance with edema imaging identifies myocardium at risk and predicts worse outcome in patients with non-ST-segment elevation acute coronary syndrome. J Am Coll Cardiol. 2010;55(22):2480–8.
7. Cury RC, Shash K, Nagurney JT, Rosito G, Shapiro MD, Nomura CH, et al. Cardiac magnetic resonance with T2-weighted imaging improves detection of patients with acute coronary syndrome in the emergency department. Circulation. 2008;118(8):837–44.
8. Simonetti OP, Finn JP, White RD, Laub G, Henry DA. "Black blood" T2-weighted inversion-recovery MR imaging of the heart. Radiology. 1996;199(1):49–57. 9. Abdel-Aty H, Simonetti O, Friedrich MG. T2-weighted cardiovascular
magnetic resonance imaging. J Magn Reson Imaging. 2007;26(3):452–9. 10. Arai AE. Using magnetic resonance imaging to characterize recent
myocardial injury: utility in acute coronary syndrome and other clinical scenarios. Circulation. 2008;118(8):795–6.
11. Bottomley PA, Foster TH, Argersinger RE, Pfeifer LM. A review of normal tissue hydrogen NMR relaxation times and relaxation mechanisms from 1-100 MHz: dependence on tissue type, NMR frequency, temperature, species, excision, and age. Med Phys. 1984;11(4):425–48.
12. McNamara MT, Higgins CB, Schechtmann N, Botvinick E, Lipton MJ, Chatterjee K, et al. Detection and characterization of acute myocardial infarction in man with use of gated magnetic resonance. Circulation. 1985;71(4):717–24.
13. Foltz WD, Stainsby JA, Wright GA. T2 accuracy on a whole-body imager. Magn Reson Med. 1997;38(5):759–68.
14. He T, Gatehouse PD, Anderson LJ, Tanner M, Keegan J, Pennell DJ, et al. Development of a novel optimized breathhold technique for myocardial T2 measurement in thalassemia. J Magn Reson Imaging. 2006;24(3):580–5. 15. Brittain JH, Hu BS, Wright GA, Meyer CH, Macovski A, Nishimura DG.
Coronary angiography with magnetization-prepared T2 contrast. Magn Reson Med. 1995;33(5):689–96.
16. Huang TY, Liu YJ, Stemmer A, Poncelet BP. T2 measurement of the human myocardium using a T2-prepared transient-state TrueFISP sequence. Magn Reson Med. 2007;57(5):960–6.
17. Giri S, Chung YC, Merchant A, Mihai G, Rajagopalan S, Raman SV, et al. T2 quantification for improved detection of myocardial edema. J Cardiovasc Magn Reson. 2009;11:56.
18. Giri S, Shah S, Xue H, Chung YC, Pennell ML, Guehring J, et al. Myocardial T(2) mapping with respiratory navigator and automatic nonrigid motion correction. Magn Reson Med. 2012;68(5):1570–8.
19. Blume U, Lockie T, Stehning C, Sinclair S, Uribe S, Razavi R, et al. Interleaved T(1) and T(2) relaxation time mapping for cardiac applications. J Magn Reson Imaging. 2009;29(2):480–7.
20. Kellman P, Hansen MS. T1-mapping in the heart: accuracy and precision. J Cardiovasc Magn Reson. 2014;16:2.
21. Piechnik SK, Ferreira VM, Lewandowski AJ, Ntusi NA, Banerjee R, Holloway C, et al. Normal variation of magnetic resonance T1 relaxation times in the human population at 1.5 T using ShMOLLI. J Cardiovasc Magn Reson. 2013;15:13.
22. Cheng ASH, Pegg TJ, Karamitsos TD, Searle N, Jerosch-Herold M, Choudhury RP, et al. Cardiovascular magnetic resonance perfusion imaging at 3-tesla for the detection of coronary artery disease. J Am Coll Cardiol. 2007;49(25):2440–9.
23. Roujol S, Foppa M, Weingartner S, Manning WJ, Nezafat R. Adaptive registration of varying contrast-weighted images for improved tissue characterization (ARCTIC): application to T1 mapping. Magn Reson Med. 2015;73(4):1469-82.
24. Xue H, Greiser A, Zuehlsdorff S, Jolly MP, Guehring J, Arai AE, et al. Phase-sensitive inversion recovery for myocardial T1 mapping with motion correction and parametric fitting. Magn Reson Med. 2013;69(5):1408–20.
25. Xue H, Shah S, Greiser A, Guetter C, Littmann A, Jolly MP, et al. Motion correction for myocardial T1 mapping using image registration with synthetic image estimation. Magn Reson Med. 2012;67(6):1644–55. 26. Akçakaya M, Basha TA, Weingärtner S, Roujol S, Berg S, Nezafat R. Improved
quantitative myocardial T2 mapping. Mag Reson Med 2014, In Press. doi:10.1002/mrm.25377.
27. Cornelius N, Kanade T. Adapting optical-flow to measure object motion in reflectance and X-ray image sequences. ACM SIGGRAPH Comput Graph. 1984;18:24–5.
28. Butler CR, Thompson R, Haykowsky M, Toma M, Paterson I. Cardiovascular magnetic resonance in the diagnosis of acute heart transplant rejection: a review. J Cardiovasc Magn Reson. 2009;11:7.
29. Roujol S, Benois-Pineau J, de Senneville BD, Quesson B, Ries M, Moonen C. Real time constrained motion estimation for ECG-gated cardiac MRI. 2010. IEEE. p 757-760.
30. Roujol S, Benois-Pineau J, de Senneville BD, Ries M, Quesson B, Moonen CT. Robust real-time-constrained estimation of respiratory motion for interventional MRI on mobile organs. IEEE Trans Inf Technol Biomed. 2012;16(3):365–74.
31. Pratikakis I, Barillot C, Hellier P, Memin E. Robust multiscale deformable registration of 3D ultrasound images. International Journal of Image and Graphics. 2003;3(04):547–65.
32. de Senneville BD, Noe KO, Ries M, Pedersen M, Moonen CT, Sorensen T. An optimised multi-baseline approach for on-line MR-temperature monitoring on commodity graphics hardware. 2008. IEEE. p 1513-1516.
33. Ostergaard Noe K, De Senneville BD, Elstrom UV, Tanderup K, Sorensen TS. Acceleration and validation of optical flow based deformable registration for image-guided radiotherapy. Acta Oncol. 2008;47(7):1286–93. 34. Roujol S, Ries M, Quesson B, Moonen C, Denis de Senneville B. Real-time
MR-thermometry and dosimetry for interventional guidance on abdominal organs. Magn Reson Med. 2010;63(4):1080–7.
35. Lourakis M. levmar: Levenberg-Marquardt nonlinear least squares algorithms in C/C++. www.ics.forth.gr/~lourakis/levmar/ 2004, Updated on November 29, 2011, Accessed on June 1, 2013.
36. Dice LR. Measures of the amount of ecologic association between species. Ecology. 1945;26(3):297–302.
37. Cerqueira MD, Weissman NJ, Dilsizian V, Jacobs AK, Kaul S, Laskey WK, et al. Standardized myocardial segmentation and nomenclature for tomographic imaging of the heart. A statement for healthcare professionals from the Cardiac Imaging Committee of the Council on Clinical Cardiology of the American Heart Association Circulation. 2002;105(4):539–42.
38. Cheng C, Herfkens R, Taylor C. Inferior vena caval hemody- namics quantified in vivo at rest and during cycling exercise using magnetic resonance imaging. Am J Physiol Heart Circ Physiol. 2003;284(4):H1161–1167.
39. Ding H, Schär M, Zviman M, Halperin HR, Beinart R, Herzka DA. High-resolution quantitative 3D T2 mapping allows quantification of changes in edema after myocardial infarction. J Cardiovasc Magn Reson. 2013;15 Suppl 1:181. 40. Heeswijk RB, Piccini D, Feliciano H, Hullin R, Schwitter J, Stuber M. Self-navigated