IJPSR (2019), Volume 10, Issue 5 (Research Article)
Received on 08 September 2018; received in revised form 16 November 2018; accepted, 20 November 2018; published 01 May 2019
SPECTROPHOTOMETRIC DETERMINATION OF MEBENDAZOLE THROUGH CHARGE TRANSFER INTERACTIONS
Reem M. Alghanmi * and Lamyaa Yousef Alhazmi
Department of Chemistry, Faculty of Science, University of Jeddah, Jeddah, Saudi Arabia.
ABSTRACT: This article presents the development of a direct, simple and sensitive spectrophotometric method for the quantitative analysis of mebendazole (MBz), an anthelmintic medication in its pure and pharmaceutical forms. The method is based on the charge transfer (CT) interactions between MBz, an electron donor, and chloranilic acid (CA), 3,5-dinitrosalicylic acid (DNSA), and picric acid (PA), (all of which are -acceptors). The products of the CT reactions exhibit new absorption bands at 409 and 310 nm for CA and DNSA in methanol, respectively, and at 402 nm for PA in dichloroethane. Following the optimization of the experimental conditions, linearity ranges for MBz concentrations of 2.00-120, 1.00-40.0 and 2.00-25.0 µg mL-1 were achieved for CA-MBz, DNSA-MBz, and PA-MBz, respectively. Furthermore, the limits of detection (LOD) and quantification (LOQ) were calculated. The method was used to determine the MBz concentrations of tablets with good accuracy and precision and without interference from common tablet excipients.
INTRODUCTION: Mebendazole (MBz), i.e., methyl [5- benzol- 1H- benzoimidazole- 2- yl] carbamate Scheme 1, is a broad spectrum anthelmintic drug widely used against hookworm, pinworm, roundworm, tapeworm, threadworm and mixed infestations. Furthermore, MBz is widely used against gastrointestinal helminths in both humans and animals 1, 2. The most common global diseases are helminthic, and they cause a variety of serious health problems and impact child growth by causing anemia and other nutritional deficiencies 3. Thus, the World Health Organization (WHO) categorize MBz as an essential medicine in its capacity as a single-dose treatment for helminthic infections 4.
QUICK RESPONSE CODE
DOI:
10.13040/IJPSR.0975-8232.10(5).2504-15
The article can be accessed online on
www.ijpsr.com
DOI link: http://dx.doi.org/10.13040/IJPSR.0975-8232.10(5).2504-15
MBz has been shown to exhibit clinical efficiency, minimal side effects, and proven safety. It is available in tablet and syrup form, and its dosage varies for adults and children depending on the worm type being treated 5.
Several analytical methods have been reported for the determination of MBz in pharmaceutical formulations and biological samples. These methods include the following: titrimetry 6-9, UV-visible spectrophotometry 8, 10-13, phosphorescence
14
, FT-IR spectroscopy 15, proton nuclear magnetic resonance spectrometry 16, fluorimetry 17, 18, thermogravimetry 19, membrane-sensor based potentiometry 20, polarography 21-23, voltammetry
24
, high-performance liquid chromatography 25-31, and high performance thin layer chromatography 32,
33
. However, many of the above methods suffer from disadvantages such as poor sensitivity, the need for high-cost solvents and reagents, elaborate sample extraction and treatment procedures, heating or cooling steps, and complicated instruments or experimental setups.
Keywords:
Mebendazole, Charge transfer, Chloranilic acid, Picric acid, Determination, Pharmaceutical Correspondence to Author: Reem M. Alghanmi
Department of Chemistry, Faculty of Science, University of Jeddah, Jeddah, Saudi Arabia.
Many drugs can act as electron donors because they contain atoms such as nitrogen, oxygen or sulfur that can donate electrons. Thus, charge transfer (CT) interactions have attracted considerable researchers attention as a means to study drug-receptor interactions, investigate drug action mechanisms and analyze and determine drugs in their pure and pharmaceutical forms and biological samples 34.
Accordingly, this study aimed to develop a direct, simple, sensitive and precise spectrophotometric method to detect and quantify MBz in its pure and dosage forms. The method is based on the formation of CT complexes between MBz, an electron donor and chloranilic acid (CA), 3,5-dinitrosalicylic acid (DNSA), and picric acid (PA), all of which are -acceptors. To the best of the authors’ knowledge, this represents the first time this methodology has been applied to the determination of MBz.
SCHEME 1: THE MOLECULAR STRUCTURE OF MEBENDAZOLE, MBz.
MATERIALS AND METHODS: Pure analytical grade mebendazole powder, (MBz, purity 98%) was obtained from Sigma-Aldrich. The pharmaceutical form of MBz (Vermox tablets, 100 mg MBz per tablet from Johnson & Johnson Consumer NV/SA) was obtained from a local pharmacy. CA, DNSA and PA (purities 98%) were obtained from Sigma-Aldrich. Standard stock solutions of CA (5 103 mol L1)and DNSA (5 104 mol L1) were prepared in methanol and a standard stock solution of PA (1 103 mol L1) was prepared in dichloroethane. All reagent solutions were stored in the dark and found to be stable for at least one week. The solvents used throughout the study were obtained from Fisher Scientific at spectroscopic grade and used without further purification.
A standard stock solution of MBz (1000 µg mL1) was prepared by dissolving 100 mg of the pure drug in 15 mL of DMSO and then diluting to 100 mL with methanol. This solution was used for complexation with CA and DNSA. Another standard stock solution of MBz (1000 g mL1) was prepared for complexation with PA in the same way but using dichloroethane instead of methanol as a solvent. The MBz stock solutions were stored in a refrigerator and found to be stable for at least one week. Working solutions (200 µg mL1)were prepared immediately before measurement by further diluting the stock solution with methanol or dichloromethane. All electronic absorption spectra were measured over the wavelength range 200-700 nm using a UV 1800 (Shimadzu, Japan) UV-Vis instrument connected to a TCC-ZUOA (Shimadzu, Japan) temperature controller unit.
General Procedures (Calibration curves):
CA Acceptor: Aliquots of the working MBz solution with volumes calculated to provide final concentrations in the range 2.00-160 g mL1 were transferred into a series of 10-mL calibration flasks. Then, 1 mL of 5 × 10³ g mL1 CA solution was added to each flask, and the resultant CA-MBz mixtures were diluted to the flask mark with methanol. The absorbances of all of the solutions were recorded at 530 nm against a CA blank.
DNSA Acceptor: Aliquots of the working MBz solution with volumes calculated to provide final concentrations in the range 1.00-50.0 g mL1 were transferred into a series of 10-mL calibration flasks. Then, 0.1 mL of 5 × 10⁴ g mL1 DNSA solution was added to each flask, and the resultant DNSA-MBz mixtures were diluted to the flask mark with methanol. The absorbances of all of the solutions were recorded at 310 nm against a DNSA blank.
In each of the above cases, the absorbance values of all of the solutions were plotted as a function of the MBz concentration to construct calibration curves.
Pharmaceutical Samples Preparation: Ten tablets of the pharmaceutical drug were weighed, ground into powder, and thoroughly mixed. An accurately weighed portion of the powder equivalent to 150 mg of MBz was dissolved in 7.5 mL of DMSO and stirred with gentle warming for 10 min. The solution was filtered, and the first 10 mL was discarded. The remainder was diluted to 50-mL with methanol (for CA and DNSA) or dichloroethane (for PA) to obtain a final concentration of 1000 g mL-1. Aliquots of this solution were used to test the suggested method.
RESULTS AND DISCUSSION:
Electronic Spectra: MBz has many electron dense sites and can act as a strong electron donor. Accordingly, the detection of MBz by our spectrophotometric method depends on the reaction expected of MBz with CA, DNSA, or PA to form stable CT complexes.
When using CA as the acceptor, a stable deep purple product is immediately formed upon mixing the MBz and CA solutions in methanol at room temperature. This is accompanied by the appearance of a new absorption band in the electronic spectra at max = 530 nm, which is not
observed in the spectra of the free reactants Fig. 1.
FIG. 1: ELECTRONIC SPECTRA OF CA, MBz AND [MBz-CA] COMPLEX IN METHANOL
This new band is attributed to the formation of a CT complex between MBz and CA. Furthermore, the purple color of the product is due to the formation of the radical anion of CA, which is a result of * transition from MBz to CA 35, as shown in Scheme 2. Methanol, a polar solvent,
promotes the complete transfer of electrons from donors to acceptors, resulting in the complete formation of the CA radical anion 36.
SCHEME 2: REACTION OF MBz WITH CA
In the case of DNSA, a new absorption band is detected in the electronic spectra of the DNSA-MBz mixture in the 250-350 nm region (max = 310
[image:3.612.316.565.108.148.2]nm, Fig. 2). This new band indicates the formation of a CT complex between MBz and DNSA. DNSA has both carboxyl and hydroxyl groups, which make it a good proton donor. Therefore, we can reason that the electron transfer from MBz to DNSA will be accompanied by proton transfer from the DNSA to the MBz either from the carboxyl group 37 or the hydroxyl group 38. The charge and proton transfer interactions enhance the bonding between the MBz and DNSA in the resultant complex.
FIG. 2: ELECTRONIC SPECTRA OF DNSA, MBz AND [MBz-DNSA] COMPLEX IN METHANOL
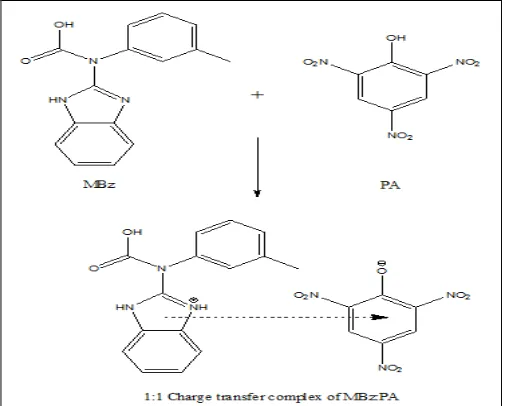
Similarly, a stable intense yellow product is formed when the MBz and PA solutions are mixed in dichloroethane. The electronic absorption spectra of MBz, PA and their mixture are shown in Fig. 3, demonstrating the appearance of a new CT band at
max = 402 nm. The PA dichloroethane solution is
colorless and becomes yellow upon the addition of MBz. The yellow color is due to the formation of picrate ions (phenolate ions) 39, which shows that PA does not dissociate in dichloroethane alone but functions as a proton donor in the presence of MBz.
[image:3.612.313.566.378.499.2]Thus, a possible mechanism for the reaction between MBz and PA, where a proton transfer from the hydroxyl group of PA to the nitrogen atom in the benzimidazole ring of MBz, is shown in Scheme 3. The max values of the CT bands, i.e.,
530 nm for CA, 310 nm for DNSA, and 402 nm for PA, were used in all further measurements to ensure the highest sensitivity for the proposed method. The spectrum of the CT complex was measured and compared to that of the blank acceptor solution to eliminate any overlap between the complex and acceptor bands.
SCHEME 3: REACTION POSSIBLE MECHANISM OF MBZ WITH PA IN DICHLOROETHANE
FIG. 3: ELECTRONIC SPECTRA OF PA, MBz AND [MBz-PA] COMPLEX IN DICHLOROETHANE
Optimization of the CT Reaction Conditions: Effect of the Solvent: The formation of a CT complex between an electron donor and acceptors can be influenced by the nature of the solvent. Thus, the first parameter studied to optimize the reaction conditions were solvent nature. The absorbance characteristics of the CT complexes were examined in various solvents including acetonitrile, methanol, ethanol, dichloroethane, dichloromethane, and chloroform.
The absorbance values of the CT complexes with CA, DNSA and PA acceptors in different solvents are shown in Fig. 4. For CA and DNSA, methanol is the best solvent because stable complexes with the highest absorbances are formed. For PA, the maximum intensity is obtained when dichloro-ethane is used as the solvent.
[image:4.612.315.564.55.182.2] [image:4.612.48.301.231.434.2]
FIG. 4: EFFECT OF SOLVENT ON THE FORMATION OF MBz CT COMPLEXES WITH A-CA, B-DNSA, C-PA A
[image:4.612.55.566.459.730.2]Effect of Acceptor Concentration: The effect of acceptor concentration on the absorbance intensities at the chosen λmax values was
investigated. The absorbances of the CT complexes with different volumes of the acceptor, i.e., CA (5 × 10⁻³ mol L-1), DNSA (5 × 10⁻⁴ mol L-1),and PA (1 × 10⁻³ mol L-1) were measured. As shown in Fig. 5, the absorbances of the complexes increase as the acceptor volume increases, and the highest absorbances for the complexes are obtained using 1 mL of CA or PA, and 0.1 mL of DNSA in 10 mL calibration flasks.
Effect of the Reaction Time: The effect of the reaction time on the formation of the CT complexes was studied by monitoring the absorbances of the colored products from the reactions between MBz and the acceptors at different times and room temperature.
The CT products exhibit maximum absorbance immediately upon mixing of the MBz and acceptor solutions. Furthermore, the CT products are stable for at least 1 h in the case of CA, and for 2 h in the case of DNSA and PA. Thus, the absorbance values were measured after 1 min in all acceptor-MBz systems to ensure the precision of the measurements.
Effect of Temperature: The effect of temperature on the stability of the formed CT complexes was investigated by measuring the absorbances of mixtures of 5 10-4 mol L-1 CA, 5 10-6 mol L-1 DNSA, and 1 10-4 mol L-1 PA with different concentrations of MBz over the temperature range 20 C to 40 °C. The experimental results show that the absorbance decreases as the temperature increases and that 20 °C is the optimum temperature for all MBz complexes.
FIG. 5: EFFECT OF ACCEPTOR VOLUME ON THE FORMATION OF MBz CT COMPLEX
Determination of the CT Complex Compositions and the Formation Constants: The molecular composition of the CT complexes that form between MBz and the acceptors (CA and PA) was estimated using Job’s method of continuous variations 43. For both complexes, the plot reaches a maximum absorbance at a 0.5-mole fraction, indicating the formation of a 1:1 CT complex Fig. 6. However, the composition of the DNSA complex with MBz was estimated using the Benesi-Hildebrand (BH) equation 44 and the
straight-line method by measuring the absorbance of the CT complex at different concentrations of MBz. For the BH equation to be applied, one of the two reactants must be present in large excess 45.
1 ] [
1 1 ]
[
D f
A
C K
A C
……(1)
Where, [CA] and [CD] are the initial concentrations
the values of [CA]/A against 1/[CD], a straight line is
obtained (r 0.9992), indicating the formation of a 1:1 CT complex [MBz: DNSA], as shown in Fig. 7. The 1:1 ratio for all studied complexes is an agreement with the appearance of only one new absorption band in all spectra Fig. 1-3. This ratio could be related to the stric hindrance effect of the MBz molecule 46. The formation constants, Kf (L
mol-1) and extinction coefficients, (L mol-1 cm-1), of the CT complexes, were calculated using the absorbance values obtained by adding different MBz concentrations to a certain concentration of CA or PA, and by applying the modified Benesi-Hildebrand equation 44 for a 1:1 molar ratio Eq. 2:
/ ) (
/ 1
/ f D A
A
DC A K C C
C ...(2)
Where, CºD and CºA are the concentrations of MBz
and the acceptor, respectively, and A is the absorbance of the CT-bands. By plotting the values of CºD CºA/A against the CºD + CºA values from Eq.
2, linear plots are obtained, confirming the
formation of 1:1 complex Fig. 8 and 9. The Kf and
values were calculated from the plots, where the slope and intercept are equal to 1/ and 1/Kf ,
respectively. Conversely, the Kf, and values of the
DNSA-MBz complex were calculated using the BH equation in the form of Eq. 1. The Kf, , and max
values for all of the complexes are compiled in Table 1. The Kf values are 2.60 × 10³, 3.33 × 10²
and 40.0 × 10³ for the [CA-MBz], [DNSA-MBz] and [PA-MBz] CT complexes, respectively.
These high Kf values confirm the high stability of
the CT complexes formed. The Kf values reveal
that [PA-MBz] complex has the highest value of the formation constant Kf which confirms the high
stability of this complex as a result of the expected high accepting natural of PA compared with both CA and DNSA. PA has three strong withdrawing nitro groups in conjugation with an aromatic ring which causes high delocalization leads to a great increase in the acidity of PA 47.
FIG. 6: JOB’S METHOD PLOT FOR MBz CT FIG. 7: BENESI-HILDEBRAND PLOT OF [MBz-DNSA] COMPLEXES WITH CA OR PA COMPLEX
FIG. 8: BENESI-HILDEBRAND PLOT OF [MBz-CA] FIG. 9: BENESI-HILDEBRAND PLOT OF [MBz-PA] COMPLEX COMPLEX
Determination of Some Spectroscopic Physical Data: The experimental oscillator strengths (f) 48 and transition dipole moments (µ) 49 of the MBz CT complexes were determined by applying the following equations 50:
max 1/2
9
10 32 .
4
f ……(3)
1/2max 2 / 1
max /
0958 .
0
[image:6.612.53.563.364.724.2]Where ∆v1/2 is the half bandwidth of the absorbance
in cm-1, and εmax and v̄max are the molar extinction
coefficient and wavenumber for the maximum absorption of the CT complexes, respectively.
Table 1 shows that both the oscillator strength and transition dipole moment values for all complexes are relatively high, which confirms the strong interactions between MBz and the acceptors. These results are consistent with the lower CT energy values, ECT, which were calculated from
Eq. 551, and are listed in Table 1:
CT CT
E
1243
.
667
/
...(5)Moreover, the ionization potential (IP) value of the
donor, i.e., MBz, was calculated using the following equation 52:
max 4
10 53 . 1 76 . 5 )
(eV
IP ……(6)
Where, v̄max is the wavenumber of the CT band in
cm-1. Table 1 shows the value of IP. The
dissociation energy (W) of the three CT complexes was calculated using the following relationship 53:
W E I
ECT P A ...(7)
Where, EA is the electron affinity of the values
acceptors, which are 1.1 53, 0.59 and 0.72 eV 54 for CA, DNSA, and PA, respectively. The resonance energy (RN) values of the CT complexes in the
ground state are determined using the Briegleb and Czekalla equation 55:
] 5 . 3 ] /[ /[ 10 7 .
7 4
CT N
CT h R
...(8)
Where, CT is the molar extinction coefficient of the
complexes at the maximum absorbance value of the CT band, νCT is the frequency of the CT band, and
RN is the resonance energy of the complex, which
is a parameter of the ground state property. The W and RN values are given in Table 1.
Finally, the standard free energy changes for complexation, ΔG° (kJ mol−1) were estimated from the Kfvalues at 20 °C using the equation 56:
f
K RT G 2.303 log
……(9)
Where, R is the gas constant (8.314 J mol−1 K). The negative values of ΔG° listed in Table 1 indicate that the complexation processes between MBz and CA, DNSA or PA are exothermic and simultaneous.
TABLE 1: THE SPECTROSCOPIC DATA OF THE CT COMPLEXES
Acceptor KCT ×10-3
L mol-1
× 10-3 L mol-1 cm-1
F µ
(Debye)
ECT
(eV)
W
(eV)
IP
(eV)
RN
(eV)
G
kJ mol-1 CA 2.600 0.77 0.090 3.189 2.346 5.201 8.647 0.004 19.50 DNSA 1.000 17.20 30.34 44.70 4.011 6.099 10.70 0.509 14.40 PA 40.00 12.50 10.48 29.92 3.094 5.752 9.566 0.242 26.27
Validation of the Proposed Method: The proposed spectrophotometric method for the determination of MBz is based on the formation of stable CT complexes between MBz and CA or DNSA in methanol, or PA in dichloroethane with a simple 1:1 molecular composition.
The linearity, accuracy, precision, recovery, robustness, and ruggedness of the methods were assessed to validate the proposed method according to the International Conference on Harmonization (ICH) guidelines 57.
Linearity and Sensitivity: Under the optimized experimental reaction conditions, MBz concentration calibration curves were constructed for all acceptors (CA, DNSA, and PA). The curves are linear over the concentration ranges 2.00-120,
1.00-40.0, and 1.00-25.0 μg mL-1 for CA, DNSA, and PA, respectively.The regression equations of the lines were derived using the least square method 58. The limits of detection (LOD) and limit of quantification (LOQ) were calculated using the following equations according to the IUPAC definition 59:
LOD = 3.3Sa/b……(10)
LOQ = 10Sa/b……(11)
Where Sa is the standard deviation of the intercept
and b is the slope of the calibration curve. The linear range, LOD, LOQ, intercept a slope b, Sa, the
standard deviation of the slope (Sb), the standard
deviation of residuals (Sy/x), and correlation
The small Sy/x values indicate that the points are
close to a straight line. Additionally, the small intercept values of the regression equation and the excellent correlation coefficient values (R0.9986) confirm the classic linear relationship between the MBz concentration and the absorbance values in
the proposed methods. Moreover, the LOD and LOQ values in Table 2 indicate that the method utilizing complexation with DNSA is more sensitive for MBz determination than that with the other acceptors (CA or PA).
TABLE 2: LINEARITY, REGRESSION EQUATION AND SENSITIVITY PARAMETERS OF THE PROPOSED METHODS (N = 7)
Parameter Acceptor
CA DNSA PA
Wavelength (max), nm 530 310 402
Linear range, µg mL-1 2.00-120.0 1.00-40.0 2.00-25.00 Molar absorptivity (), L mol-1 cm-1 770 17200 12500
Limit of detection (LOD), µg mL-1 3.129 0.931 1.307
Limit of quantification (LOQ), µg mL-1 9.483 3.104 3.959 Regression equationa
Intercept, a ± Sa 0.0068 ± 1.00 × 10⁻³ 0.0081 ± 5.4 × 10⁻³ 0.021 ± 8.721× 10⁻³
Slope, b ± Sb 0.0011 ± 1.48 × 10⁻⁵ 0.0494 ± 0.3 × 10⁻³ 0.022 ± 0.576 × 10⁻³
Sy/x 1.70 × 10⁻³ 1.53 × 10⁻² 1.17 ×10⁻²
Correlation coefficient, R 0.9994 0.9996 0.9986
Stability of colored products (h) 1 2 2
aA= a + bC, where A is the absorbance, C is the MBz concentration in (µg mL-1), a is the intercept and b is the slope
Accuracy and Precision: The accuracy and precision of the MBz determination method were established by analyzing solutions of four or five different pure MBz concentrations (within the linear range). The measurements were replicated five times during the day (intra-day) and over three consecutive days (inter-day) using the proposed method. The relative standard deviation, (% RSD), relative error (% RE) and percent recovery were calculated, and the results are summarized in Table 3. The relative standard deviation values for CA (% RSD 1.67% for intra-day; % RSD 2.00% for
[image:8.612.46.568.169.325.2]inter-day), DNSA (% RSD 0.47% for intra-day; % RSD 0.54% for inter-day), and PA (% RSD 0.95% for intra-day; % RSD 1.18% for inter-day) are low, confirming the high precision of the proposed method. Also, the small % RE values shown in Table 3 indicate the good accuracy of the method for the determination of MBz with all three acceptors. Moreover, the intra-day and inter-day precision and accuracy results indicate the excellent repeatability and reproducibility of the proposed method.
TABLE 3: EVALUATION OF INTRA-DAY AND INTER-DAY ACCURACY AND PRECISION
Acceptor MBz
taken, µg mL1
Intra-day (n = 5) Inter-day (n = 3)
Found, µg mL-1 ±Confidence
limitsa
% Recovery
%
RSDb
% REc
Found, µg mL-1 ±Confidence
limitsa
% Recovery
%
RSDa
% REb
CA
30 29.82 ± 0.62 99.39 1.67 0.61 29.45 ± 0.78 98.18 1.07 1.82 50 49.64 ± 0.62 99.27 1.00 0.73 49.27 ± 2.26 98.55 1.85 1.45 70 69.64 ± 0.62 99.48 0.72 0.52 69.58 ± 3.45 99.39 2.00 1.61 90 89.10 ± 1.24 98.99 1.12 1.01 89.58 ± 3.45 99.53 1.55 0.47 110 108.9 ± 1.89 99.01 1.40 0.99 109.15 ± 2.32 99.23 0.85 0.77
DNSA
8 7.982 ± 0.03 99.77 0.34 0.22 8.060 ± 0.07 100.8 0.34 0.79 15 15.05 ± 0.05 100.3 0.24 0.31 15.09 ± 0.10 100.6 0.26 0.62 18 17.97 ± 0.11 99.85 0.48 0.15 18.20 ± 0.21 101.1 0.47 1.10 25 25.08 ± 0.06 100.3 0.20 0.32 25.09 ± 0.10 100.4 0.16 0.37
PA
6 5.95 ± 0.02 99.17 0.34 0.83 5.94 ± 0.12 99.02 0.77 0.98 8 7.97 ± 0.04 99.61 0.52 0.87 7.91 ± 0.24 99.64 1.18 0.36 12 11.88 ± 0.08 98.98 0.64 1.02 11.93 ± 0.24 99.38 0.79 0.62 17 16.82 ± 0.17 98.95 0.95 1.04 16.96 ± 0.28 99.74 0.67 0.26 23 22.80 ± 0.13 99.15 0.55 0.85 22.87 ± 0.40 99.41 0.70 0.59
a Average , at 95% confidence level, b %RSD, relative standard deviation; c % RE, relative error
n SD t0.05
[image:8.612.50.566.526.737.2]Robustness: The robustness of the method was investigated by making minor changes to two experimental variables, i.e., the acceptor volume (± 0.1 mL) and reaction time (± 0.5 min), for three different concentrations of pure MBz. The recovery percentage and % RSD values were calculated, and
[image:9.612.52.566.157.392.2]the results are given in Table 4. The recovery percentage and % RSD values indicate that small variations in the variables do not significantly affect the results of the proposed method, confirming the robustness of the proposed method for the determination of MBz.
TABLE 4: ROBUSTNESS OF THE PROPOSED METHODS
Acceptor Parameter MBz taken,
µg mL-1
Found, µg mL-1 ± SD
% Recovery
% RSD CA
(n = 5)
Volume of 5×10⁻⁴ mol L-1 CA (1.00 ± 0.10 mL)
50 49.73 ± 0.45 99.45 0.91 70 69.82 ± 0.81 99.74 1.16 90 89.09 ± 0.76 98.99 0.85 Reaction time (1.00 ± 0.30 min) 50 50.09 ± 0.67 100.2 0.91 70 70.09 ± 0.67 100.1 1.16 90 89.45 ± 0.76 99.39 0.85 DNSA
(n = 5)
Volume of 5×10⁻⁴ mol L-1 DNSA (0.1 ± 0.02 mL)
8.0 7.997 ± 0.03 99.96 0.32 15 15.01 ± 0.05 100.1 0.32 25 24.97 ± 0.08 99.87 0.35 Reaction time (1.00 ± 0.30 min) 8.0 8.051 ± 0.03 100.9 0.41 15 15.15 ± 0.09 101.0 0.62 25 25.25 ± 0.11 101.0 0.44 PA
(n = 7)
Volume of 1×10⁻⁴ mol L-1 PA (1.00 ± 0.10 mL)
10 9.91 ± 0.04 99.08 0.44 15 14.85 ± 0.16 99.00 1.10 20 20.06 ± 0.13 100.3 0.64 Reaction time (1.00 ± 0.30 min) 10 9.950 ± 0.08 99.54 0.78 15 15.03 ± 0.09 100.2 0.60 20 20.11 ± 0.19 100.5 0.96
Ruggedness: The ruggedness of the method was evaluated using the proposed method to determine the MBz concentration under the same experimental conditions on two different
instruments and with two different analysts. The results are shown in Table 5 and indicate the reproducibility of the proposed method as the % RSD does not exceed 2%.
TABLE 5: RUGGEDNESS OF THE PROPOSED METHODS
Acceptor Parameter MBz taken, µg mL-1 Found, µg mL-1 ± SD % Recovery % RSD
CA (n = 5)
Analyst I 50 49.64 ± 0.50 99.27 1.00
70 69.82 ± 0.50 99.74 0.71
Analyst II 50 50.36 ± 0.76 100.7 1.51
70 70.18 ± 0.26 100.3 0.91
Instrument I 50 49.64 ± 0.50 99.27 1.00
70 69.82 ± 0.50 99.74 0.71
Instrument II 50 50.18 ± 1.11 100.3 2.22
70 70.36 ± 0.76 100.3 1.08
DNSA (n = 5)
Analyst I 15 15.03 ± 0.09 100.2 0.59
25 25.02 ± 0.33 100.1 1.35
Analyst II 15 15.39 ± 0.11 102.6 0.73
25 25.05 ± 0.33 100.2 0.34
Instrument I 15 15.03 ± 0.09 100.2 0.59
25 25.02 ± 0.33 100.1 1.35
Instrument II 15 14.79 ± 0.09 98.64 0.63
25 25.05 ± 0.06 100.2 0.22
PA (n = 5)
Analyst I 10 10.05 ± 0.09 100.5 0.88
15 15.00 ± 0.10 100.0 0.70
Analyst II 10 9.98 ± 0.12 99.77 1.18
15 14.72 ± 0.21 98.15 1.42
Instrument I 10 10.05 ± 0.09 100.5 0.88
15 15.00 ± 0.10 100.0 0.70
Instrument II 10 9.99 ± 0.10 99.95 0.98
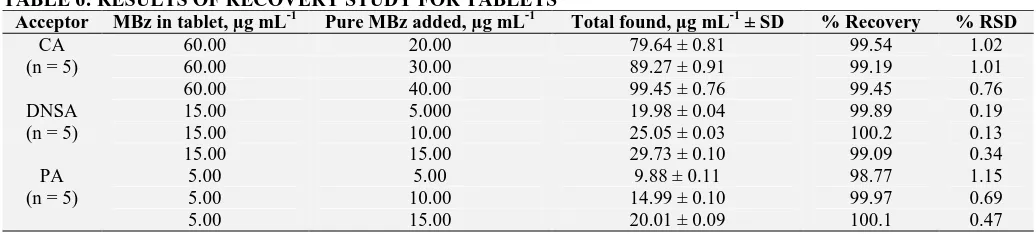
[image:9.612.47.576.476.754.2]Recovery Study: Method validity was confirmed through a recovery study. The recovery was estimated using a standard addition method by adding three different concentration levels of pure MBz to the commercial form of the drug (Vermox tablets). The total MBz concentration was determined using the proposed method using the different acceptors (CA, DNSA, and PA). The recovery percentage values in Table 6 show that all three acceptors afford good accuracies, and the
[image:10.612.47.565.210.327.2]recovery percentage values range from 99.19% to 99.54%, 99.09% to 100.2%, and 98.77% to 100.1% for CA, DNSA, and PA, respectively. Furthermore, the % RSD values range from 0.76% to 1.02%, 0.13% to 0.34%, and 0.47% to 1.15% for CA, DNSA, and PA, respectively. Also, these results indicate that the co-formulated substances and common excipients do not interfere with the determination of MBz concentration.
TABLE 6: RESULTS OF RECOVERY STUDY FOR TABLETS
Acceptor MBz in tablet, µg mL-1 Pure MBz added, µg mL-1 Total found, µg mL-1 ± SD % Recovery % RSD
CA (n = 5)
60.00 20.00 79.64 ± 0.81 99.54 1.02
60.00 30.00 89.27 ± 0.91 99.19 1.01
60.00 40.00 99.45 ± 0.76 99.45 0.76
DNSA (n = 5)
15.00 5.000 19.98 ± 0.04 99.89 0.19
15.00 10.00 25.05 ± 0.03 100.2 0.13
15.00 15.00 29.73 ± 0.10 99.09 0.34
PA (n = 5)
5.00 5.00 9.88 ± 0.11 98.77 1.15
5.00 10.00 14.99 ± 0.10 99.97 0.69
5.00 15.00 20.01 ± 0.09 100.1 0.47
Analysis of the Pharmaceutical Forms: The proposed method was applied to determine the MBz concentration in Vermox tablets. The analysis results are reported as the recovery percentage ± standard deviation Table 7. The obtained results were statistically compared with
those obtained using the reference method 6 by the Student’s t-test and F-test for accuracy and precision, respectively, at a 95% confidence level. The t-test and F-test values in Table 7 show that there are no significant differences between the proposed method and the reference method.
TABLE 7: DETERMINATION OF MBz IN VERMOX TABLETS USING CA, DNSA, AND PA ACCEPTORS
Acceptor Taken,
µg mL-1
Found*, µg mL-1 ± SD % Recovery F-test t-test
Proposed method
Reference method
Proposed method
Reference method
CA 40 39.78 ± 0.47 39.33 ± 0.30 99.45 98.32 2.486 0.751 DNSA 15 15.05 ± 0.10 14.78 ± 0.16 100.3 98.53 2.620 1.820 PA 20 20.05 ± 0.20 19.73 ± 0.37 100.2 98.63 3.467 1.087 *Average value of five determinations. The value of t (tabulated) at 95% confidence level is 2.306. The value of F (tabulated) at 95% confidence level and is 6.388.
CONCLUSION: A direct, simple and accurate method for the determination of pure and pharmaceutical formulations of MBz has been developed. This method is based on monitoring the CT interactions between MBz and CA, DNSA or PA reagents, using a spectrophotometric technique. The formed complexes have stoichiometries of 1:1 in all cases. The excellent correlation coefficient values and small intercept values confirm the good linearity of the MBz calibration curves.
Moreover, the calculated LOD and LOQ values indicate that complexation with DNSA is more sensitive for MBz determination than that with the other acceptors. We can conclude from the
obtained validation results that the proposed method has high accuracy, good repeatability, and excellent reproducibility. Additionally, this method is simple, rapid, and inexpensive and does not require critical reactions or complicated treatments, which are attractive features for analytical pharmaceutical studies.
ACKNOWLEDGEMENT: Nil CONFLICT OF INTEREST: Nil REFERENCES:
[image:10.612.46.562.431.512.2]2. Conesa AJ, Pinilla JM and Hernandez L: Determination of mebendazole in urine by cathodic stripping voltammetry. Analytical Chimica Acta 1996; 331: 111-16.
3. Awasthi S, Bundy DAP and Savioli L: Helminthic infections. The British Medical Journal 2003; 327(7412): 431-33.
4. Crompton DW, Montresor A, Nesheim MC and Savioli L: Controlling Disease Due to Helminth Infections. Geneva: World Health Organization 2003.
5. Drug Index, New Delhi, Passi Publications 1999; 3: 307. 6. Wahbi AM and Onsy S: Determination of mebendazole.
Talanta 1978; 25: 716-17.
7. Patel AA, Gandhi TP and Patel VC: Estimation of mebendazole in raw materials and formulations. Indian Journal of Pharmacology 1978; 40: 20-21.
8. Mohammed FA, Sidhom MB and Hussein HA: Titrimetric and spectrophotometric determination of mebendazole and flubendazole using N-bromosuccinimide. Bulletin of Pharmaceutical Science, Assiut University 1986; 9: 92-04. 9. El-Bardicy MG, Mohammed MY and Tawakkol MS:
Determination of mebendazole via its iodobismuthate complex. Bulletin of Faculty of Pharmacy, Cairo University 1993; 31: 287-90.
10. El-Bardicy MG, Mohammed MY and Tawakkol MS: Spectrophotometric determination of mebendazole. Bulletin of Faculty of Pharmacy, Cairo University 1990; 28: 11-14.
11. Swamy N and Basavaiah K: Selective and sensitive assay of mebendazole in pharmaceuticals using bromocresol green by spectrophotometry. Thai Journal of Pharmaceutical Science 2013; 37: 171-85.
12. Swamy N, Prashanth KN and Basavaiah K: Spectrophoto-metric assay of mebendazole in dosage forms using sodium hypochlorite. Journal of Applied Spectroscopy 2014; 81: 525-533.
13. Parakh DR, Patil MP, Sonawane SS and Jain CP: Development and validation of a spectrophotometric method for estimation of mebendazole in bulk and pharmaceutical formulation. World Journal of Pharmaceutical Research 2015; 4: 2223-2235.
14. Baeyens WRG, Abdel Fattah F and De Moerlosse P: Low-temperature phosphorescence analysis of mebendazole and related imidazoles. Analytical Letters 1985; 18: 2105-26. 15. Da Silva VH, Goncalves JL, Vasconcelos FVC, Pimentel
MF and Pereira CF: Quantitative analysis of mebendazole polymorphs in pharmaceutical raw materials using near-infrared spectroscopy. Journal of Pharmaceutical Biomedical Analysis 2015; 115: 587-93.
16. Al-Khamees HA and El-Shazly BM: Determination of mebendazole and its formulations using 1H nuclear magnetic resonance spectrometry. Anal 1988; 113: 599-02. 17. Abdel-Fattah F, Baeyens W and De-Moerloose P: Fluorimetric determination of mebendazole and flubendazole in pharmaceutical dosage forms after alkaline hydrolysis. Analytical Chimica Acta 1983; 154: 351. 18. Baeyens W, Abdel-Fattah F and De-Moerloose P:
Fluorimetric analysis of mebendazole and flubendazole with hydrogen peroxide. Journal of Pharmaceutical and Biomedical Analysis 1985; 3: 397-04.
19. Gomes APB, Correia LP, Simoes MOS and Macedo RO: Development of a thermogravimetric method to the quantitative determination of mebendazole. Journal of Thermal Analysis and Calorimetry 2007; 87: 919-25. 20. Kumar KG, Sareena J, Augustine P, Remalakshmy P and
Beena S: Mebendazole selective membrane sensor and its application to pharmaceutical analysis. Analytical Science 2007; 23: 291-94.
21. Pinzauti S, La-Porta E and Papeschi G: D.C. Polarography for mebendazole analysis. Journal of Pharmaceutical and Biomedical Analysis 1983; 1: 223-28.
22. Temezer A, Ozaltin N, Orbey MT and Ozcan T: Electrochemical reduction of mebendazole and its determination in a pharmaceutical dosage form by differential pulse polarography. Journal of Pharmacy (Belgium) 1987; 42: 247-50.
23. Jeyaseelan C and Joshi AP: Study of mebendazole by differential pulse polarography. International Journal of ChemTech Research 2009; 1: 596-01.
24. Ghalkhani M and Shahrokhian S: Adsorptive stripping differential pulse voltammetric determination of mebendazole at a graphene nanosheets and carbon nanospheres/chitosan modified glassy carbon electrode. Sensors and Actuators B: Chemical 2013; 185: 669-74. 25. Sadana GS and Parikh GG: A high performance liquid
chromatographic method for the determination of mebendazole from its pharmaceutical preparations. Indian Drugs 1987; 24: 533-34.
26. Argekar AP, Raj SV and Kapadia SU: Simultaneous determination of mebendazole and pyrantel pamoate from tablets by high-performance liquid chromatography-reverse phase (RP-HPLC). Talanta 1997; 44: 1959-65. 27. Halkar UP, Rane SH and Bhandari NP: Reverse phase
high-performance liquid chromatographic determination of pyrantel pamoate and mebendazole in tablets. Indian Drugs 1997; 34: 194-96.
28. Al-Kurdi Z, Al-Jallad T, Badwan A and Jaber AMY: High-performance liquid chromatography method for determination of methyl- 5- benzoyl- 2- benzimidazole carbamate (mebendazole) and its main degradation product in pharmaceutical dosage forms. Talanta 1999; 50: 1089-97.
29. Gomes AR and Nagaraju V: High-performance liquid chromatographic separation and determination of the process related impurities of mebendazole, fenbendazole and albendazole in bulk drugs. Journal of Pharmaceutical and Biomedical Analysis 2001; 26: 919-27.
30. Ramesh R, Yadgire SK and Bhanu R: Simultaneous determination of levamisole HCL and mebendazole in tablets by reverse phase HPLC. Indian Drugs 2001; 38: 67-68.
31. Nubia PK and Marcelo SM: Validation of an analytical methodology for the simultaneous dosing of mebendazole and thiabendazole by high-performance liquid chromatography. Quimica Nova 2007; 30: 1359-61. 32. Zarapkar SS, Kolte SS and Rane SH: Simultaneous
determination of pyrantel pamoate and mebendazole in tablets by high-performance thin layer chromatography. Indian Drugs 1997; 34: 707-09.
33. Anon: Simultaneous determination of pyrantel pamoate and mebendazole in tablets by high-performance thin layer chromatography. Indian Drugs 1998; 35: 49-51.
34. Basavaiah K: Determination of some psychotropic phenothiazine drugs by charge-transfer complexation reaction with chloranilic acid. ll Farmaco 2010; 59: 315-21.
35. Alghanmi RM and Habeeb MM: Spectral and solvation effect studies on charge transfer complex of 2, 6-diaminopyridine with chloranilic acid. Journal of Molecular Liquids 2013; 181: 20-28.
36. Salem H: Analytical study for the charge-transfer complexes of pregabalin. E-Journal of Chemistry 2009; 6: 332-40.
transfer complex formed between 2,2′-bipyridine and 3,5-dinitrosalicylic acid. Journal of Molecular Liquids 2014; 191: 142-50.
38. Smith G, Lynch DE, Byriel K and Kennard CHL: Molecular cocrystals of carboxylic acids. XX the crystal structures of 3,5-dinitrosalicylic acid and its adducts with the isomeric monoaminobenzoic acids. Australian Journal of Chemistry 1995; 48: 1133-49.
39. Higuchi T and Brochmann-Hanssen E: Pharmaceutical Analysis, New Delhi, India: CBS Publishers 1997. 40. El-Habeeb AA, Al-Saif FA and Refat MS: Charge-transfer
interactions of metoclopramide nausea drug against six kinds of π-acceptors: Spectral and thermal discussions. Spectrochimica Acta A 2014; 123: 455-66.
41. Refat MS, Saad HA and Adam AM: Spectral, thermal and kinetic studies of charge-transfer complexes formed between the highly effective antibiotic drug metronidazole and two types of acceptors: σ- and π-acceptors. Spectrochimica Acta A 2015; 141: 202-10.
42. Belal TS, El-Kafrawy DS, Mahrous MS, Abdel-Khalek MM and Abo-Gharam AH: Validated spectrophotometric methods for determination of sodium valproate based on charge transfer complexation reactions. Spectrochimica Acta A 2016; 155: 47-53.
43. Job P: Advanced Physicochemical Experimental, London, UK: Pitman 1964.
44. Benesi HA and Hildebrand JH: A Spectrophotometric investigation of the interaction of iodine with aromatic hydrocarbons. Journal of the American Chemical Society 1949; 71: 2703-77.
45. Duymus H, Arslan M, Kucukislamoglu M and Zangin M: Charge transfer complex studies between some non-steroidal anti-inflammatory drugs and π-electron acceptors. Spectrochimica Acta A 2006; 65: 1120-24.
46. Refat MS, Ahmed HA, Grabchev I and El-Zayat LA: Spectroscopic and structural characterization of the charge-transfer interaction of N, N′-bis-alkyl derivatives of 1,4,6,8-naphthalenediimide with chloranilic and picric acids. Spectrochimica Acta A 2008; 70: 907-15.
47. Gaballa AS and Amin AS: Preparation, spectroscopic and antibacterial studies on charge-transfer complexes of 2-hydroxypyridine with picric acid and 7,7′,8,8′-tetracyano-p-quinodimethane. Spectrochimca Acta A 2015; 145: 302-12.
48. Leve ABP: Inorganic Electronic Spectroscopy. Elsevier, Amsterdam, Second Edition 1985.
49. Voigt EM and Reid C: Ionization potentials of substituted benzenes and their charge-transfer spectra with tetracyano-ethylene. Journal of the American Chemical Society 1964; 86: 3930-34.
50. Rathore R, Linderman SV and Kochi JK: Charge-transfer probes for molecular recognition via steric hindrance in donor-acceptor pairs. Journal of the American Chemical Society 1997; 119: 3393-04.
51. Briegleb G: Electron affinities of organic molecules. Angewandte Chemie 1964; 76: 326-41.
52. Aloisi GG and Pignataro S: Molecular complexes of substituted thiophens with σ and πacceptors. Charge transfer spectra and ionization potentials of the donors. Journal the Chemical Society, Faraday Transactions 1973; 169: 534-39.
53. McConnel HM, Ham JJ and Platt JR: Regularities in the spectra of molecular complexes. Journal of Chemical Physics 1953; 21: 66-70.
54. Gaber M, El-Morsi MA and Abd-El-Ghafar M: Ionization-potentials and electro-affinities of organic molecules from electron charge-transfer spectra. Journal of the Chemical Society of Pakistan 1988; 10: 125-29.
55. Briegleb G and Czekalla J: Intensity of electron transition bands in electron donator-acceptor complexes. Zeitschrift für Physikalische Chemie (Frankfurt) 1960; 24: 37-54. 56. Person WP: Thermodynamic properties of donor-acceptor
complexes. Journal of the American Chemical Society 1962; 84: 536-40.
57. International Conference on Harmonization of Technical Requirements for Registration of Pharmaceuticals for Human Use. ICH Harmonized Tripartite Guideline, Validation of Analytical Procedures: Text and Methodology, Q2(R1). Complementary Guideline on Methodology dated 06 November 1996, ICH, London 2005.
58. Miller JC and Miller JN: Statistics for Analytical Chemistry. England: Ellis Horwood Ltd., Second Edition 1988.
59. Irving HMNH, Freiser H and West TS: IUPAC Compendium of Analytical NomenCAture DefinitiVe Rules. Oxford: Pergamon Press 1981.
All © 2013 are reserved by International Journal of Pharmaceutical Sciences and Research. This Journal licensed under a Creative Commons Attribution-NonCommercial-ShareAlike 3.0 Unported License.
This article can be downloaded to Android OS based mobile. Scan QR Code using Code/Bar Scanner from your mobile. (Scanners are available on Google Play store)
How to cite this article:
![FIG. 1: ELECTRONIC SPECTRA OF CA, MBz AND [MBz-CA] COMPLEX IN METHANOL](https://thumb-us.123doks.com/thumbv2/123dok_us/8871180.942074/3.612.316.565.108.148/fig-electronic-spectra-ca-mbz-mbz-complex-methanol.webp)
![Table 1. The Kf values are 2.60 × 10, 3.33 × 10and 40.0 × 10³ for the [CA-MBz], [DNSA-MBz] and [PA-MBz] CT complexes, respectively](https://thumb-us.123doks.com/thumbv2/123dok_us/8871180.942074/6.612.53.563.364.724/table-values-mbz-dnsa-mbz-mbz-complexes-respectively.webp)