S P E C I A L I S S U E A R T I C L E
Morphology Analysis of Si Island Arrays on Si(001)
A. Gonza´lez-Gonza´lez•M. Alonso• E. Navarro• J. L. Sacedo´n•A. Ruiz
Received: 27 June 2010 / Accepted: 26 July 2010 / Published online: 11 August 2010 The Author(s) 2010. This article is published with open access at Springerlink.com
Abstract The formation of nanometer-scale islands is an important issue for bottom-up-based schemes in novel electronic, optoelectronic and magnetoelectronic devices technology. In this work, we present a detailed atomic force microscopy analysis of Si island arrays grown by molecular beam epitaxy. Recent reports have shown that self-assembled distributions of fourfold pyramid-like islands develop in 5-nm thick Si layers grown at substrate temperatures of 650 and 750C on HF-prepared Si(001) substrates. Looking for wielding control and understanding the phenomena involved in this surface nanostructuring, we develop and apply a formalism that allows for processing large area AFM topographic images in a shot, obtaining surface orientation maps with specific information on fac-ets population. The procedure reveals some noticeable features of these Si island arrays, e.g. a clear anisotropy of the in-plane local slope distributions. Total island volume analysis also indicates mass transport from the substrate surface to the 3D islands, a process presumably related to the presence of trenches around some of the pyramids. Results are discussed within the framework of similar island arrays in homoepitaxial and heteroepitaxial semi-conductor systems.
Keywords Silicon nanostructuresMolecular beam epitaxySelf-assemblyScanning probe microscopy
Morphology analysis
Introduction
The growth of self-assembled island arrays on semicon-ductor substrates has been reported and analyzed exten-sively because of their high technological interest [1–3]; nevertheless, the exact role of critical factors of the growth process still remains under debate in some relevant material systems. Keeping in mind the device applications, many of the efforts in the last years have been focused to develop processes to control the size, shape and distribution of the nanostructures, often by combining self-assembly and lithography-patterned templates, thus becoming the mor-phology characterization at the nanoscale increasingly important. To carry out a deep analysis of the morphology in nanoscale structures, it is important not only to have adequate probing techniques, but also to access efficient analysis tools in order to extract and exploit the information of the experimental data. We have developed a topographic image processing procedure, based on polynomial interpo-lating functions, with successful applications in the analysis of thin film growth at the nanoscale [4]. We combine here this algorithm with atomic force microscopy (AFM) mea-surements to investigate in detail the morphology of Si islands arrays grown by molecular beam epitaxy (MBE) on HF-treated Si(001) surfaces [5].
We have recently shown [5] that a rich variety of surface morphologies, namely island distributions, ridge networks and pyramidal nanohole arrays, can be produced by homo-epitaxy of thin (5–25 nm) Si layers, under suitable condi-tions of sample preparation (HF-passivation) and film growth. Such nanostructured surfaces are attractive, for instance, as potential templates for the growth of quantum dot arrays. Choosing an appropriate growth conditions window, the surface layer morphology evolves following the ‘‘islands formation?ridges by islands coalescence?two A. Gonza´lez-Gonza´lez (&)M. AlonsoE. Navarro
J. L. Sacedo´nA. Ruiz
Instituto de Ciencia de Materiales de Madrid (ICMM–CSIC), C/Sor Juana Ine´s de la Cruz 3,
dimensional growth’’ path. This sequence ends up in the step-flow growth regime, generating optimum flat mor-phology samples for thick enough (C100 nm) Si layers [5]. Among the nanoscale distributions observed, we find that rather homogeneous arrays of pyramid-like islands can be achieved for 5-nm thick Si layers, in which the size of the entities and the order of their assembly show an acute, though reproducible, dependence on the substrate tempera-ture during growth. These island arrays also exhibit inter-esting similarities with other semiconductor systems, regarding self-ordering, island shapes and sizes [5].
The mechanisms responsible for the formation of these Si pyramids arrays are not yet well established. Provided that mismatch strain is ruled out, which is often ascribed as the cause for 3D growth in the case of heteroepitaxial systems, the origin of this type of nanostructures in homoepitaxy has been generally explained in terms of anisotropic surface fluxes caused, for instance, by step edge barriers [6,7]. Trying to gain insights into the phenomena that play a key role on the formation of these Si island arrays, we have carried out a detailed study of their mor-phology features, in particular island size and facet distri-bution. Taking into account the results presented here, we believe that our formalism should be also useful for the study of other material systems with similar morphological features. Note that two dimensional (2D) distributions of faceted islands, sharing some of the features of the above described Si nanostructure arrays, have been reported [1–3] for quite a few material systems, like for instance Si grown on thin Si1-xCx films [8], selective area epitaxial layers grown on windows opened in thin Si-oxide layers on Si(001) [9,10], Ge/Ge(001) [11] and GaSb/GaSb(001) [12] homoepitaxial layers or Ge and Si1-xGexalloys grown on Si(001) [1–3,13–17].
Experimental
Film Growth and Characterization
The morphology analysis carried out along this work has been performed over AFM images measured in two types of samples. Both of them correspond to Si layers of the same nominal deposited thickness (t=5 nm), grown by MBE on B-doped singular Si(001) single crystals, for which manufacturer specifications warrant a polar angle miscut a B ±0.5. Substrate surfaces are prepared by exposure to the vapor of an aqueous HF solution followed by radiative annealing in ultra-high vacuum. The growth temperature,Tg, denotes here the temperature of the sub-strate surface, once it has been measured at the center of test samples by radiation thermometry and established its correlation to the substrate holder thermocouple reading.
Substrate preparation and film growth conditions have been the same in all cases except for the growth substrate tem-perature, Tg=650 and Tg=750C, respectively. Pre-growth annealing temperature is 10C above the selected Tg. Silicon is deposited from an electron-beam evaporator feedback controlled by electron impact emission spectros-copy flux measurements. Actual growth rates at sample position are calibrated by a quartz crystal thickness monitor and X-ray reflectivity measurements on test samples, using Si growth rates values of 0.25 A˚ /s for the experiments here discussed. Low-energy electron diffraction (LEED), Auger electron spectroscopy (AES) and reflection high-energy electron diffraction (RHEED) are routinely used to provide in situ information on the surfaces of the substrates and deposited layers. For both Tg, the RHEED patterns observed after Si growth showed arrowhead features characteristic of a faceted surface, together with a 291 reconstruction, while the AES spectra indicate clean Si surfaces. Further details on these topics can be found elsewhere [5].
To investigate the surface morphology of the Si/Si(001) samples, ex situ tapping-mode AFM images were recorded, using WSxM software by Nanotec [18]. We use super-sharp silicon tips (nominal tip radius r*2 nm and high aspect ratio*100:1). Lateral resolution is estimated to be better than 4 nm. In addition, we register the images at very low scanning frequencies (0.1–0.4 lines/s) in order to avoid oscillations of the feedback system (or instrumental noise) that could be amplified by the derivative procedure, degrading the reliability of the slope analysis, as suggested in previous works [19].
Local Slope Evaluation Formalism
slope distributions,Nu(m), sometimes referred to as surface orientation maps [20,21]. We define here the (x,y) plane of the map as a polar plot, in which the angular coordinate
u¼tan1ðn
x=nyÞis the azimuth angle of the normal unit vector at each surface point r, and the slope value m is plotted as the radial coordinate. The distribution Nu(m) allows to quantify and compute globally the in-plane orientation of the local slope values of an image as a whole and can be used, for instance, to follow the evolution of particular features of the facets in samples obtained under different experimental conditions (film thickness, substrate temperature during growth,…) [20,21]. The resulting slopes distribution is defined asNðmÞ ¼P2pu¼0NuðmÞ. A Gaussian fitting of the intensity peaks ofN(m) can then be performed, accounting for the relative population of facets as the ratio of their intensity maxima.
Results and Discussion
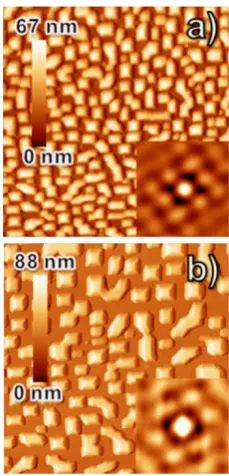
Figure1shows AFM images of the surface morphology of Si layers (t=5 nm) grown at substrate temperatures of Tg=650 (Fig.1a) and Tg=750C (Fig.1b). Let us briefly comment some of the similarities and differences between them. Both surfaces exhibit arrays of 3D islands, which are mostly regular fourfold pyramids with square or rectangular bases, their edges preferentially running along the close-packed Si\110[directions [5]. Occasionally, two or more of these pyramid-like islands have coalesced, mainly along the corners. Representative results of the self-correlation function analysis performed on several AFM images are displayed as insets in Fig.1a and 1b, for the respective sample growth temperature (Tg=650 and Tg=750C). They clearly show that both island arrays exhibit a remarkable degree of order [4], which can be interpreted as indicative of self-assembly or self-organizing processes. We should note, however, that this study was carried out on selected image portions, where we tried to minimize the presence of coalesced island ensembles, because of their disturbing effects.
Significant and reproducible differences between the two sample morphologies are also observed. A simple visual inspection of the AFM images indicates that the number of 3D islands per unit area is higher for Tg=650C (Fig. 1a) than forTg=750C (Fig. 1b), while islands are larger (in height and lateral size) and more separated forTg=750C. Such assessments are confirmed by numerical analyses of many island profiles [5]. If we define now the distance between islands (k) as the mean minimal distance among island centers in each type of array, we have calculated their values, averaging over a large number of AFM images, to bek=280±25 nm for layers grown at Tg=650C and k =475 ±35 nm for
Tg=750C. In order to analyze the slopes of the pyramids lateral facets and their occurrence for the two growth temperatures, local slope maps (see Fig.2a, c) have been produced from the AFM images, and the resulting Nu(m) distributions are plotted in Fig. 2b and d. Data shown in Fig.2 correspond to the AFM images presented in Fig.1. As explained in section ‘‘Local Slope Evaluation Formalism’’, the larger the facet population, the stronger the intensity at the corresponding position in the Nu(m) distribution. The polar plots confirm that most of the island sidewall facets in the arrays lie along the x and yaxes of the surface orientation maps (i.e., along the two orthogonal\110[directions of the Si(001) substrate sur-face), and a noticeable feature of the Nu(m) distributions shown in Fig. 2b and d is their asymmetry.
Let us examine first the results of Si layers grown at Tg=650C (Fig.2b). The behavior along thexandyaxes is clearly asymmetric. Alongx, there are two sharp inten-sity peaks that correspond to the slope (m) values associ-ated with angles of 20({114} facets). A 3D representation (intensity versus x–y positions) of one of these peaks is shown as an inset in Fig.2(upper right panel); its Gaussian fitting is also displayed. Along the yaxis, in contrast, the intensity is not sharply concentrated in a particularmvalue, but appears broadly distributed within the range of 20to 35angles. Therefore, most of the facets along the xaxis are {114}, while alongythere are {114}, {113} and {112} Fig. 1 AFM topography images (595lm2) of Si pyramid-like arrays obtained growing nominally 5-nm thick Si layers on Si(001) substrates at different growth temperatures: a Tg=650C and
bTg=750C. The insets correspond to the respective self-correlation
[image:3.595.367.482.56.295.2]facets present. The slopes of the island facets alongxare then lower than along theyaxis. Still another asymmetry is found analyzing the relative population of each facet type appearing in the AFM image. Adding the intensity observed for a given m value over the whole angular coordinate in theNu(m) distribution, we find that approx-imately 60% of the total intensity corresponds to low slope facets (20, {114}) and only 20% is associated with higher slope facets (25–35 angles, {113}, {112}). The remain-ing 20% corresponds to the diffuse intensity background, lying mainly between the peaks of theNu(m) distribution. Such weak signals do not correspond to well defined island facets, but to the local slope values of rounded corners in the pyramidal islands; see e.g. the slope map of a single island displayed as an inset in Fig.2(middle right panel). The behavior observed for the islands array of Si layers grown at Tg=750C (Fig.2d) is slightly different, although the asymmetry along the x and y axes is also present. Along x, we find again two sharps peaks at the mpositions associated with 20angles, indicating that most of the islands sidewall facets are {114} also in this case. Along theyaxis, as in theTg=650C case, there is certain intensity broadening toward highermvalues (in the range of 20–25angles on one side, and 25–35angles on the
other side). Thus, for bothTg, steeper facets develop along one of the\110[directions. Additionally, island facets are better defined forTg=750C, as demonstrated by the two sharp peaks observed along the y axis, corresponding to angles of 25(i.e., {113} facets) on one side and 35(i.e., {112} facets) on the other side. There is an asymmetry then between opposite sides of the islands as well (along the y axis), being more pronounced for Tg=750C. This is clear in the local slope map displayed at the middle right panel inset of Fig.2, a single pyramidal island zoomed out from Fig.2c. Facet population data indicate that*40% of the total intensity corresponds to {114} facets, and*40% to {113} and {112} facets; therefore, the relative number of high-slope facets in the array is higher for this higherTg value. Moreover, new facets appear for Tg=750C (Fig.2d) at very low-slope values (8). They correspond to {119} planes near the top of the islands, as shown in Fig.2
(middle and lower right panel insets). The formation of these {119} facets is presumably related to the increase in the mean island volume and facet slopes observed at this Tg, when compared to the case of Tg=650C. Consider e.g. the two AFM topographic line-profiles (shown at the lower right inset of Fig. 2) across single representative islands within the arrays produced for each Tg. These profiles, carried out along the fast scan direction, bring to view some of the differences in shape and size of the Si islands for each growth temperature.
It is important to mention that AFM measurements were also carried out for different experimental geometries (e.g. shifting by at least&p/4 relative to the\110[directions the fast and slow scan directions in the AFM), obtaining similar results for facet types and population. We can therefore exclude that the asymmetry observed in the polar orientation maps (Fig.2b, d) could originate in instru-mental artefacts of the AFM measurements. Moreover, neither Si flux inhomogeneity during growth nor substrate miscut can respond for such asymmetry either: the first is ruled out using continuous substrate rotation during growth, while the substrate miscut has been checked to be random and well below specifications by X-ray diffraction azimuthal scans.
‘‘Trench-like’’ features appear near the base of the pyr-amids in the line-profiles of Fig.2. The 3D pictures dis-played in Fig. 3, generated from AFM topography images, also illustrate the presence of these trenches (or depletion regions) around some of the islands for both growth tem-peratures. Trench formation has been reported for island arrays in different material systems, e.g. Ge and Si1-xGex alloys on Si(001), and has often been related to material transport processes from the substrate to the 3D islands [14, 15,22]. Hence, one may wonder whether the asym-metry found in the surface orientation maps of Fig. 2, or the trenches observed in Fig. 3, could be related to similar mass Fig. 2 Local slope maps of the AFM images of Fig.1 for
Tg=650C (a) and Tg=750C (c), and their respectivein-plane
local slope distributions, (b) and (d). The different types of facet planes present in each orientation map are marked schematically by hexagons ((119),*8),squares((114),*20),triangles((113),*25) andopen circles((112),*35); only one from each type is marked. The insets in theright panelshow: the Gaussian fit of a spot of thein
-planelocal slope distribution (upper inset); a zoomed view (taken from (c), Tg=750C) of a single island local slope map, showing
rounded corners connecting facets and with the different facet areas marked (middle inset); topography linescan profiles along two representative pyramids of the AFM images of Fig.1, i.e. produced at Tg=650 and 750C (lower inset); the corresponding pyramids
[image:4.595.54.288.58.245.2]transport phenomena. To investigate this issue, we have estimated the quantity Vpyr, the volume of the islands present in a given AFM image, comparing it withV0, the expected nominal volume of the Si layer deposited. The topographicmoldof the mathematical formalism described in section ‘‘Local Slope Evaluation Formalism’’ was used for such calculations. In the limit of low-slope values (0.1–0.5 angles), the interface volume of a layer is approximated as Vinterface¼PrhrD (being hr the local
height averaged over the pixel area,D). The contribution of the islands toVinterfacewas obtained by a classical flooding procedure. The emergent volume over a flooding plane of height c is defined as Veðr;cÞ ¼PrHðhrcÞðhrcÞD, beingH(x) the Heaviside function.1Then, denoting asc0the height of the substrate surface plane (plane containing the base of the pyramids), different scenarios can be consid-ered.Forc=0,Ve=Vinterface. Forc\c0, a linear decrease inVeis expected, whereas the linearity is lost whenc[c0. Thus,Vpyrcan be obtained after determining thec0value by interpolation of theVe(c) curve.
The plots of the emergent volume (Ve) with the flooding heightcare shown in the left panels of Fig.3for two AFM
images of island arrays grown at Tg=650 (Fig. 3a) and Tg=750C (Fig.3b). The AFM images analyzed, both of the same size (LxLy)=5 95 lm2, are those of Fig. 1
(shown again in the insets of Fig.3). The values of c0 and Vpyrobtained in each case have been marked in the figure. The nominal volume of the deposited Si layers (having a nominal thickness t=5 nm) for a given AFM image is simply calculated as V0=(LxLy)t. Remarkably, such value is significantly lower than the total island volume estimated from the data of Fig.3, and the same occurs for diverse AFM images analyzed and for both substrate temperatures, althoughVpyr-V0is found to be larger for the highestTg. In particular, for the AFM images of Fig.3, we find:V0%0.3VpyrforTg=650C, and V0%0.2Vpyr forTg=750C. Our results indicate that the pyramid-like islands of these arrays are not only formed by the incoming Si flux but also by Si atoms from the Si (001) substrate. Although we do not know yet which are the driving forces neither for the formation of 3D islands in the Si/Si(001) system nor for the mass transport from the substrate surface to the pyramid flanks, it is expected that material transport would be enhanced for higher substrate temperatures, because of the higher mobility of Si atoms. Such assump-tion is in agreement with the stronger effect (higher excess volume) found for Tg=750C relative to Tg=650C. Once accepted that mass flow from the substrate surface to the 3D islands exists, it is reasonable to assume that the trench formation phenomena observed in these Si island arrays are related to the mass transport process. Indeed, the asymmetry in the Nf(m)distributions could also be related to it. For instance, if the transport of the Si atoms from the substrate to the islands is not uniform, facets with different slope values could develop at selected directions. In such case, the asymmetry observed in Fig.2 could be inter-preted as linked to preferential diffusion along one partic-ular\110[direction. A complex combination of physical phenomena may stand behind the nucleation of finite size 3D nuclei in epitaxial growth, such as surface reactivity, growth kinetics, thermal stability or stress. There is a wide variety of materials reported, grown under rather hetero-geneous conditions, in which extremely similar patterns develop, but identical morphologies may originate in diverse systems with excluding physical mechanisms. Even just during post-growth annealing, asymmetric surface-mediated alloying processes (a complex combination of mass transport, trench formation and diffusion anisotropy) has been pointed out in the Si-Ge system to produce asymmetric island shapes and composition profiles, leading to larger slope facets in one of the island sides [23,24].
The formation of the pyramid arrays during homoepit-axial growth carried out under quasi-optimal (high adatom mobility) conditions, such as the samples analyzed here, is still an intriguing issue. Further experiments are needed to Fig. 3 Left: island volume analysis for the pyramid arrays of Fig.1,
corresponding to nominally 5-nm thick Si layers grown at a Tg=650C and b Tg=750C on Si(001). Emergent volume
versus flooding plane height, Ve vs. c, computed through the
595lm2images of Fig.1(also shown in the insets). Marked on the plots axes are the nominal deposited volume, V0, (continuous line), same value in both plots; the total pyramids volume,Vpyrand
the base plane height, c0, for each Tg (dashed lines). Right: 3D
pictures generated from AFM topography images of the island arrays produced at each Tg, in order to highlight the trench formation
phenomena.Note the different size of the two images: 191lm2for
Tg=650C and 393lm2forTg=750C
1 H(x)=0 forx
[image:5.595.52.288.58.261.2]identify the origin of these large-scale arrays in order to achieve full control of the phenomena involved and be able to customize the nanostructuring of the substrate. To help in those future experiments, the exhaustive analysis of surface morphology images possible through the formalism used along this work will certainly provide valuable global information, thus becoming an efficient tool for the investigation of the leading mechanisms involved.
Conclusions
In summary, we have shown that the image processing procedures presented here are useful tools to perform sta-tistical analysis over large area AFM images of nano-structures arrays and may be of valuable application in the study of self-assembling systems and processes. Using them along this work to analyze Si pyramid arrays grown by MBE at two different substrate temperatures, we have shown the occurrence of a remarkable asymmetry in the in-plane distributions of lateral facets and their relative pop-ulation along two orthogonal\110[directions. A detailed study of the different distributions found for each substrate temperature during growth is presented. Results also sug-gest transport of material from the substrate surface to the 3D islands, a process presumably related to the presence of trenches around some of the pyramids.
Acknowledgments Work has been financed by the Spanish Science and Innovation Ministry (MICINN) through projects MAT2007-66719-C03-02 and MAT2008-06765-C02-02. A. Gonza´lez–Gonza´lez and E. Navarro acknowledge the support of the Spanish MICINN under project no. ESP2006-14282-C02-02 and through FPI grants, respectively.
Open Access This article is distributed under the terms of the Creative Commons Attribution Noncommercial License which per-mits any noncommercial use, distribution, and reproduction in any medium, provided the original author(s) and source are credited.
References
1. I. Berbezier, A. Ronda, Surf Sci. Rep.64, 47 (2009)
2. J. Stangl, V. Holy, G. Bauer, Rev. Modern Phys.76, 725 (2004) 3. C. Teichert, Phys. Rep.365, 335 (2002)
4. A. Gonza´lez-Gonza´lez, J.L. Sacedo´n, C. Polop, E. Rodrı´guez-Can˜as, J.A. Azna´rez, E. Vasco, J. Vac. Sci. Technol. A27, 1012 (2009)
5. N. Galiana, P.P. Martin, C. Munuera, M. Varela, C. Ocal, M. Alonso, A. Ruiz, Mat. Sci. Semicond. Process12, 52 (2009) 6. M. Siegert, Phys. Rev. Lett.81, 5481 (1998)
7. D.C. Vernon, M. Siegert, M. Plischke, Phys. Rev. B.59, 15523 (1999)
8. J. Zhu, J.G. Ekerdt, J. Crystal Growth261, 479 (2004) 9. A.A. Shklyaev, M. Ichikawa, Phys. Rev. B65, 45307 (2001) 10. L.H. Nguyen, C. Renard, V. Yam, F. Fossard, D. De´barre,
D. Bouchier, Superlattices Microstruct.44, 348 (2008) 11. K.A. Bratland, Y.L. Foo, J.A.N.T. Soares, T. Spila, P. Desjardins,
J.E. Greene, Phys. Rev. B67, 125322 (2003)
12. B.Z. Nosho, B.R. Bennett, E.H. Aifer, M. Goldenberg, J. Crystal Growth236, 155 (2002)
13. B. Voigtla¨nder, Surf Sci. Rep.43, 127 (2001)
14. U. Denker, O. Schmidt, N.-Y.-J. Philipp, K. Eberl, Appl. Phys. Lett78, 3723 (2001)
15. T. Merdzhanova, S. Kiravittaya, A. Rastelli, M. Stoffel, U. Denker, O.G. Schmidt, Phys. Rev. Lett.96, 226103 (2006) 16. J.A. Floro, G.A. Lucadamo, E. Chason, L.B. Freund, M. Sinclair,
R.D. Twesten, Q. Hwang, Phys. Rev. Lett.80, 4717 (1998) 17. J.A. Floro, G.A. Lucadamo, E. Chason, L.B. Freund, M. Sinclair,
R.D. Twesten, Q. Hwang, Phys. Rev. B.59, 1990 (1999) 18. I. Horcas, R. Fernandez, J.M. Gomez-Rodriguez, J. Colchero,
J. Gomez-Herrero, A.M. Baro´, Rev. Sci. Instrum. 78, 013705 (2007)
19. E. Palacios-Lido´n, L. Guanter, J. Zu´n˜iga-Pe´rez, V. Mun˜oz-SanJose´, J. Colchero, Small3, 474 (2007)
20. B. Sanduijav, D. Matei, G. Chen, G. Springholz, Phys. Rev. B80, 125329 (2009)
21. A. Rastelli, H. von Ka¨nel, Surf. Sci. Lett.515, L493 (2002) 22. S.A. Chaparro, Y. Zhang, J. Drucker, Appl. Phys. Lett.76, 3534
(2000)
23. U. Denker, A. Rastelli, M. Stoffel, J. Tersof, G. Katsaros, G. Costantini, K. Kern, N.Y. Jin-Phillipp, D.E. Jesson, O.G. Schmidt, Phys. Rev. Lett.94, 216103 (2005)