Munich Personal RePEc Archive
The Full Value of the Nobel Prize - Part
1: Mining “Data Without Theory”
Amavilah, Voxi Heinrich
REEPS, REEPS GCC
17 September 2011
1
For a partial list of “Famous Trophies and Awards” see
http://www.mickeys.net/hi-famous-trophies.htm. Robert Finn’s “Eponymous Prizes Honor Scientists, But
(
(
(
(
(REEP
S
)
)
)
)
)
R
esource &E
ngineeringE
conomicsP
ublicationsS
ervicesThe Knowledge Peddlers
______________________________________________________________________________
The Full Value of the Nobel Prize - Part 1: Mining “Data Without Theory
”
Voxi Heinrich Amavilah REEPS
PO Box 38061
Phoenix, AZ 85069-8061 USA
+++++++++++++++++++++++++++++++++++++++++++++++++++++++++++++++++++++
Abstract: This paper comes in two parts, this being the first. Part 1 is not a research paper in the sense of the Scientific Method; it is rather unsophisticated data mining - a cheap data mining exercise for that matter, because it does not follow any received economic, or other, theory. In the sense of Ed E. Leamer, it is “data without theory,” and data without theory does not speak for itself, despite the common cliché of “letting the data speak for itself.” The objective here is to adjust the money value of the Nobel Prize to include the values of the Nobel Prize medal and diploma. It is an arithmetic exercise that reveals that Alfred Nobel’s monetary contribution to humanity is huge. More importantly, the calculations generate data that make it possible to focus on the economic implications of Nobel’s bequest for human capital accumulation, technological progress, and long-run economic growth, which are subjects of a separate effort in Part 2. In this “paper” I indicate some basic relationships among and between key variables in Section 4, and remark in the last section that the Nobel Prize is a massive contribution, even without taking into account the time value of money. For instance, the unadjusted value of the Economics Nobel Prize in 1969 awarded to Ragnar Frisch and Jan Tinbergen was only 2.92 million SEK (US$0.57 million), but adjusted for the medal and diploma values the award was 5.85 million SEK (US$1.14 million).
Keywords: Nobel Prize full value, Nobel Prize and human development, nobel prize and human capital, Nobel Prize and technological change, Nobel Prize and economic performance. JEL Code: Y1, C80, D60, D83, O15, O43
+++++++++++++++++++++++++++++++++++++++++++++++++++++++++++++++++++++
1. Introduction
Although not the largest in monetary terms, the Nobel Prize ranks high among the most
prestigious recognitions in the world.1 In Physics, Chemistry, Physiology or Medicine, Literature,
2
Throughout this exercise I use the word full to capture simultaneously the arithmetic sense of
completeness as well as the economic sense of reality.
for two reasons. For scientists, it recognizes their untiring efforts which lead to new fields of discovery, and places them in the annals of history with other notable scientists. For science, the Prize inspires the people of the world about the importance and value of new discoveries, and in so doing science becomes better appreciated and supported by the public, and , hopefully, by governments” (p.2). This interpretation is consistent with Alfred Nobel’s will that “... interest capital invested in safe securities ... be annually distributed in the form of prizes to those who, during the preceding year, shall have conferred the greatest benefit to mankind”
(http://nobelprize.org/nobel_organizations/nobelfoundation/statutes.html).
Qualitatively each Nobel Prize laureate represents a contribution to humanity – at least in the eyes of the Prize awarding institutions. Quantitatively, however, it is still an open question about what the cumulative benefit of the Nobel Prize to “mankind” is to-date. To answer that question in a substantial way one has to know the full value, not just the partial value, of the Nobel Prize.2
Figuring out the full value of the Prize is largely a subjective undertaking. For example, the 2009 Nobel Peace Prize awarded to the U.S. President Barrack Obama raised a number of illustrative issues relating to the real value of the award. One, some people thought President Obama did not meet Alfred Nobel’s requirement, and therefore giving him the Prize somehow reduced the full value of the Nobel Prize in general. Second, others evaluate Nobel Prizes differently depending on the prize category. The full value of the “Economics Nobel Prize,” for instance, has been questioned for a while now. Part of the skepticism stems from the fact that the official Swedish name for the Nobel Prize in Economics, The Sveriges Riksbank pris I ekonomisk vetenskap till Alfred Nobels minne, has been translated variously in English since it was first awarded in 1969 as Table 1 below shows.
[image:3.612.68.544.447.648.2]____________________
Table 1 - Various names for the “Economics Nobel Prize” over the Years
Year English translation of official name
1969-1970 Prize in Economic Science Dedicated to the Memory of Alfred Nobel
1971 Prize in Economic Science
1972 Bank of Sweden Prize in Economic Sciences in Memory of Alfred Nobel
1973-1975 Prize in Economic Science in Memory of Alfred Nobel
1976-1977 Prize in Economic Sciences in Memory of Alfred Nobel
1978-1981 Alfred Nobel Memorial Prize in Economic Sciences
1982 Alfred Nobel Memorial Prize in Economic Science
Year English translation of official name
3
Professors William Vickery and F.A. von Hayek received the Economics Nobel Prize in 1996 and 1974, respectively.
1984-1990 Alfred Nobel Memorial Prize in Economic Sciences
1991 Sveriges Riksbank (Bank of Sweden) Prize in Economic Sciences in Memory of Alfred Nobel
1992-2005 Bank of Sweden Prize in Economic Sciences in Memory of Alfred Nobel
2006-Present The Sveriges Riksbank Prize in Economic Sciences in Memory of Alfred Nobel
Source: http://en.wikipedia.org/wiki/Nobel_Memorial_Prize_in_Economic_Sciences. ____________________
As one of its ferocious critics, Peter Soderbaum (2010) has argued that “Nobel economics” is nothing but a neoclassical ideology cloaked in value-free pretense while its principal goal is to understand human values and the values human beings put on the things they do – their behavior and activities. He charges that the monopoly of neoclassical economics is a danger that must be abandoned or changed to reflect both competing and complementary alternatives, and he firmly concludes that there is no reason for rewarding monopoly because economic theory admits that monopolies are inefficient and sometimes even unfair (cf. Hazel Henderson, 2004). Soderbaum’s critique, however, does not take into account the Nobel Prize awarded to Gunnar Myrdal, for example, whose work clearly acknowledges the role of value-judgment in economic research, and has articulated that view in his
Objectivity in Social Research (1969).
Criticisms against the value of the “Economics Nobel Prize,” and whether there should even be a Nobel Prize for Economics, have been confounded by events within and outside the profession itself. From within even some Nobel winners like William Vickery and F.A. Hayek doubt the cumulative effects of economics in general, and its significance to human welfare particularly.3 Cassidy (1996),
4
For a list of those years see http://nobelprize.org/nobel_prizes/nobelprize_facts.html. However, since the money was available, I argue the investment was fully made.
hostilities around the world, or physiology and medicine are for the failure to end HIV/AIDS. Thus, the calls for the abolition of the Economics Nobel Prize are unreasonable if they were based on that ground alone.
Before getting too excited, let us reset. This essay is not a research essay in the sense of Scientific Method. It is rather a data mining exercise - generating “data without theory” as Ed Leamer (1983, 1995) would have said. It is however not an aimless exercise; its immediate objective is to calculate the full value of the Nobel Prize. The calculations, and especially the information they generate, can then be used to assess the impact of the Nobel Prize on human welfare, which was Alfred Nobel’s original intention. Again, I cannot possibly accomplish all that in this paper. Instead, Section 2 below describes the Nobel Prize partial money value across eligible categories over time. In subsequent sections I try to calculate the values of the Nobel medal and diploma, and add the results to the full value of the Economics Nobel Prize as an illustration. In the end I speculate about stylized channels through which prizes like the Nobel Prize can affect human capital accumulation, technological change, and long-run economic growth. This theoretical speculation is followed by a concluding remark in the last section, which will also form the beginning of Part 2 of this exercise.
2. The Timeless Money Value of the Nobel Prize
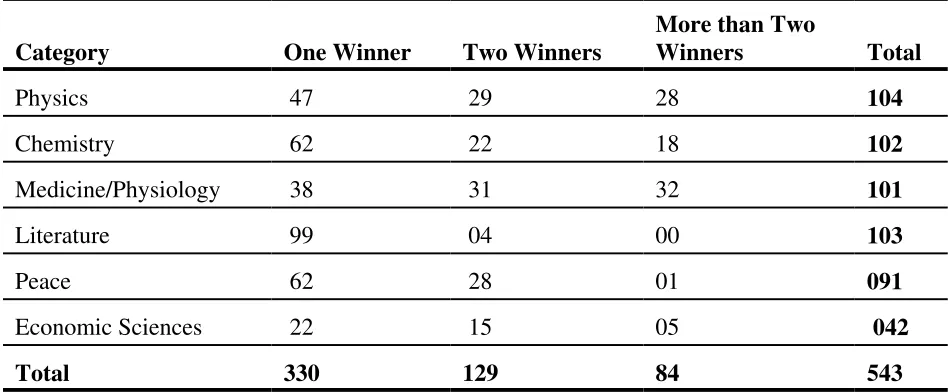
The money amount of the Nobel Prize that one often hears about is a partial, not full, value of the Nobel Prize. Nobel Prize winners also receive medals and diplomas. But first things first. Table 2 presents basic statistics about the number of times the Nobel Prize has been awarded since 1901. Only on fifty occasions was the Nobel Prize not awarded, and most of those occasions were during war years.4 In total the Nobel Prize has been given 543 times to 813 individual and 20 organizations
its debut. The five original (real) Nobel Prize categories (Physics, Chemistry, Literature, Medicine/Physiology, and Peace) have received the most prizes most times, with the Peace category ranking lowest in that group. Economic Sciences have received the fewest prizes, but that is because it was only added as a category in 1969. The table reveals that in Literature the ratio of individual winners to multiple winners is 25:1, while in Chemistry it is 2:1. There are more multiple winners in Physics than individual winners, whereas for Medicine/Physiology and Economic Sciences the ratios are just about even.
5
[image:6.612.66.542.97.293.2]An individual money award is equally shared by the winners in that category.
Table 2- Number of Times the Nobel Prize Has Been Awarded Since 1901
Category One Winner Two Winners
More than Two
Winners Total
Physics 47 29 28 104
Chemistry 62 22 18 102
Medicine/Physiology 38 31 32 101
Literature 99 04 00 103
Peace 62 28 01 091
Economic Sciences 22 15 05 042
Total 330 129 84 543
D a t a S o u r c e: h t t p : / / n o b e l p r i z e . o r g / f a q / n o b e l _ p r i z e . h t m l , a n d
http://nobelprize.org/nobel_prizes/nobelprize_facts.html.
____________________
exempt from any intellectual influences, are usually the slaves of some defunct economist” (Keynes, 1936, p. 383).
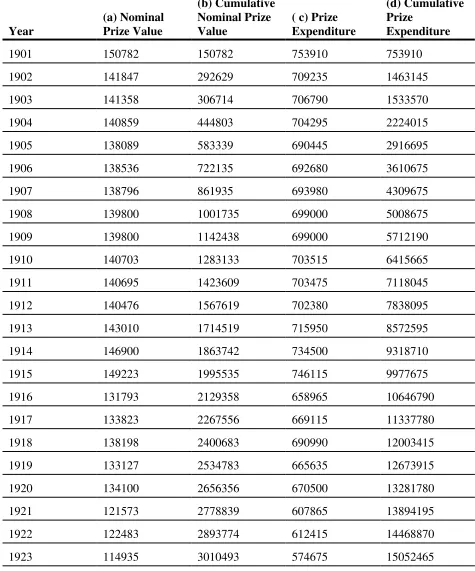
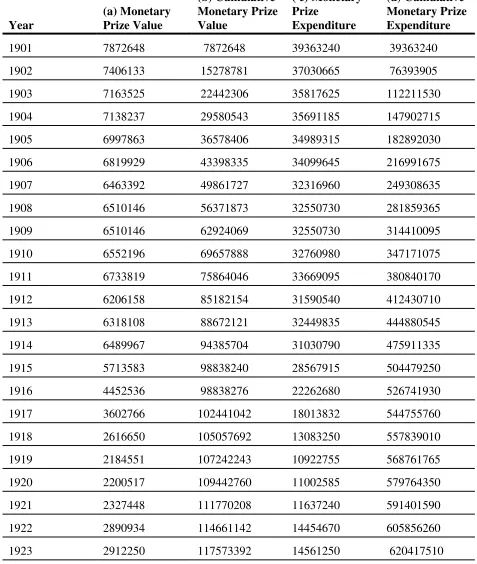
The next set of tables characterize the monetary value of the Nobel Prize since its inception. Column 2 of Table 3 shows the nominal value of an individual award in Swedish Kronors (SEK).5 For
example, in 1901 a winner received 150,782 SEK, which is an equivalent of 7.9 million in 2009 SEK (Column 2 of Table 4). In other words, the 0.151 million SEK awarded in 1901 cumulated to 219.8 million by 2010 in 2009 SEK. For additional perspective, the Nobel Prize-awarding body spent 60 million SEK on awards in 1901 and 1.32 billion SEK cumulatively by 2010. On a per capita basis there are very few countries around the world that have spent that much money on a single source of human capital accumulation.
Table 3 - Money Value of Nobel Prize, SEK – 1901-2010
Year
(a) Nominal Prize Value
(b) Cumulative Nominal Prize Value
( c) Prize Expenditure
(d) Cumulative Prize
Expenditure
1901 150782 150782 753910 753910
1902 141847 292629 709235 1463145
1903 141358 306714 706790 1533570
1904 140859 444803 704295 2224015
1905 138089 583339 690445 2916695
1906 138536 722135 692680 3610675
1907 138796 861935 693980 4309675
1908 139800 1001735 699000 5008675
1909 139800 1142438 699000 5712190
1910 140703 1283133 703515 6415665
1911 140695 1423609 703475 7118045
1912 140476 1567619 702380 7838095
1913 143010 1714519 715950 8572595
1914 146900 1863742 734500 9318710
1915 149223 1995535 746115 9977675
1916 131793 2129358 658965 10646790
1917 133823 2267556 669115 11337780
1918 138198 2400683 690990 12003415
1919 133127 2534783 665635 12673915
1920 134100 2656356 670500 13281780
1921 121573 2778839 607865 13894195
1922 122483 2893774 612415 14468870
Year
(a) Nominal Prize Value
(b) Cumulative Nominal Prize Value
( c) Prize Expenditure
(d) Cumulative Prize
Expenditure
1924 116719 3128658 583595 15643290
1925 118165 3245618 590825 16228090
1926 116960 3372119 584800 16860595
1927 126501 3529058 632505 17645290
1928 156939 3701818 784695 18509090
1929 172760 3874765 863800 19373825
1930 172947 4047971 864735 20239855
1931 173206 4219724 866030 21098620
1932 171753 4390056 858765 21950280
1933 170332 4552664 851660 22763320
1934 162608 4712581 813040 23562905
1935 159917 4872431 799585 24362155
1936 159850 5030894 799250 25154470
1937 158463 5185971 792340 25929855
1938 155077 5334793 775385 26673965
1939 148822 5473363 744110 27366815
1940 138570 5604859 692850 28024295
1941 131496 5736750 657480 28683750
1942 131891 5860441 659455 29302205
1943 123691 5982282 618455 29911410
1944 121841 6103615 609205 30518075
1945 121333 6225139 606665 31125695
1946 121524 6371254 607620 31856270
1947 146115 6531027 730575 32655135
Year
(a) Nominal Prize Value
(b) Cumulative Nominal Prize Value
( c) Prize Expenditure
(d) Cumulative Prize
Expenditure
1949 156290 6851621 781450 34258105
1950 164304 7019233 821520 35096165
1951 167612 7190368 838060 35951840
1952 171135 7365661 855675 36828305
1953 175293 7547308 876465 37736540
1954 181647 7737522 908235 38687610
1955 190214 7937645 951070 39688225
1956 200123 8146274 1000615 40731370
1957 208629 8366952 1040615 41834769
1958 214559 8592939 1072795 42964695
1959 220678 8843172 1103390 44215860
1960 225987 9100392 1129935 45501960
1961 250233 9357612 1251165 46788060
1962 257220 9622612 1286100 48113060
1963 265000 9895612 1325000 49478069
1964 273000 10177612 1365000 50888060
1965 282000 10477612 1410000 52388060
1966 300000 10797612 1500000 53988060
1967 320000 11147612 1600000 55738060
1968 350000 11522612 1750000 57613060
1969 375000 11922612 2250000 71535672
1970 400000 12372612 2400000 74235672
1971 450000 12852612 2700000 77115672
1972 480000 13362612 2880000 80175672
Year
(a) Nominal Prize Value
(b) Cumulative Nominal Prize Value
( c) Prize Expenditure
(d) Cumulative Prize
Expenditure
1974 550000 14542612 3300000 87255672
1975 630000 15223612 3780000 91341672
1976 681000 15923612 4086000 95541672
1977 700000 16648612 4200000 99891672
1978 725000 17448612 4350000 104691672
1979 800000 18328612 4800000 109971672
1980 880000 19328612 5280000 115971672
1981 1000000 20478612 6000000 122871672
1982 1150000 21978612 6900000 131871672
1983 1500000 23628612 9000000 141771672
1984 1650000 25428612 9900000 152571672
1985 1800000 27428612 10800000 164571672
1986 2000000 29603612 12000000 177621672
1987 2175000 32103612 13050000 192621672
1988 2500000 35103612 15000000 210621672
1989 3000000 39103612 18000000 234621672
1990 4000000 45103612 24000000 270621672
1991 6000000 51603612 36000000 309621672
1992 6500000 58303612 39000000 349821672
1993 6700000 65303612 40200000 391821672
1994 7000000 72503612 42000000 435021672
1995 7200000 79903612 43200000 479421672
1996 7400000 87403612 44400000 524421672
1997 7500000 95303612 45000000 571821672
Year
(a) Nominal Prize Value
(b) Cumulative Nominal Prize Value
( c) Prize Expenditure
(d) Cumulative Prize
Expenditure
1999 7900000 110803612 47400000 664821672
2000 9000000 119803612 54000000 718821672
2001 10000000 129803612 60000000 778821672
2002 10000000 139803612 60000000 838821672
2003 10000000 149803612 60000000 898821672
2004 10000000 159803612 60000000 958821672
2005 10000000 169803612 60000000 1018821672
2006 10000000 179803612 60000000 1078821672
2007 10000000 189803612 60000000 1138821672
2008 10000000 199803612 60000000 1198821672
2009 10000000 209803612 60000000 1258821672
2010 10000000 219803612 60000000 1318821672
Note: (a) is the nominal amount awarded to each winner that year; (b) is cumulative (a); ( c) is (a) times the number of categories that won that year (There were five categories until 1968 and six categories from 1969 onwards.); and (d) is cumulative ( c)
Table 4 - Monetary Value of Nobel Prize in 2009 SEK – 1901-2010
Year
(a) Monetary Prize Value
(b) Cumulative Monetary Prize Value
( c) Monetary Prize
Expenditure
(d) Cumulative Monetary Prize Expenditure
1901 7872648 7872648 39363240 39363240
1902 7406133 15278781 37030665 76393905
1903 7163525 22442306 35817625 112211530
1904 7138237 29580543 35691185 147902715
1905 6997863 36578406 34989315 182892030
1906 6819929 43398335 34099645 216991675
1907 6463392 49861727 32316960 249308635
1908 6510146 56371873 32550730 281859365
1909 6510146 62924069 32550730 314410095
1910 6552196 69657888 32760980 347171075
1911 6733819 75864046 33669095 380840170
1912 6206158 85182154 31590540 412430710
1913 6318108 88672121 32449835 444880545
1914 6489967 94385704 31030790 475911335
1915 5713583 98838240 28567915 504479250
1916 4452536 98838276 22262680 526741930
1917 3602766 102441042 18013832 544755760
1918 2616650 105057692 13083250 557839010
1919 2184551 107242243 10922755 568761765
1920 2200517 109442760 11002585 579764350
1921 2327448 111770208 11637240 591401590
1922 2890934 114661142 14454670 605856260
Year
(a) Monetary Prize Value
(b) Cumulative Monetary Prize Value
( c) Monetary Prize
Expenditure
(d) Cumulative Monetary Prize Expenditure
1924 2957453 120530845 14787265 635204775
1925 2950700 123481545 14753500 649958275
1926 3007792 126489337 15038960 664997235
1927 3302443 129791780 16512215 681509450
1928 4097059 134888839 20485295 701994745
1929 4510083 139398922 22550415 724545160
1930 4656058 144054980 23280290 747825450
1931 4813451 148868331 24067255 771892705
1932 4851318 153719649 24256590 796149295
1933 4974272 158693921 24817136 1044320655
1934 4748705 163442626 23743525 1068064180
1935 4592283 168034909 22961415 1091025595
1936 4515107 172550016 22575535 1113601130
1937 4333837 176883853 21669185 1135270315
1938 4174964 181058817 20874820 1156145135
1939 3885156 184943973 19425780 1175570915
1940 3226434 188170407 16132170 1191703085
1941 2697233 191867740 13486165 1205189250
1942 2524980 194392720 12624900 1217814150
1943 2316517 196709237 11582585 1229396735
1944 2306946 199016183 11534730 1240931465
1945 2297327 201313510 11486635 1252418100
1946 2300943 203614453 11504715 1263922815
Year
(a) Monetary Prize Value
(b) Cumulative Monetary Prize Value
( c) Monetary Prize
Expenditure
(d) Cumulative Monetary Prize Expenditure
1948 2809070 209101780 14045350 1291359450
1949 2692877 211794657 13464385 1304823835
1950 2802929 214597586 14014645 1318838400
1951 2468337 217065923 12341685 1331180165
1952 2340203 219406126 11701015 1342881180
1953 2359608 221765734 11798040 1354679220
1954 2426184 224191818 12130920 1366810140
1955 2464201 226656019 12321005 1379131145
1956 2480661 229136680 12403305 1391534450
1957 2479088 231615768 12395440 1403929890
1958 2432139 234047907 12160695 1416090585
1959 2485152 236533059 12425760 1428516345
1960 2448903 238981962 12244516 1440760861
1961 2645101 241627063 13225505 1453986366
1962 2607000 244234063 13035000 1467021366
1963 2609114 246843177 13045570 1480066936
1964 2598779 249441956 12993895 1493060831
1965 2557295 251999251 12786475 1505847306
1966 2558911 254558162 12794555 1518641861
1967 2613081 257171243 13065405 1531707266
1968 2804884 259976127 14024420 1545731686
1969 2923643 262899770 17541858 1563273544
1970 2920339 265820109 17522034 1580795578
Year
(a) Monetary Prize Value
(b) Cumulative Monetary Prize Value
( c) Monetary Prize
Expenditure
(d) Cumulative Monetary Prize Expenditure
1972 3074498 271947166 18446988 1617557920
1973 3061777 272008943 18370662 1635928582
1974 2998892 278007835 17993352 1653921934
1975 3128213 281136048 18769278 1672691212
1976 3071631 284207679 18429786 1691120998
1977 2831221 286871165 16987326 1708108324
1978 2663486 289616982 15980916 1724089240
1979 2745817 292272394 16474902 1740564142
1980 2655412 294964582 15932472 1756496614
1981 2692188 297815589 16153128 1772649742
1982 2851007 301229724 17106042 1789755784
1983 3414135 304705213 20484810 1810240594
1984 3475389 308237559 20852934 1831093528
1985 3532346 312003679 21194076 1852287604
1986 3766120 315931902 21194076 1873481680
1987 3928223 320200980 22596720 1896078400
1988 4269078 325018315 25614468 1921692868
1989 4817335 330832349 28904010 1950596878
1990 5816034 338803051 34896204 1985493082
1991 7970702 347242765 47824212 1990275494
1992 8439714 355553852 50638284 2040913778
1993 8311087 364053500 49866522 2090780300
1994 8499648 372579686 50997888 2141778188
Year
(a) Monetary Prize Value
(b) Cumulative Monetary Prize Value
( c) Monetary Prize
Expenditure
(d) Cumulative Monetary Prize Expenditure
1996 8721067 390097544 52326402 2245261706
1997 8796801 399023788 52780806 2298042512
1998 8926244 408258320 53557464 2351599976
1999 9234532 418672692 55407192 2407007168
2000 10414372 429971053 62486232 2469493430
2001 11298361 441030103 67790166 2537283596
2002 11059050 451880229 66354300 2603637896
2003 10850126 462689514 65100756 2668738652
2004 10809285 473451538 64855710 2733594362
2005 10762024 483989764 64572144 2798166506
2006 10538226 494172979 63229356 2861395862
2007 10183215 504266711 61099290 2922495152
2008 10093732 514449139 60562392 2983057544
2009 10182428 524720262 61094568 3044152112
2010 10271123 528918024 61626738 3105778850
Note: (a) is the prize awarded in 2009 SEK; (b) is cumulative (a); ( c) is (a) times the categories that won that year (There were five categories until 1968 and six categories from 1969 onwards.); and (d) is cumulative ( c).
Data Source: http://nobelprize.org/nobel_prizes/about/prize_amounts_11.pdf.
_______________________________________
3. The Timeless Value of the Nobel Prize by Major Components with Emphasis on Economics
3.1 Partial Money Value of the Nobel Prize (v1)
Table 5 - The Economics Nobel Prize, 1969 - 2010
Nobel Year Nobel Laureate Nobel Citation Nobel Lecture
1969 Ragnar. Frisch
Tinbergen, Jan
“for having developed and applied dynamic models for the analysis of economic processes”
The Use of Models: Experience and Prospects From Utopian Theory to Practical Applications: The case of Econometrics
1970 Samuelson, Paul “for the
scientific work through which he has developed static and dynamic economic theory and actively contributed to raising the level of analysis in economic science” Maximum Principles in Analytical Economics
1971 Kuznets, Simon “For his
empirically founded
Nobel Year Nobel Laureate Nobel Citation Nobel Lecture
1972 Hicks, John
Arrow, Kenneth “for their pioneering contributions to general economic equilibrium theory and welfare theory” The Mainspring of Economic Growth General Economic Equilibrium: Purpose, Analytic Techniques, Collective Choice 1973 Leontief, Wassily “for the development of the input-output method and for its application to important economic problems”
Structure of the World Economy
1974 Myrdal, Gunnar
Hayek, Friedrich
“for their
pioneering work in the theory of money and economic fluctations and for their penetrating analysis of the interdependence of economic, social and institutional phenomena” The Equality Issue in World Development
The Pretence of Knowledge
Nobel Year Nobel Laureate Nobel Citation Nobel Lecture Leonid Koopmans, Tjalling “for their contributions to the theory of optimum allocation of resources” Economics: Achievements, Difficulties, Perspectives Concepts of Optimality and Their Uses 1976 Friedman, Milton “for his achievements in the fields of consumption analysis, monetary history and theory and for his demonstration of the complexity of stabilisation policy” Inflation and Unemployment
1977 Ohlin, Bertil
Meade, James
“for their pathbreaking contribution to the theory of international trade and international capital movements”
1933 and 1977 -Some Expansion Policy Problems in Cases of Unbalanced Domestic and International Economic Relations
The Meaning of "Internal
Balance"
1978 Simon, Herbert “for his
pioneering research into the decision-making
Nobel Year Nobel Laureate Nobel Citation Nobel Lecture
process within economic organizations”
Organizations
1979 Schultz,
Theodore
Lewis, W. Arthur
“for their pioneering research into economic development research with particular consideration of the problems of developing countries”
The Economics of Being Poor
The Slowing Down of the Engine of Growth
1980 Klein, Lawrence “for his creation
of econometric models and the application to the analysis of economic fluctuations and economic policies”
Some Economic Scenarios for the 1980's
1981 Tobin, James “for his analysis
of finacial markets and their relations to expenditure decisions, employment, production and prices”
Money and Finance in the Macro-Economic Process
1982 Stigler, George “for his seminal
Nobel Year Nobel Laureate Nobel Citation Nobel Lecture industrial structures, functioning of markets and causes and effects of public regulation”
Economics
1983 Dbreu, Gerard “for having
incoporated new analytical methods into economic theory and for his rigorous
reformulation of the theory of general equilibrium”
Economic Theory in the Mathematical Mode
1984 Stone, Ruichard “for having
made
fundamental contributions to the development of systems of national accounts and hence greatly improved the basis for empirical economic analysis”
The Accounts of Society 1985 Modigliani, Franco “For his pioneering analyses of saving and of financial markets”
Life Cycle, Individual Thrift and the Wealth of Nations
1986 Buchanan,
James
“for his
Nobel Year Nobel Laureate Nobel Citation Nobel Lecture
the contractual and
constitutional bases for the theory of economic and political decision-making” of Economic Policy
1987 Solow, Robert “for his
contributions to the theory of economic growth”
Growth Theory and After
1988 Allais, Maurice “for his
pioneering contributions to the theory of markets and efficient utilization of resources”
An Outline of My Main Contributions to Economic Science 1989 Haavelmo, Trygve “for his clarification of the probability theory foundations of econometrics and his analyses of simultaneous economic structures”
Nobel Year Nobel Laureate Nobel Citation Nobel Lecture
Prices with and without
Negative Holdings
1991 Coase, Ronald “for his
discovery and clarification of the significance of transction costs and property rights for the institutional structure and functioning of the economy” The Institutional Structure of Production
1992 Becker, Gary “for having
extended the domain of microeconomic analysis to a wide range of human behaviour and interaction, including non-market behaviour” The Economic Way of Looking at Life
1993 Fogel, Robert “for having
Nobel Year Nobel Laureate Nobel Citation Nobel Lecture
North, Douglas
institutional change”
Policy
Economic Performance through Time
1994 Harshanyi, John
Nash, John
Selten, Reinhard
“for their pioneering analysis of equilibria in the theory of non-cooperative games”
Games with Incomplete Information
Acceptance speech:
http://www.yout ube.com/watch? v=w5ToctbuBtc
Multistage Game Models and Delay Supergames
1995 Lucas, Jr.,
Robert
“for having developed and applied the hypothesis of rational expectations, and thereby having transformed macreconomic analysis and deepened our understanding of economic
policy”
Nobel Year Nobel Laureate Nobel Citation Nobel Lecture
1996 Mirrlees, James
Vickery, William “for their fundamental contributions to the economic theory of incentives under asymmetric information” Information and Incentives: The Economics of Carrots and Sticks Procuring Universal Service: Putting Auction Theory to Work
1997 Merton, Robert
Scholes, Myron
“for a new method to determine the value of derivatives” Applications of Option-Pricing Theory: Twenty-Five Years Later
Derivatives in a Dynamic Environment
1998 Sen, Amartya “for his
contributions to welfare
economics”
The Possibility of Social Choice
1999 Mundell, Robert “for his analysis
of monetary and fiscal policy under different exchange rate regimes and his analysis of optimum currency areas”
A
Nobel Year Nobel Laureate Nobel Citation Nobel Lecture 2000 Heckman, James McFadden “for his development of theory and methods for analyzing selective samples” “for his development of theory and methods for analyzing discrete choice” Microdata, Heterogeneity and the Evaluation of Public Policy Economic Choices
2001 Akerlof, George
Nobel Year Nobel Laureate Nobel Citation Nobel Lecture Smith, Vernon concerning human judgment and decision-making under uncertainty” “for having established laboratory experiments as a tool in empirical economic analysis,
especially in the study of alternative market mechanisms” The Invention and Early History of the CCD
2003 Engle, Robert
Granger, Clive
“for methods of analyzing economic time series with time-varying
volatility (ARCH)”
“For methods of analyzing economic time series with common trends (cointegration)” Risk and Volatility: Econometric Models and Financial Practice Time Series Analysis, Cointegration, and Applications
2004 Kydland, Finn “for their
contributions to dynamic
macroeconomics : the time
consistency of economic policy and the driving forces behind
Nobel Year Nobel Laureate Nobel Citation Nobel Lecture
Prescott, Edward
business cycles”
The
Transformation of
Macroeconomic Policy and Research
2005 Aumann, Robert
Schelling, Thomas
“for having enhanced our understanding of conflict and cooperation through game-theory analysis”
War and Peace
An Astonishing Sixty Years: The Legacy of Hiroshima
2006 Phelps, Edmund “for his analysis
of intertemporal tradeoffs in macroeconomic policy”
Macroeconomic s for a Modern Economy
2007 Hurwicz,
Leonid
Maskin, Eric
Myerson, Roger
“for having laid the foundations of mechanism design theory”
But Who Will Guard the Guardians?
Nobel Year Nobel Laureate Nobel Citation Nobel Lecture Perspectives on Mechanism Design in Economic Theory
2008 Krugman, Paul “for his analysis
of trade patterns and location of economic activity” The Increasing Returns Revolution in Trade and Geography
2009 Ostrom, Elinor
Williamson, Oliver
“for her analysis of economic governance, especially the commons”
“For his analysis of economic governance, especially the boundaries of the firm” Beyond Markets and States: Polycentric Governance of Complex Economic Systems Transaction Cost Economics: The Natural Progression
2010 Diamond, Peter
6
An Erdos number is a number representing the “degree of collaborative distance” between mathematician Paul Erdos, his co-authors, and their authors, with the number zero for Erdos himself.
Data source: Assembled from http://nobelprize.org/nobel_prizes/economics/laureates/, and
http://en.wikipedia.org/List_of_Nobel_laureates_in_Economics.
____________________________________________________________
diplomas which winners also receive. The objective of this part of the exercise is to compute the full
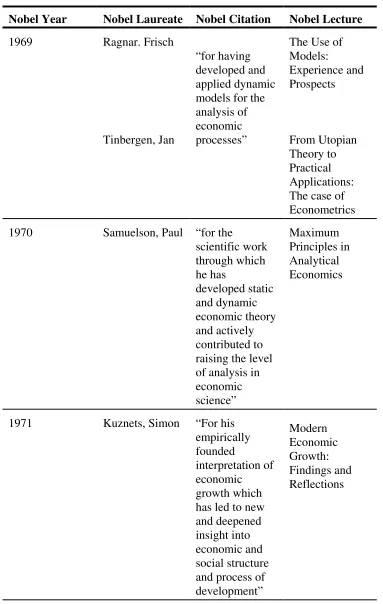
value of the Nobel Prize, stressing the Economics Nobel, but only as an example. Table 5 describes the 42 Nobel prizes awarded to conomists since 1969. Most awards went to macroeconomists, many of them affiliated with the University of Chicago (USA). The runners-up are game theoretic economists, which has given fodder to those who argue that economics has become a useless game of trickery. The affiliation with the University of Chicago is open to the charge that economics has become an ideological cult, especially in its assumptions of market efficiency and market infallibility (perfection). These arguments feed into the accusation that economics does, and should, not belong to the family of “real Nobel” awards.
I have not read all the Economics Nobel Prize Lectures. However, the little I know has convinced that each award represents a unique and significant contribution to both the knowledge of economics and the economics of knowledge. However, if there were an equivalent “Erdos number” for economists, it would show that nearly all Nobel Prize economists are closely linked.6 One reading of that
closeness is that Nobel Prize economics does not spread far and wide, and represent a typical case of an apple that does not fall too far from the tree. Thus, measured as the volume of a cone, the observed contribution of Nobel Prize economics to our knowledge and understanding has come mainly from increased depth; growth in the radius (reach) and base (width) has been very limited, I think. No?
Let’s say the full value of the Nobel Prize (V) is a weighted sum of its partial values (vi), i.e., the
money award that one normally hears about, the medal value, the diploma value, and whatever net positive externalities there may be. Briefly
where the cardinal weights
a
iare unknown, but ordinally people tend to put more weight on the money value of the award than on the other components. Again the objective of this exercise it to try to change that.3.2 Value of Nobel Prize Medal (v2)
Let us designate v2 as the partial value of the Nobel Prize medal. We can estimate v2 from the market price of gold (P). We know that prior to 1980 Nobel Prize winners received a 23-karat gold medal 66 mm in diameter and weighing 200g. Since 1981 winners have been given an 18-karat green gold medal of the same dimensions and weight as in previous year, but plated with 24-karat gold. The medal was designed by the famous Swedish multi-media artist Gunvor Svensson-Lundkvist (also spelled Lundqvist). Thus, v2 is some linear combination of the value of the gold medal (PQ) and a constant G representing the designer premium (added value), i.e.,
where P is the average gold price of medal that year, which in 2009 equaled to $8900 in 2009 dollars for years prior to 1980, and $6900 for years after 1980; and Q is the number of Nobel Prize awards that year, equal to five until 1968 and six since 1969 with any number of winners sharing one prize in each category. Thus, assuming Q = 1 and G = 0, the value of the Nobel Prize in 1901 in 2009 SEK was
Similarly, in 1998,
where 0 is the US$-Kronor rate of exchange. Then, across Nobel Prize categories we multiple V1901
by 5 categories and winners, and V1998 by 6 categories and winners. In 2010 for example there were
six categories but 11 winners ( 1 in Physiology/Medicine, 2 Physics, 3 Chemistry, 1 Literature, 1 Peace, and 3 Economics).
More likely than not, G > 0, representing the value added (premium) to the medal by its designer and engraver. One expects a medal value to rise (fall) with the popularity (infamy) of its maker. In this specific case G can be approximated by the average value of a Gunvor Svensson-Lundqvist piece of art. This value is unknown, but it does exist. Since there is no straightforward way to estimate G, I use some commonsensical proxies gleaned from relevant history. For example, I found that in the 1960s Svensson-Lundqvist did a Dag Hammerskjold (Second UN Secretary General) commemorative medal. The value of that medal can be used to represent G for the 1960-1980 period. Another significant art piece by Svensson-Lundqvist is “Amanda” from her “Women in Myth and Reality” collection, which can be used to proxy G for the 1970s-1990s. For the 1990-2000 period I considered Svensson-Lundqvist’s “Circus” exhibit, but was unable to find reliable prices. Theoretically these (2)
(3)
overlapping Gs give the average G in (2) above.
The search for a G as envisioned above turned out more difficult than anticipated mainly because it requires much time and effort, and better understanding of the operations of auctions, auctions markets, and the pricing of art pieces than I have. The prices of these pieces have differed greatly, and I could only find prices for Svensson-Lundkvist’s replica pieces like the Dag Hammarskjold commemorative medal in bronze token selling for $40 and in bronze coin going for $49. Twice, in 1978 and 1990, her 56mm 121.92g silver medal sold for 300 SEK, and in 1992 a 59mm 101.2g sterling silver medal of King Karl Gustaf XVI sold for 500 SEK. From this limited data, it would seem the average G = 362.5 SEK, i.e., Svensson-Lundkvist design adds 362.5 SEK to the value of the Nobel Prize medal. Thus, adjusted for G (2) is
However, V and v2 in (4) are still incomplete since G is likely adjusted upward or downward by a
coefficient of influence. It is known, for example, that Svensson-Lundkvist’s work was influenced
by the Russian sculptor Michael Katz in the 1930s, by her husband Bengt Inge Lundqvist, and by her own (family’s) travels to Florence, Rome, Amsterdam, Brussels, London, and Paris in the 1940s-1950s, so that (2) or (4) becomes
where 2 is the coefficient of influence of others on Svensson-Lundkvist’s design of the Nobel Prize
medal, for 2 = 1 in (2) and (4). Since from (5) we can set where $200
is the value of Michael Katz’s abstract painting “Jediah ‘17". In that case, (5) becomes
where [] term is interactive 2G. And finally
which is still not full, because it does not reflect the value of the Nobel Prize diploma (v3), discussed next below.
3.3 Value of Nobel Prize Diploma (v3)
(4)
(5)
(5')
7
The exception is the Nobel Peace Prize because many winners in this category have face life-threatening situations including long-term detentions and prosecutions.
8
For an undergraduate student my published record on those topics is not bad at all, if I can pat myself on the back.
The value of the Nobel Prize diploma (v3) is even harder to calculate than the value of the Nobel Prize
medal, but that alone is no reason not to try. We know for certain that v3 is a least the same value as
the highest college diploma the winner already has; most winners do not forgone “much” to get a Nobel Prize, many already being senior professionals in their chosen fields, and in a few cases even retiree.7
For that the opportunity cost is low; there are very few, if any, scientists who deliberately seek to earn a Nobel Prize. Given controversies about deserving people who have not won, and presumably undeserving people who have won, a Nobel Prize diploma is not an economical pursuit. Yet it clearly adds considerable marginal benefit to the winner’s value.
Winning a Nobel Prize raises the stock value of the winner by quite a bit – the so-called “Matthew effect”(Merton, 1968, Mazloumian, et. al., 2011). However, it is not so clear whether the rise is due the Nobel Prize, or due to the fact that Nobel Prize winners earn more because they work even harder after winning the Prize. Here are my two personal stories of the value of a Nobel Prize winner. One, during my last two years as an undergraduate student at UCLA I got to know casually Professor Donald J. Cram. I visited with him frequently and his door was always open for me and his students (I was an economics student). Then in 1987 Dr. Cram won the Nobel Prize for his contributions to Chemistry, and hence to “mankind.” Only two weeks after he won, I stopped by his office hoping to say “congrats,” but understandably by then I was very low on a 6-month waiting list. The poor guy was working even longer hours off-campus than before, while somehow still maintaining his regular campus job.
The second personal story is that throughout my student years at UCLA I was actively engaged in student politics, especially on issues relating to the University of California’s investment in firms that did business with Apartheid South Africa and Namibia.8 In that capacity in 1984 I was one of the
students who petitioned Chancellor Charles E. Young and the UCLA administration to pay Bishop Desmond Tutu of South Africa an honorarium when he came to speak on campus at our invitation. We met strong resistance at first, but finally succeeded and arranged for Tutu to speak in a UCLA Law School hall that sits approximately 1500. A number of South African students and I were responsible for finding the Tutus (the Bishop and his wife) accommodations, which went very well. However, on the day of the speech only 45 students showed up, and most in attendance were from Africa. We were both angry and embarrassed that the university administration may have been justified in their resistance to pay Tutu an honorarium.
9
Then in 1993 I was at Heathrow International Airport and there was Bishop Tutu. He recognized me right away and we chatted briefly before both taking the same flight to Cape Town although he was in first class and I in couch. It felt good to meet him again, and to know that he understood my friends and I were no security threat to him or any one else.
I watched the speech from a monitor outside the Pavillion. We had no tickets. When our group that had brought Bishop Tutu to campus only three weeks previous asked to see him and to congratulate him on being given a Nobel Peace Prize, we were told we could not see him for “security reasons.” What a difference a Nobel Prize made to the value of a person in three weeks!9
The point of my two stories is that while it is difficult to determine whether these people are worth more because they won the Nobel Prize (a return on past hard work) or because after winning the Nobel Prize they worked harder than before, we can be certain that the true value of a Nobel prize diploma is not zero. At the very minimum v3 is the cost of (a) the material used to make the diploma, (b) the
artist and calligrapher design and other time and effort (Designing), and ( c) binding the diploma (Binding). Clearly ( c) is a fixed cost, (b) is the opportunity cost of taking on the designing of a Nobel Prize diploma as opposed to doing the next best job, and (a) is a sticky variable cost, so that ,
The question is: What is 8, and hence v3? According to the Nobel Prize website, three companies have
been involved in binding Nobel Prize diplomas. In Sweden there is Falth & Hassler bookbindery (formerly Hassler Bokbinderi), and in Norway is Refsum until 1986, and Kjell-Roger Josefson since 1986. Table 6 below lists the artists and calligraphers responsible for designing Economics Nobel Prize diplomas over the years.
[image:34.612.62.551.432.617.2]________________________________________
Table 6 - Artist and Calligraphers of Economics Nobel Prize Diplomas, 1969-2010
Year Name
1969 Reinhold Ljunggren
1970-1971 Gunnar Brusewitz, Elsa Noreen
1972-1973 Gunnar Brusewitz
1974 Karl Axel Perhsson
1975-1976 Tage Hedqvist
1977-1980 Sven Ljungberg
1981-1987 Sven Ljungber, Sven Hoglund
Year Name
1988-1989 Sven Ljungberg, Annika Rucker
1990-1993 Philip von Schantz, Annika Rucker
1994- 1998 Bengt Landin, Annika Rucker
1999-2003 Nils G. Stenqvist, Annika Rucker
2004 Jordi Arko, Annika Rucker
2005 Ulla Kraitz, Annika Rucker
2006 Ingegerd Moller, Annika Rucker
2007 Per Enoksson, Annika Rucker
2008 Jean-Louis Maurin, Annika Rucker
2009 Roland Jonsson, Annika Rucker
2010 Sture Berglund, Annika Rucker
Data Source: http://nobelprize.org/nobel_prizes/about/diplomas/chronological.html. _____________________________________________________
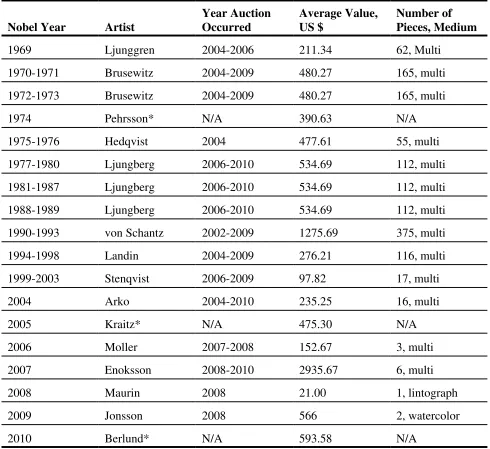
[image:35.612.60.548.81.343.2]According to Birgitta Lemmel of Nobelprize.org, for example, the artist and calligrapher of Amartya Sen’s diploma, respectively, were Bengt Landin and Annika Rucker. The binder was Falth & Hasslers. Theoretically, by finding the values of some work of Falth & Hasslers and Landin and Rucker, we can estimate (7) above. But first, let’s pursue (7) piece by piece beginning with the Designing value in Table 7 below. Based on bits of information I found on the internet, it appears that on average the artist contributes $593.58 to the full value of a Nobel prize diploma, however that contribution varies across artists. These are rough estimates based on the average auction values of pieces of art by individual artists in all media. Given that some artists like Philip von Schantz have sold more pieces than others, it is quite possible these estimates are biased upward, but the average seems reasonable (see
http://www.findartinfo.com/search/listprices.asp.
Table 7 does not include the contributions of calligraphers to the value of the Nobel Prize diploma, making Annika Rucker’s statement correct that she is ‘like the shoe-maker, [for whom] everyone only a d m i r e s t h e s h o e , [ a n d ] n o o n e a s k s a b o u t h i m ’ ( s e e e . g . ,
http://www.hindustantimes.com/StoryPage/Print/620132.aspx). This is clearly a defect that needs rectified since in some cases, as in the case of Annika Rucker herself, artists work for the calligrapher.
10
[image:36.612.57.547.96.545.2]Excludes calligraphers, but artists are listed more than once when they have worked with different calligraphers in different years.
Table 7 - Average Artist Contribution to Value of Economics Nobel Prize Diploma10
Nobel Year Artist
Year Auction Occurred
Average Value, US $
Number of Pieces, Medium
1969 Ljunggren 2004-2006 211.34 62, Multi
1970-1971 Brusewitz 2004-2009 480.27 165, multi
1972-1973 Brusewitz 2004-2009 480.27 165, multi
1974 Pehrsson* N/A 390.63 N/A
1975-1976 Hedqvist 2004 477.61 55, multi
1977-1980 Ljungberg 2006-2010 534.69 112, multi
1981-1987 Ljungberg 2006-2010 534.69 112, multi
1988-1989 Ljungberg 2006-2010 534.69 112, multi
1990-1993 von Schantz 2002-2009 1275.69 375, multi
1994-1998 Landin 2004-2009 276.21 116, multi
1999-2003 Stenqvist 2006-2009 97.82 17, multi
2004 Arko 2004-2010 235.25 16, multi
2005 Kraitz* N/A 475.30 N/A
2006 Moller 2007-2008 152.67 3, multi
2007 Enoksson 2008-2010 2935.67 6, multi
2008 Maurin 2008 21.00 1, lintograph
2009 Jonsson 2008 566 2, watercolor
2010 Berlund* N/A 593.58 N/A
* No data was found, and so the value is the average of values before it; N/A = not available. DataSource: Calculated from data collected at http://www.findartinfo.com/search/listprices.asp.
________________________________________________________
11
The color is decided by the Royal Swedish Academy of Sciences in the case of Economics and other disciplines.
12
Even assuming one diploma takes two days to finish one diploma, this estimate is likely low because it disregards that each diploma is made special for the recipient.
13
I assessed this average from pieces of data from the Art of the Nobel Prize availalbe at
www.Artnet.com, www.Artprice.com, and Lekskon Nobelovaca at Stockholm’s www.Auktionsverk.se. the winner’s monogram, cost of researching the background and personality of the winner, cost of typography, as well as the cost of the actual calligraphy of the citation which “takes up to two days to complete one citation.”11 From examining various internet resources and emailing a few calligraphers
in the USA, including one who claimed to have calligraphed diplomas for Columbia University, I estimate the average market price of a single diploma calligraphy to be about $30, or $60 minimum for the Nobel Prize diploma (http://www.thaindian.com/newsportal/uncategorized/heres-the-art-behind -nobel-citations_100452189.html).12 The average cost of non-calligraphic elements of the Nobel Prize
diploma appears to be 432 SEK,13 so that
For 1969 implying
From all the above, (1) is thus
This can be calculated for each year as
where again v1 is what is normally reported as the Nobel Prize award, and v2 and v3 are medal and
diploma values.
Table 8 -Components of the Value of the Economics Nobel Prize, 1969-2010
(7')
(8)
Nobel Year
0 PQ G v2 Binding Designing v3
1969 5.17 92026.00 119130.90 211156.9 310.20 1092.63 1402.83
1970 5.17 42013.00 59565.45 101578.45 310.20 2483.00 2793.2
1971 4.87 43298.50 59565.45 102863.95 291.90 2336.51 2628.41
1972 4.74 84425.40 119130.90 203556.3 284.58 2277.92 2562.5
1973 4.59 40828.75 55565.45 96394.2 275.25 2203.24 2478.49
1974 4.08 72632.90 119130.90 191763.8 244.83 1593.97 1838.8
1975 4.39 78061.90 119130.90 197192.8 263.13 2094.56 2357.69
1976 4.13 36725.85 59565.45 96291.3 247.59 1970.86 2218.45
1977 4.67 83571.00 119130.90 202701.9 280.17 2496.74 2776.91
1978 4.29 38229.95 59565.45 97795.4 257.73 2296.76 2554.49
1979 4.15 73807.70 119130.90 192938.6 248.79 2217.09 2465.88
1980 4.37 38917.92 59565.45 98483.37 262.3.7 2338.09 2600.39
1981 5.57 384399.00 59565.45 443964.45 334.26 2978.76 3313.02
1982 7.29 50332.05 59565.45 109897.5 437.67 3900.30 4337.97
1983 8.00 55206.90 59565.45 114772.35 480.06 4278.55 4758.61
1984 8.98 62027.55 59565.45 121593 539.37 4806.60 5345.97
1985 7.61 52546.95 59565.45 112112.4 456.93 4071.93 4528.86
1986 6.81 47051.10 59565.45 106616.55 409.14 3646.05 4055.19
1987 5.85 40351.20 59565.45 99916.65 350.88 3126.87 3477.75
1988 6.16 42483.30 59565.45 102048.75 369.42 3292.09 3661.51
1989 6.23 42966.30 59565.45 102531.75 373.62 3329.52 3703.14
1990 6.64 137344.50 178696.35 316040.85 398.10 8462.74 8860.84
1991 6.84 47189.10 59565.45 106754.55 410.34 8722.94 9133.28
1992 7.04 48596.70 59565.45 108162.15 422.58 8983.14 9405.72
1993 8.31 114615.90 119130.90 233746.8 498.33 10593.42 11091.75
1994 7.46 154453.05 178696.35 333149.4 447.69 2060.94 2508.63
1995 6.66 45941.58 59565.45 105507.03 400.92 1839.06 2239.98
1996 6.87 94819.80 119130.90 213950.7 412.26 1897.84 2310.1
1997 7.88 108702.60 119130.90 227833.5 472.62 2175.71 2648.33
1998 8.06 55620.90 59565.45 115186.35 483.66 2226.53 2710.19
1999 8.53 58822.50 59565.45 118387.95 511.50 833.92 1345.42
2000 9.54 131583.00 119130.90 250713.9 572.10 932.71 1504.81
2001 10.67 220817.25 178696.35 399513.6 640.05 1043.50 1683.55
2003 7.19 99210.96 119130.90 218341.86 431.35 703.25 1134.6
2004 6.62 91281.48 119130.90 210412.38 399.69 1556.09 1955.78
2005 7.96 109825.92 119130.90 228956.82 477.04 3782.63 4259.67
2006 6.86 47364.36 59565.45 106929.81 411.86 1047.99 1459.85
2007 6.41 132761.52 178696.35 311457.87 384.82 18828.21 19213.03
2008 7.81 53893.14 59565.45 113458.59 468.64 164.02 632.66
2009 7.12 98207.70 119130.90 217338.6 426.99 4027.94 4454.93
2010 6.71 138890.79 178696.35 317587.14 402.58 3982.74 4385.32
0 = SEK/US$ exchange rate; PQ = value of the metal content of the medal; G = designer premium of medal; v2
= partial medal value; Binding = cost of binding diploma; Designing = cost of designing diploma; and v3 = partial
value of diploma.
Data Source: Exchange rate data is from the World Bank’s International Financial Statistics Yearbooks 1980, 1990, April 2011 - rounded to the nearest tenth. For other data see previous tables.
[image:39.612.62.548.352.697.2]_____________________________________________
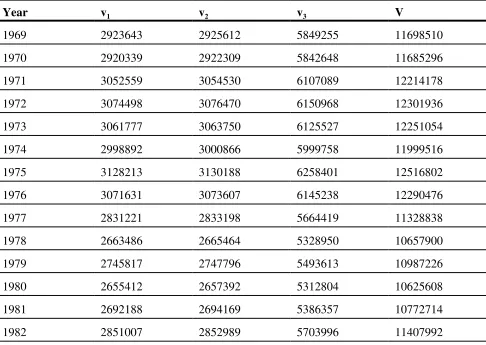
Table 9 - Adjusted Monetary Value of the Economics Nobel Prize in 2009 SEK – 1969-2010
Year v1 v2 v3 V
1969 2923643 2925612 5849255 11698510
1970 2920339 2922309 5842648 11685296
1971 3052559 3054530 6107089 12214178
1972 3074498 3076470 6150968 12301936
1973 3061777 3063750 6125527 12251054
1974 2998892 3000866 5999758 11999516
1975 3128213 3130188 6258401 12516802
1976 3071631 3073607 6145238 12290476
1977 2831221 2833198 5664419 11328838
1978 2663486 2665464 5328950 10657900
1979 2745817 2747796 5493613 10987226
1980 2655412 2657392 5312804 10625608
1981 2692188 2694169 5386357 10772714
Year v1 v2 v3 V
1983 3414135 3416118 6830253 13660506
1984 3475389 3477373 6952762 13905524
1985 3532346 3534331 7066677 14133354
1986 3766120 3768106 7534226 15068452
1987 3928223 3930210 7858433 15716866
1988 4269078 4271066 8540144 17080288
1989 4817335 4819324 9636659 19273318
1990 5816034 5818024 11634058 23268116
1991 7970702 7972693 15943395 31886790
1992 8439714 8441706 16881420 33762840
1993 8311087 8313080 16624167 33248334
1994 8499648 8501642 17001290 34002580
1995 8526186 8528181 17054367 34108734
1996 8721067 8723063 17444130 34888260
1997 8796801 8798798 17595599 35191198
1998 8926244 8928242 17854486 35708972
1999 9234532 9236531 18471063 36942126
2000 10414372 10416372 20830744 41661488
2001 11298361 11300362 22598723 45197446
2002 11059050 11061052 22120102 44240204
2003 10850126 10852129 21702255 43404510
2004 10809285 10811289 21620574 43241148
2005 10762024 10764029 21526053 43052106
2006 10538226 10540232 21078458 42156916
2007 10183215 10185222 20368437 40736874
Year v1 v2 v3 V
2009 10182428 10184437 20366865 40733730
2010 10271123 10273133 20544256 41088512
v1 = partial money value of Nobel Prize; v2 = partial medal value of Nobel prize; v3 = partial diploma
value of Nobel Prize; and V = v1 + v2 + v3.
[image:41.612.61.551.249.685.2]________________________________________________
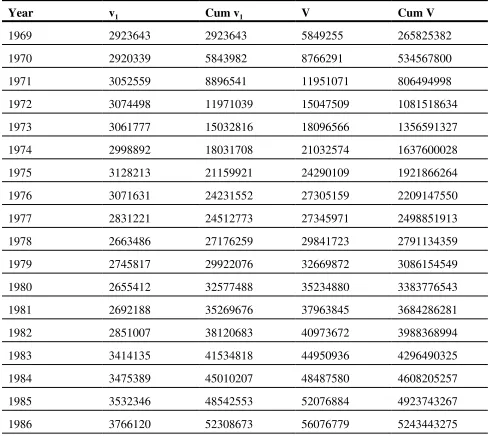
Table 10 - Actual versus Adjusted Monetary Value of the Economics Nobel Prize in 2009 SEK – 1969-2010 (Cum = cumulative)
Year v1 Cum v1 V Cum V
1969 2923643 2923643 5849255 265825382
1970 2920339 5843982 8766291 534567800
1971 3052559 8896541 11951071 806494998
1972 3074498 11971039 15047509 1081518634
1973 3061777 15032816 18096566 1356591327
1974 2998892 18031708 21032574 1637600028
1975 3128213 21159921 24290109 1921866264
1976 3071631 24231552 27305159 2209147550
1977 2831221 24512773 27345971 2498851913
1978 2663486 27176259 29841723 2791134359
1979 2745817 29922076 32669872 3086154549
1980 2655412 32577488 35234880 3383776543
1981 2692188 35269676 37963845 3684286281
1982 2851007 38120683 40973672 3988368994
1983 3414135 41534818 44950936 4296490325
1984 3475389 45010207 48487580 4608205257
1985 3532346 48542553 52076884 4923743267
Year v1 Cum v1 V Cum V
1987 3928223 56236896 60167106 5567574465
1988 4269078 60505974 64777040 5896863846
1989 4817335 65323309 70142633 6232515519
1990 5816034 71139343 76957367 6577136594
1991 7970702 79110045 87082738 6932352052
1992 8439714 87549759 95991465 7296347610
1993 8311087 95860846 104173926 7668714190
1994 8499648 104360494 112862136 8049795518
1995 8526186 112886680 121414861 8439624442
1996 8721067 121607747 130330810 8838445049
1997 8796801 130404548 139203346 9246267635
1998 8926244 139330792 148259034 9663454197
1999 9234532 148565324 157801855 10091363420
2000 10414372 158979696 169396068 10531750850
2001 11298361 170278057 181578419 10984081310
2002 11059050 181337107 192398159 11447022590
2003 10850126 191218723 202070852 11920564230
2004 10809285 202996518 213807807 12404827060
2005 10762024 213758542 224522571 12899580850
2006 10538226 224296768 234837000 13404294070
2007 10183215 234479983 244665205 13918746000
2008 10093732 244573715 254669455 14443290880
2009 10182428 254756143 264940580 14978195580
2010 10271123 265027266 275300399 15517386740
Data Source: See previous tables.
Table 8 displays basic data on the components of (8) before calculating it. Again it is assumed that P = $8900 before 1980, and $6900 since 1980. From Svensson-Lundkvist’s biography, it is clear that she was influenced by the Russian sculptor Michael Katz. I could only find one piece of Katz’s work the socalled “Jidiah” selling for $200. However, because 2 = $200 appears to have an exaggerated effect on the value of a diploma, I abandoned it. In all that follows 2 = 1. Noticeable in this table is that v2 is not
insignificant; the value of the metal content of the medal (PQ) may or may not be inflated as the actual P has varied over the years (Newcomb and Tsuji, 1990). Even with 2 = 1, G adds significant vaue to v2
so that the Nobel Prize medal can be predicted to fetch 317,587.14 SEK (US$47,330.42 at the 2010 official SEK/US$ rate of exchange). At the same exchange rate, the Nobel Prize diploma would sell for US$653.55. Thus, the full value of the Nobel Prize (V) in all its components is presented in Table 9; there is a huge difference between v1 and V. For example, in 1987 Robert Solow received 3.93 million SEK
(US$671,491.11) for his award. Considering the values of the medal and diploma, his full Prize was 15.72 million SEK or US$2.69 million.
Finally Table 10 presents the full value of the Economics Nobel Prize in 2009 SEK monetary value. Compared to previous tables, the differences are huge, because while v1 is unchanged, v2 and v3 changed
with P, Q, G, and Binding and Designing costs. In other words, there is only one v1 shared equally among
however many winners, but each winners receives a separate medal, and a separate and distinct diploma.
4. Value of Nobel Prize: Tentative Propositions and Their Implications for Human Capital Accumulation, Technological Change, and Long-Run Economic Performance
The data described above clearly shows that Alfred Nobel and his Foundation have kept their end of the promise; they backed it up with real money - big money. Now the question is: What is the cumulative impact of the Nobel Prize on “mankind”? A separate part, Part 2, of this exercise will seek to contribute to the answer to that question. Here I only sketch general relationships (a) between the Nobel Prize and human capital building, (b) between human capital and technological change, and ( c) between technological change and human capital on the one hand and long-run economic growth on the other.
At the general level the propositions Part 2 will make do not require a brand new economic theory. Since the intention of the Nobel Prize is to support welfare enhancing activities, both conventional production and welfare economic theories are well-equipped to deal with that despite disagreements among economists about normative economics, especially the specifications of social welfare functions. Even with that discord, at its Annual Meeting in Denver, Colorado (January 7-9, 2011), the American Economic Association sanctioned a session on “Economics as a Moral Science.” The papers in that session aimed at (a) renewing interest in welfare economics (Tony Atkinson), (b) characterizing the (im)morality of markets (J. Bhagwat), (c)describing the moral and religious origins of economics (Ben Friedman), and (d) outlining a worldly philosophy of economics ( Shiller and Shiller). These calls are re-energizing, but not new as Edmund S. Phelps (1969) and his very famous coauthors illustrate in The Goal of Economic Growth.
development” observed during the 20th Century, such as “motorized flight, human powered flight, and
energy efficient refrigerators”. They find that prizes motivate inventive/innovative activities, but the structures of the spillover and reputation effects they engender are still difficult to unravel, and thus the authors conclude that “prizes have important positive externalities for the sponsors”rather than for the winners and society in general. This is not hard to understand as sponsors must raise the needed funds.
The approach I take in Part 2, however, is simple. It starts with a maintained assumption that unknown future (Nobel) prize winners today (t=0) pursue their self-interests, expecting no grand pay-off (prize) for their efforts. Thus collectively they maximize the sum of their discounted utilities from their activities (z, t) subject to their budget (y(z, t)), i.e.,
In the “ordinary business of life” U(z, t) has some significant social value, but it becomes a driving force upon winning a (Nobel) prize, such that social welfare comes to depend on the welfare of prize winners, which can be stated as the following maxmax:
where y* is prize-influenced budget. In other words, (10) implies society has the same, but not identical, preferences for a typical Nobel Prize winner, differing only in that the full Nobel Prize award is now an argument in the social budget control (Sterdy, 1960). I demonstrate (10) more precisely later. For now the following propositions will characterize Part 2.
4.1 Economic Activity and Human Development
First, a key proposition is that an economic activity like the production of real GDP (Y) ultimately depends on the economy’s technical capability
where is the human development index (HDI), for H = human capital index of the
population, Y = the material conditions of the population, and and are weights.
(9)
(10)
14
The reason for indefinite integration is to suggest that q is a 3-dimensional matrix of which quality is one dimension, quantity is another, and time is yet another dimension. In this sense H is 3D, not an area under the curve.
4.2 Human Development and Human Capital Accumulation
For it follows that
Now we can think of net as Romer’s object production function, then (12) becomes
. Assuming f is Cobb-Douglas, (13) can be restated as the Lucas’s “miracle” model
where are parameters.
4.3 Human Capital, Technological Change, and Nobel and Other Prizes
Conventionally, from (13)
However, (15) suggests that H is just a residual and therefore a part of A in the Hicks-Solow neutralilty sense. To avoid sending that message, I modify Lucas to Romer by posing that14
such that
(12)
(13)
(14)
(15)
(16)
Thus, for ] in which Thus, (17)
Whereas it is precise, (18), especially its term, is too data demanding. Following Amavilah
(1996), and Amavilah and Newcomb (2004), I argue that A is both Arrow-learning to capture technological change (invention, innovation, and diffusion) and Hicks neutral (or even Solow neutral if one this of H and K as just total K) to reflect technical progress (cf. Solow, 1997). Hence A evolves as
where J is a learning function of cumulative Y in response to inputs, especially H. For
In terms of growth rates, the first term of (20) represents technological change made possible by learning and the second term measures the exogenous rate of technical change. Plugging (20) into (17) gives us
and I expand on (21) in Part 2 of this exercise.
4.4 Economic growth, Human Capital, Technological Change, Nobel and other Prizes
Dividing (20) by N and rearranging, per capita Y becomes
(18)
(19)
(20)
(21)
where y = Y/N, k = K/N, and Because (22) gets rid of the double integrals, it minimizes somewhat “the perils of the learning model for modeling endogenous technological change” that Nordhaus (2009) describes. The Nobel Prize variable can enter (22) either as an argument of A, or an element of H, and included in q. As an argument of A, it implies that technological change is Arrow-learning with a Hicks neutral rate of technical change. As an element of H, technological change is Arrow-learning with a Harrod rate of technical change. Eq. (21) is Arrow-learning with Solow neutrality
if we rewrite (18) as (cf. Solow, 1997, Chapter 1; Hsiao, 1968).
Theoretically we can estimate (22) as
Practically, however, q is both cumulative and a function of time. That means that all the propositions stated above are tentative and untested. Part 2 of this exercise will first seek a deeper understanding of these propositions and their links to selected literature. Second, it will provide some, if only indicative, quantification of the insights gained.
5. Concluding Remark
The Nobel Prize ranks high among prestigious awards internationally. In its academic categories of Chemistry, Economics, Literature, Medicine/Physiology, and Physics, the Nobel Prize is arguably the highest honor any scholar can receive. It confers honor, advances research in the area, attracts research money, and raises the personal stock of the winner, thereby generating the “Matthew effect,” among many of its benefits. However, since the prize is given for significant contributions to humanity, it is not unreasonable to ask what its cumulative impact has been to-date. In that regard, there remains a gap in our understanding of this question, in large part because of the incompleteness of the data on the full value of the Nobel Prize.
This exercise seeks to fill in two cracks in the existing gap, and it does so in two related installments -Part 1 and -Part 2. -Part 1 - the current part - is a theory-less arithmetic exercise that calculates the full value of the Nobel Prize, including the values of the Nobel Prize medal and diploma. While it is a cheap “data” mining “without theory,” it is not a useless activity. For example, the exercise finds that Alfred Nobel and his people have kept their promise, and backed it up with real money - big money. On a per capita basis and over its life-cycle todate, the Nobel Prize exceeds many countries’ educational budgets, even without considering its time value of money. Impressive!
However, with such an impressive record the Nobel Prize raises questions about what its cumulative effect is. Part 1 sketches some fundamental relationships between human technical capability (development), human capital, technological change, the Nobel Prize, and long-run economic performance. Part 2 attempts to formalize the sketches of Part 1, seeking to understand their deeper theoretical and empirical content as well as interconnectedness. Thus, although Part 1 is not a research project in the Scientific