Munich Personal RePEc Archive
What happened to efficiency in
electricity industries after reforms?
Erdogdu, Erkan
Judge Business School, University of Cambridge, UK, Energy
Market Regulatory Authority, Republic of Turkey
July 2011
Online at
https://mpra.ub.uni-muenchen.de/32483/
What happened to efficiency in electricity industries after reforms?
Erkan Erdogdua,b,c,*
a
Judge Business School, Univ. of Cambridge, Trumpington Street, Cambridge, CB2 1AG, UK
b
Energy Market Regulatory Authority, Muhsin Yazıcıoğlu Cd., 51/C, 06530, Yüzüncüyıl, Ankara, Turkey
Abstract
The last two decades have witnessed widespread power market reforms in both developed and
developing countries that have cost billions of dollars. Among the key aims (and assumptions) of these reforms, there has always been realization of improvements in power sector
efficiency. This paper questions the validity of this hypothesis. Using panel data from 92 countries covering the period 1982–2008, empirical models are developed and analyzed. The research findings suggest that the impact of the reforms on electricity industry performance is
statistically significant but also limited. The results imply that, after controlling for country-specific variables, application of liberal market models in electricity industries slightly
* Corresponding author. Tel.: +44(0)787-6063091
E-mail: ee243@cam.ac.uk
c The author is a PhD candidate at Judge Business School and a member of Electricity Policy Research Group
(EPRG) of University of Cambridge (UK). The research presented in this paper has been conducted during his
doctoral (PhD) studies at University of Cambridge. The author is also an Energy Expert working for Energy
Market Regulatory Authority (EMRA) of the Republic of Turkey. The views, findings and conclusions
expressed in this article are entirely those of the author and do not represent in any way the views of any
2
increases efficiency in power sector. Besides, we detect a positive relationship between
reform process and the percentage share of network (transmission and distribution) losses in total electricity supplied; meaning that as countries take more reform steps the network losses
as a fraction of power generated tend to increase. Moreover, the study puts forward that income level and other country specific features are more important determinants of industry efficiency than the reform process. Overall, contrary to expectations of substantial increases
in sector efficiency, the paper concludes that introducing a decentralized market model with competition in the electricity sector has a limited increasing effect on power industry
performance.
Keywords: Models with panel data (C33); model construction and estimation (C51); electric
utilities (L94); power market reform; electricity industry efficiency
1. Introduction
Improvement in efficiency constitutes one of the two principal aims in any power sector
reform program1. It is typically argued that, even in the short run, the reform process introduces competition, which in turn encourages economic units with the lowest costs to
operate in the market. Besides, over the longer term, markets present better incentives for new entrants; and new entrants with more efficient technologies place additional upward pressure on efficiency levels. Overall, it is expected that the introduction of reforms in the electricity
markets leads to higher efficiency levels. The main aim of this paper is to discover whether
1 The other principal aim of the power sector reforms has been reductions in electricity price cost-margins. We
3
the power market reforms realize these expectations. The paper also aims at clarifying
whether the impact of power sector reform on efficiency differs among countries according to their development level and regional characteristics. Empirical econometric models are
estimated and then analyzed to observe the effect of electricity market reform process on power industry efficiency. The econometric models are designed using panel data from 92 countries where a reform process in the electricity industry has been initiated. The dataset
covers the period from 1982 to 2008.
We try to answer the following research questions: (i) what is the impact of power market reforms on electricity industry performance? (ii) are there systematic differences among various country groups, in relation to development level and region, concerning the influence
of reforms on electricity sector efficiency? (iv) what are the other factors that influence efficiency levels in power industry and how much are they influential relative to reform
process?
In line with our research questions, the main hypothesis we test in this study (Hypothesis 1) is
given below. Besides the main hypothesis, we also check for the following assumption (Hypothesis 2).
Hypothesis 1. As countries introduce more and more reform steps, efficiency levels in the power industries increase.
4
Based on our hypotheses above, we expect a positive relationship between reform process and
income level on the one hand and on the other hand plant load factor, net generation per employee in electricity industry, and net generation per employee in utility industries. We
also expect a negative relationship between reform score and income level variables and distance from optimal reserve margin and fraction of electricity losses in total electricity supplied variables.
The paper proceeds as follows. Next section provides a literature review on the impact of the
electricity market reforms on efficiency levels. Section 3 describes data. Section 4 summarizes the methodological framework. Following section presents empirical analysis and discusses the results, followed by a section on limitations of the study. The last section
concludes.
2. Literature review
In this section, we review empirical literature on the impact of electricity sector reform
process on the efficiency levels in electricity industries. There is an extensive body of literature on electricity market reforms but most of it is in the form of opinion and discussion
without any empirical analysis. Jamasb et al. (2004) classify approaches to analyzing electricity reforms into three broad categories: (i) econometric methods, (ii) efficiency and productivity analysis methods, and (iii) individual or comparative case studies. They argue
that econometric studies are best suited to the analysis of well-defined issues and the testing of hypotheses through statistical analysis of reform determinants and performance. According
5
maintain that single or multi-country case studies are suitable when in-depth investigation or
qualitative analysis is needed. Within this classification, our study falls into the first category. Therefore, in this section we summarize econometric studies that focus on cross-country
evidence on the impact of electricity market reforms on efficiency. Non-econometric studies, econometric studies looking at just one or a few countries and studies that are not directly related to electricity markets fall outside the scope of this section.
The empirical analysis by Steiner (2001) constitutes one of the earliest analysis of the reform
process. In her study, Steiner (2001) conducted a panel data analysis including electricity price, ratio of industrial to residential electricity price, capacity utilization rate and reserve margin. Using these variables, she tried to measure the competitive aspects and the cost
efficiency of reform. She also looked at some reform elements separately, including unbundling, wholesale power pool, third party access to transmission and privatization. The
study found that electricity market reforms generally induced a decline in the industrial price and an increase in the price differential between industrial customers and residential customers, indicating that industrial customers benefit more from the reform. She also found
that unbundling is not associated with lower prices but is associated with a lower industrial to residential price ratio and higher capacity utilization rates and lower reserve margins.
Bacon and Besant-Jones (2001) tested two hypotheses in their study. The first one stated that country policy and institutions are positively correlated with reform, and second was that
country risk is negatively correlated with reform. Their results supported both hypotheses. The coefficient on the policy indicator and the coefficient on the risk indicator were
6
instance, they found that Latin American and Caribbean countries are more likely to reform
while countries in the Middle East and Africa are more likely to take fewer reform steps.
The study by Ruffin (2003) dealt with the institutional determinants of competition, ownership and extent of reform in electricity reform process. The institutional determinants employed are different measures of judicial independence, distributional conflict and
economic ideology. The study used a cross-section OLS regression analysis of a set of models with observations of up to 75 developed and developing countries that reformed their
electricity industries during the 1990s. Ruffin (2003) also used institutional explanatory variables with the electricity reform scores that reflect the extent of reform. The study found that the relation between judicial independence on the one hand, and competition and
ownership on the other, is ambiguous; i.e. the coefficients are often insignificant or, when significant, their sign shifts across models. Besides, greater distributional conflict was found
to be significantly correlated with a higher degree of monopoly. Moreover, the results showed that the relation between economic ideology favoring competition and private ownership was generally positive and significant. The results also pointed out that there is a positive
relationship between judicial independence and reform scores. Furthermore, economic ideology showed a positive and significant relation with the reform score in this study.
Fiorio et al. (2007) questioned the widespread beliefs that public ownership can be an impediment to other reforms and that it leads to production inefficiency. To test this and
examine the reform paradigm in general, they considered electricity prices and survey data on consumer satisfaction in the EU-15. Their empirical findings rejected the prediction that
7
the reform paradigm is not systematically associated with lower prices and higher consumer
satisfaction.
Zhang et al. (2008) provided an econometric assessment of the effects of privatization, competition and regulation on the performance of the electricity generation industry using panel data for 36 developing and transitional countries over the period 1985-2003. The study
identified the impact of these reforms on generating capacity, electricity generated, labor productivity in the generating sector and capacity utilization. The main conclusions were that
on their own privatization and regulation (PR) do not lead to obvious gains in economic performance, though there are some positive interaction effects. By contrast, they concluded, introducing competition seemed to be effective in stimulating performance improvements.
Based on this literature review on cross-country econometric studies related to electricity
market reforms, we may argue that present econometric evidence on the impact of the reform process on efficiency is quite limited and will take more time to emerge. Therefore there exists a huge research gap here. To best of our knowledge, the present paper constitutes the
most extensive study in this area in terms of both scale and scope.
3. Overview of data
Our data set is based on a panel of 92 countries for a period from 1982 to 2008. Year 1982 is
selected as the starting date for the study because at that time electricity market reform was initiated for the first time in Chile. The final date, 2008, represents the last year for which data
8
countries having a reform score of at least 1 or above as of 2008. Because of the missing
observations, our panel is unbalanced.
The variables used in the study are: electricity market reform score; plant load factor; distance between actual and optimal reserve margin; transmission and distribution losses as a fraction of power generated; net generation per employee in electricity industry; net generation per
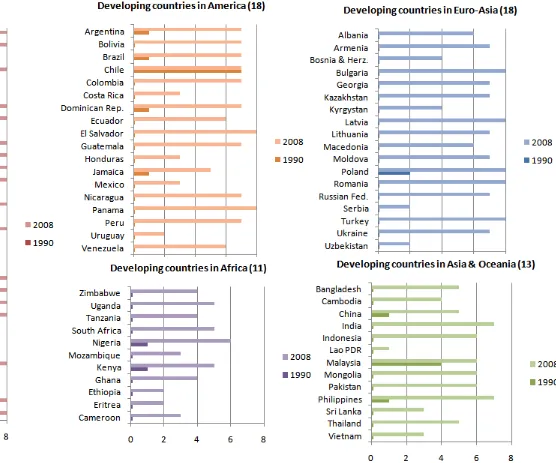
employee in utility (electricity, gas and water) industries; and income level (GDP per capita). We also divided all countries in our dataset into five groups, namely (1) developed countries
and (2) developing countries in Africa, (3) in America, (4) in Asia and Oceania and (5) in Euro-Asia. This classification is based on World Bank (2010a). We included a dummy variable for each group of country into our dataset. Countries in our analysis and the groups
they belong to are seen in Figure 1.
Electricity market reform score variable takes the values from 0 to 8; depending on how many of the reform steps below have been taken in each country and each year. To build this variable, we created 8 dummy variables for each of the reform steps. These are: (1)
introduction of independent power producers, (2) corporatization of state-owned enterprises, (3) law for electricity sector liberalization, (4) introduction of unbundling, (5) establishment
of electricity market regulator, (6) introduction of privatization, (7) establishment of wholesale electricity market, (8) choice of supplier. Then, we calculated the total number of reform steps taken in each country and each year to construct our reform score variable.
Dummy variables for reform steps were created by the author based on the data collected and cross-checked from various international and national web sites and a variety of papers.
9
One of the most important targets of power market reforms has been attaining a higher level of productive efficiency, also known as “technical efficiency”, in the electricity sector.
Productive efficiency occurs when the economy is utilizing all of its resources efficiently, producing most output from least input. Productive efficiency requires that all firms operate using best-practice technological and managerial processes. By improving these processes, an
economy or business can increase its efficiency further. The concept, at its optimum, represents a situation where no more output can be achieved from the given inputs. In our
analysis, we used four indicators representing the efficiency in the power industry, namely (i) plant load factor; (ii) distance between actual and optimal reserve margin; (iii) transmission and distribution losses as a fraction of power generated; and (iv) net generation per employee.
Plant load factor (PLF) is a measure of average capacity utilization. It is a measure of the
output of a power plant compared to the maximum output it could produce. Therefore a higher load factor usually indicates more output and a lower cost per unit. PLF is affected by non-availability of fuel, maintenance shut-down, unplanned break down and non-generation.
For example, consumption pattern may fluctuate lower in nights and some plants stop generating electricity. PLF equals to gross electricity generation divided by installed capacity
multiplied by number of hours in a year2. Data on gross electricity generation and installed capacity for each country and for each year are obtained from International Energy Agency (IEA) and US Energy Information Administration (IEA, 2010a; US EIA, 2010).
Another indicator of efficiency employed here is the distance between actual and optimal
reserve margin3. The reserve margin is calculated as the difference between capacity and peak demand, divided by peak demand. When introducing electricity sector reform, countries
attempt to plan for their energy consumption needs to satisfy demand with a sufficient, though not excessive, buffer. As a result, utilization of the reserve margin as a dependent variable would be inappropriate because too much reserve margin means inefficient allocation of
resources. Therefore, the distance of the reserve margin from a benchmark is employed in this study. In her paper, Steiner (2001) suggests that 15% may be taken as the optimal reserve
margin. The indicator in this paper also uses 15% cent as the optimal reserve margin benchmark. We do not attempt to distinguish between over and under capacity and assume that any deviation from 15% reserve margin level results in inefficiency in the industry. Peak
load data are taken from IEA (2010b).
Data on transmission and distribution losses as a fraction of power generated are created by using data from IEA and US Energy Information Administration (IEA, 2010a; US EIA, 2010). Any decrease in the share of network losses means an increase in sector efficiency.
Therefore, the share of network losses constitutes the third measure of efficiency in our analysis.
Net generation per employee is the last efficiency indicator in our study. It represents the labor productivity in the sector. A higher net generation per employee figure represents a
relatively more efficient industry. This variable is calculated by dividing the net electricity generation by the number of people employed in the industry. The data on net electricity
generation come from IEA and US Energy Information Administration (IEA, 2010a; US EIA,
12
2010). Employment in electricity industry data are extracted from EU KLEMS database (EU,
2010). This dataset covers 17 countries. Besides, aggregate data on total employment in utility (electricity, gas and water) industries are collected for 60 countries from European Union,
Eurostat and United Nations (EU, 2010; Eurostat, 2010; UN, 2010). As this variable significantly increases the extent of our analysis, we used it as a proxy for the changes in employment in power industries.
GDP per capita variable is used as a control variable in our study and it represents a part of
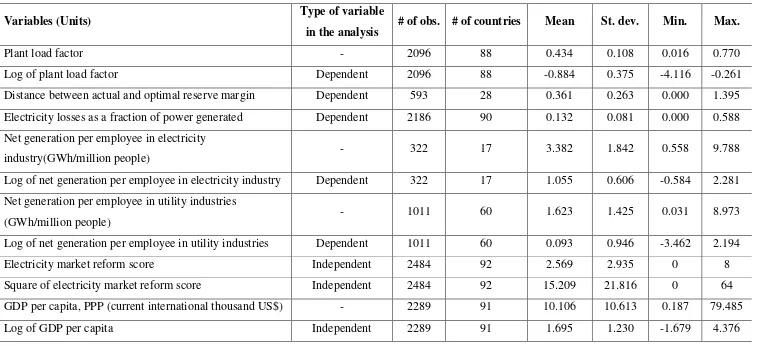
Table 1. Descriptive statistics of the variables in the model
Variables (Units) Type of variable
in the analysis # of obs. # of countries Mean St. dev. Min. Max.
Plant load factor - 2096 88 0.434 0.108 0.016 0.770
Log of plant load factor Dependent 2096 88 -0.884 0.375 -4.116 -0.261
Distance between actual and optimal reserve margin Dependent 593 28 0.361 0.263 0.000 1.395 Electricity losses as a fraction of power generated Dependent 2186 90 0.132 0.081 0.000 0.588 Net generation per employee in electricity
industry(GWh/million people) - 322 17 3.382 1.842 0.558 9.788
Log of net generation per employee in electricity industry Dependent 322 17 1.055 0.606 -0.584 2.281 Net generation per employee in utility industries
(GWh/million people) - 1011 60 1.623 1.425 0.031 8.973
Log of net generation per employee in utility industries Dependent 1011 60 0.093 0.946 -3.462 2.194
Electricity market reform score Independent 2484 92 2.569 2.935 0 8
Square of electricity market reform score Independent 2484 92 15.209 21.816 0 64
GDP per capita, PPP (current international thousand US$) - 2289 91 10.106 10.613 0.187 79.485
4. Methodological framework
It is almost impossible to observe the real impact of power market reforms on efficiency
without separating the effects of market reform from country specific features. Therefore, in our study, we make this distinction by describing efficiency in electricity industry as a function of
(a) electricity market reform score (a comparable cross-country reform indicator), (b)a control variable (income level)
(c) country-specific effects4,
(d)other unobserved variables that influence efficiency in the industry.
These variables are then used in panel regressions to assess their impact on power industry efficiency. In panel regressions, the exploitation of both cross-country and time-series
dimensions of the data allows for control of country-specific effects. Apart from reform process, efficiency in the power industry of a specific country is expected to be influenced mainly by income level of that particular country. Countries with higher GDP per capita
figures tend to use more efficient (and expensive) technologies in generation, transmission and distribution of electricity, which results in a more efficient sector. In our model, we
include income level variable in order to isolate the effect of reform process on efficiency.
We formulate regression equations as below to analyze the impact of electricity industry
reform on power sector efficiency.
1
2 1
k s
it j jit p pi it
j p
Y
β
β
Xγ
Zδ ε
t= =
= +
∑
+∑
+ + (1)
4 These are assumed to be exogenous and to exist independently of reform process, but may explain a portion of
15
In the model, i and t represent unit of observation and time period, respectively. j and p are
indices used to differentiate between observed and unobserved variables. Xji and Zpi represent
observed and unobserved variables, respectively. Xji includes both reform variable and control
variable. Yit is dependent variable.εitis the disturbance term and t is time trend term. Because
the Zpi variables are unobserved, there is no means of obtaining information about the
pZpi γ
∑
component of the model. For convenience, we define a term αi, known as theunobserved effect, representing the joint impact of the Zpi variables on Yit. So, our model may
be rewritten as follows:
1
2 i it
k
it j jit
j
t
Y
β
β
X
α δ ε
= + +
= +
∑
+
(2)Now, the characterization of the αi component is crucially important in the analysis. If
control variables are so comprehensive that they capture all relevant characteristics of the
individual, there will be no relevant unobserved characteristics. In that case, the αi term may
be dropped and pooled data regression (OLS) may be used to fit the model, treating all the
observations for all time periods as a single sample. However, since we are not sure whether control variables in our models capture all relevant characteristics of the countries, we cannot directly carry out a pooled data regression of Y on X. If we were to do so, it would generate
an omitted variable bias. Therefore we prefer to use either a Fixed Effects (FE) or Random
Effects (RE) regression. In FE model, the country-specific effects (αi) are assumed to be the
fixed parameters to be estimated. In RE model, the country-specific effects (αi) are treated as
stochastic. The fixed effect model produces consistent estimates, while the estimates obtained from the random effect model will be more efficient. Efficiency levels in the power industries may or may not be country specific as, in some cases, international or regional organizations
16
throughout a specific region. Therefore, we cannot be sure whether the observations in our
model may be described as being a random sample from a given population; and cannot directly decide which regression specification (FE or RE) to use. This will be decided in the
course of the analysis based on relevant econometric tests, namely Hausman test and Breusch and Pagan Lagrangian Multiplier (BPLM) test.
5. Empirical analysis and discussion of the results
Throughout our analysis, we estimate five groups of models to explain the impact of the reform process on the efficiency in electricity industry. A group of models is estimated for each efficiency indicator and each group includes an overall model including all countries and
some other sub-models for specific country groups5. In total, 21 models are estimated. Using logarithms of variables enables us to interpret coefficients easily and is an effective way of
shrinking the distance between values. Therefore, we transform GDP per capita, plant load factor, net generation per employee in electricity industry, and net generation per employee in utility industries variables into logarithmic form. We then use these new transformed
variables in our models. We also admit that the relationship between reform score variable and any efficiency indicator may be quadratic rather than linear. Therefore we also include
square of reform score variable into our regressions as a separate variable. However, we observe that, in some cases, inclusion of this new variable makes previously significant reform score variable insignificant. In such cases, we avoid including square of reform score
variable into the model.
5 FE estimation results do not let us detect the differences between country groups as variables that do not vary
17
We perform the empirical analysis by estimating the specification given in Equation (2) for
each model6. However, as mentioned before, we cannot directly decide which regression specification (FE or RE) to use. Therefore, we apply the Hausman test for fixed versus
random effects in each model. To perform this test, we first estimate the fixed effects model (which is consistent) and store the estimates, then estimate the random-effects model (which is efficient) and run the test. Since we prefer a significance level of 5%, any p-value less than
0.05 implies that we should reject the null hypothesis of there being no systematic difference in the coefficients. In short, Hausman test with a p-value up to 0.05 indicates significant
differences in the coefficients. Therefore, in such a case, we choose fixed effects model. However, if the p-value from Hausman test is above 0.05, we cannot reject the null hypothesis of there being no systematic difference in the coefficients at 5% level. In short, in these cases,
the Hausman test does not indicate significant differences in the coefficients. Therefore, we provisionally choose random effects. After that, we apply Breusch and Pagan Lagrangian
Multiplier (BPLM) test for random effects in order to decide on using either pooled OLS or random effects in our analysis. This test is developed to detect the presence of random effects. In this test, the null hypothesis is that variances of groups are zero; that is, there is no
unobserved heterogeneity, meaning that all groups are similar. If the null is not rejected, the pooled regression model is appropriate. That is, if the p-value of BPLM test is below 0.05, we
reject the null, meaning that the random effects specification is the preferred one. If it is above 0.05, we prefer pooled OLS specification to carry out our regression. Table 2 shows a summary of estimation results that presents statistically significant coefficients and their
standard errors. Full details of estimation results are provided in Appendix 1; including full estimation output, number of observations and countries included in each model, results of
Hausman and BPLM tests and preferred specifications based on these tests. Appendix 1 also
18
shows the optimal number reform steps for each country group and efficiency indicator
depending on the coefficient estimates for reform score variable(s).
It is not easy to draw conclusions about the impact of extensive electricity market reforms in various countries from empirical work that focuses on a single market or from other country-specific anecdotal discussion of reform processes because neither type of study distinguishes
the effects of reform from country-specific features. Therefore, our empirical approach was to take advantage of the diversity in electricity reform patterns in various countries and to
control for income level variable to predict five efficiency indicators: (i) plant load factor, (ii) distance from optimal reserve margin, (iii) transmission and distribution losses as a fraction of power generated, (iv) net generation per employee in electricity industry, and (v) net
generation per employee in utility industries. Panel analysis of efficiency trends (using reform variable and country income level) offers objective evidence on the observed impact of
Table 2. Summary of estimation results
Dependent Variables →
Explanatory Variables ↓ Log of plant load factor
Distance from optimal reserve margin
Electricity losses as a fraction of power
generated
Log of net generation per employee in electricity industry
Log of net generation per employee in utility
industries
Reform score All countries 0.034***(4.1) -0.038***(-4.4) 0.02***(13.59) 0.022***(5.37) 0.019***(4.41)
Developed countries 0.043***(6.69) -0.032***(-3.48) 0.001**(2.14)
-
0.024***(6.89)
Developing countries in Africa NS
-0.119***(-3.79)
0.049***(6.02) -
Developing countries in America 0.026*(1.76) 0.036***(9.47) 0.116***(3.12)
Developing countries in Asia and Oceania 0.082***(5.29) -0.009*(-1.76) NS
Developing countries in Euro-Asia -0.066***(-4.81) 0.043***(8.83) -0.228***(-5.07)
Square of reform score All countries -0.006***(-5.77) 0.005***(5.37) -0.002***(-11.29)
-
-
Developed countries -0.006***(-7.34) 0.005***(4.63) 0.000***(-2.62) -
Developing countries in Africa NS
0.012***(3.89)
-0.008***(-5.45) -
Developing countries in America NS -0.004***(-8.74) -0.018***(-3.31)
Developing countries in Asia and Oceania -0.009***(-3.98) 0.002**(2.46) 0.023*(1.91)
Developing countries in Euro-Asia 0.004**(2.38) -0.005***(-6.94) 0.031***(6.89)
Log of GDP per capita All countries 0.265***(12.48) -0.141***(-5.07) -0.041***(-13.06) 0.785***(22.36) 0.581***(17.8)
Developed countries 0.157***(9.44) -0.176***(-5.74) -0.011***(-6.21)
-
0.642***(22.92) Developing countries in Africa 2.124***(9.72)
NS
NS -
Developing countries in America 0.12***(3.22) -0.044***(-4.71) 0.545***(6.16)
Developing countries in Asia and Oceania 0.098***(3.47) -0.036***(-3.93) 0.708***(5.15)
Developing countries in Euro-Asia 0.224***(6.01) -0.06***(-5.4) NS
Constant All countries -1.344***(-43.18) 0.785***(11.07) 0.185***(25.46) -1.392***(-8.91) -1.296***(-19.32)
Developed countries -1.292***(-29.91) 0.896***(10.97) 0.106***(23)
-
-1.441***(-11.13) Developing countries in Africa -0.968***(-15.38)
0.309***(2.89)
0.134***(4.16) -
Developing countries in America -1.099***(-23.71) 0.205***(12.05) -1.442***(-9.7)
Developing countries in Asia and Oceania -0.989***(-20.64) 0.183***(13.97) -1.717***(-29.36)
Developing countries in Euro-Asia -1.177***(-13.93) 0.217***(11.45) NS
Standard errors are shown in parentheses () after coefficients. “-”: Not a variable in the model.
“NS”: The coefficient is not significant even at 10% level. *** Coefficient that is significant at 1% level.
First of all, overall model estimation results for plant load factor indicator are in line with our
expectations. The results suggest that on average any additional reform step or a rise in income increases plant load factor (and thereby efficiency). However, the positive impact of
reform steps is limited up to 5 reform components. Any additional reform step after fifth one results in a decline in plant load factor (and therefore in efficiency). However, when we examine sub models in this category, we notice important differences among country groups.
For instance, in developing countries in Asia and Oceania and developed countries, the optimal number of reform steps is quite high (7 and 8 respectively), meaning that almost any
additional reform step in these countries increases efficiency in the power industry. On the other hand, optimal number for reform elements in developing countries in Euro-Asia region is 0, implying that any reform step in this area decreases efficiency in the sector. The impact
of reform score variable in this first group of models is quite limited. Even at its optimum, its impact of reform score on efficiency is less than 0.1% in any model. In contrast, income level
is an important determinant of efficiency level. For instance, overall model results imply that a 10% increase in GDP per capita results in 2.7% rise in plant load factor.
As for distance from optimal reserve margin variable, again results are more or less in conformity with our expectations, that is both reform score and income level variables seem
to be negatively correlated with distance from optimal reserve margin variable. Due to limited data, we could use observations on 25 developed and 3 developing countries for the models in this group. Our results suggest that reform steps have definitely contributed to efficiency but
again this impact is rather limited. For developed countries, optimum number of reform steps is 6 while this figure for developing countries is 8, suggesting that according to this criterion
21
The results for the third indicator, transmission and distribution losses as a fraction of power
generated, are completely in conflict with the assumptions towards increased efficiency in the sector to be realized as a result of reforms. There seems to be a positive relationship between
reform score and share of network losses, suggesting that any reform step increases the fraction of losses in total electricity supply and, therefore, reduces efficiency. For that reason, obviously, the optimal number of reform steps in terms of losses is zero for almost all
countries. The only exception to this trend is seen in countries in Asia and Oceania where the optimal number of reform steps is 4. Actually, the negative effect of market liberalization on
the network losses may be regarded as similar to the positive effect of market liberalization on the plant load factor and other efficiency indicators. Indeed, this result may conform to the economic theory that with the introduction of independent power producers (IPPs) network
losses exceed the network losses of a regulated vertically integrated monopoly (which was usually the market structure prior to liberalization) because as a result of unbundling (and
assuming that the grid access is distance independent) not only IPPs but also incumbents locate new power plants at locations which are optimized for other aspects than transmission losses7. In addition, in the overall model and all sub models, GDP per capita seems to be
negatively correlated to fraction of electricity losses, meaning that any increase in income level results in a decline in network losses, which confirms the idea that wealthier countries
use more advanced transmission and distribution technologies that minimize the network losses.
We could obtain net generation per employee variable using employment in electricity industry data for 17 countries. This figure rises to 60 if we use aggregate data on employment
in utility (electricity, gas and water) industries to construct this variable. To exploit both data,
22
we estimated models using variables created from both sources of data. To begin with, we
estimated models to explain the impact of reform process on net generation per employee in electricity industry using data from 17 countries. Our results show that all reform steps
contribute to sector efficiency by increasing the net generation per employee in the electricity sector. The income level variable is also positively correlated with this indicator and its impact is much stronger compared to reform score variable. For instance, net generation per
employee in the electricity sector increases about 0.2% when a developed country takes all 8 reform steps, while this indicator rises by 7.9% as a result of just a 10% increase in GDP per
capita. While evaluating these results it is better to keep in mind that estimation procedure for this model includes data on developed countries only.
To improve the extent of our analysis, we also use employment in utility (electricity, gas and water) industries variable as a proxy for efficiency in power industry. Our results for this
group of models are quite similar to those from previous group with the exception that reform steps seem to cause efficiency to decline in Euro-Asian developing countries. For developed countries and developing countries in America, reforms seem clearly to contribute to
efficiency. Similar to all previous models, the impact of reform score variable on employment level is again rather limited, while income variable is responsible for most of the variation in
efficiency levels.
Finally, in our empirical analysis, we witnessed that country specific features tend to have the
highest explanatory power. For instance, in Model 48, compared to Hungary, net generation
8 Cross-section fixed effects in Model 4 are as follows: Australia: 0.06, Austria: -0.43, Belgium: 0.16, Czech
23
per employee in electricity industry is 1.7% higher in South Korea due to country-specific
unobserved factors.
In a nutshell, the research results suggest that, after controlling for country-specific variables, panel estimation of various efficiency indicators as dependent variables confirms the expectation that power market reforms lead to higher efficiency levels. However, reforms
tend to have a very limited impact on efficiency levels. Our findings also imply that the reforms fail to decrease network losses. So, we found practical evidence implying that
introduction of a competitive model in electricity markets has an increasing effect on sector performance but this effect is rather small. Besides, in most cases, we see that country specific effects and income level tend to be important factors explaining variations in efficiency
levels. Overall, derived from empirical analysis, the paper concludes that the evidence, at least at this stage of reforms, neither verifies nor falsifies the argument that a liberal market model
based on competition is beneficial in terms of power market efficiency. We detected a very limited increase in performance as a result of reforms but this benefit may well disappear when we take into account the huge cost of the reform.
To sum up, based on our results, for the share of network losses indicator we reject
Hypothesis 1, but fail to reject Hypothesis 2. For all other efficiency indicators adapted in this study, we fail to reject the hypotheses. Overall, our results reveal that the progress toward the electricity market reform is associated with higher efficiency, although this impact is limited
and fluctuates a lot among country groups.
24
necessarily follow that the reform process is an indisputable success. Our empirical findings
suggest that the impact of reform process on efficiency levels is limited and that even full liberalization process increases efficiency by less than 1%. Besides, an increase in efficiency
is just one of the expectations from the reform and the process should be judged based on its overall impact (not only its impact on efficiency). Furthermore, it may well be argued that the reform process has just started or is still under progress in many countries and today it is too
early to measure its impact on sector performance. These and similar arguments cannot be rejected straight away. What we may argue correctly, however, is that as a result of reforms
some efficiency improvements have been materialized to a limited extent.
6. Limitations of the study
The research, however, may have a number of limitations, which we acknowledge. In fact, we
have no reason to believe that any of these limitations should be existent in our analysis, but cannot of course rule them out.
To begin with, like all other econometric studies on electricity reform, the issue of endogeneity can be raised in our study. In the context of efficiency in electricity industries, it
is likely that just as reform process affects efficiency, efficiency level in the industry can affect reform decisions. Besides, some variables in our model may be endogenously determined. In other words, explanatory variables in our model may influence each other, as
well as the pattern of efficiency levels. The analysis dealt to some extent with this potential problem by including country and year fixed effects. The country fixed effects control for
25
may be addressed by using instrumental and lagged variables and dynamic modeling but since
these require better data we cannot employ them here. This may be, of course, an area of future research, but we have ignored these possibilities here due to lack of data.
Second shortcoming originates again from the lack of data. Due to limited nature of our data set, we could not properly account for the impact of some other variables on efficiency in
power industries like institutional characteristics, technological innovations and changes to regulatory practices. For instance, a possible source of bias in our study is that the model does
not control for market power or dominant generation technology in the electricity industry.
Some aspects of electricity reforms are not readily quantifiable in physical units. The main
issue is that simple observation of the fact that some reform steps have been taken does not reflect their characteristics and extent (Jamasb et al., 2004). That is to say, objective
comparisons across countries are inherently difficult in any study and our analysis is not an exception. The main steps of electricity reform process are usually established progressively and have a qualitative dimension. Accounting for these measures with the use of dummy
variables does not reveal their true scope or intensity. To lessen the impact of this drawback, we did not use individual dummy variables for reform elements in this study. Instead, we
constructed an aggregate reform score variable that reflects extent of the reform process. Although such an approach seems a practical and reasonable representation of reform dimension, we cannot argue that we reflected all characteristics of the various reform
processes in our study.
26
distance between actual and optimal reserve margin variable are available for 28 countries, on
net generation per employee in utility industries for 60 countries and on net generation per employee in electricity industry for only 17 countries. There will be sample selection bias if
the countries making this data available have differing results for the dependent variables than those which do not make data available. Moreover, different countries may have different classifications and reporting conventions, so that observations in a given data series may not
have the same meaning across all countries. Taken together, any measurement error and omission of explanatory variables may bias estimates of coefficients in the models. However,
in our study, omitted variables may be captured at least in part by the country-specific effects, mitigating the potential for bias.
While our analysis serves as one of the first steps in assessing the impact of reform process on efficiency levels, much work remains to be done. There is still much room for improvement
within the models and data presented in this paper. A more complicated model that controls for the endogeneity might improve estimates by better controlling for factors that affect sector efficiency independent of reform process. Furthermore, as done in many other similar studies,
we treated large countries like United States, Australia, Canada and India, in which the development of liberalization varies from state to state, in the same way as developing
countries that came late to liberalization. Thus, in the future, we need to develop new methods to reflect the impact of the size and scale of the countries in our sample.
7. Conclusion
27
disaster), or its advocates may try to get general conclusions from some success stories of a
few reforming countries (e.g. NordPool). However, what is really needed is a complete study of the impact of reforms within the context of a well-defined model construction. Besides,
today, there are data on electricity market reforms going back about two decades and available data start to let us meaningfully establish which market model and industry structure optimize social welfare. This study tried to fill the gap by offering a macro level econometric
analysis on the possible effects of reform process.
One of the main expectations from power market reform has been the realization of vast efficiency improvements in the sector, while the question of whether moving from the central planning system to a deregulated electricity market can materialize this objective still remains
unexplored. Throughout the study, we focused on this issue by looking at the impact of reform steps on electricity industry efficiency. In the study, we used empirical econometric
models to observe the impact of electricity market reform score on power sector efficiency. Panel data from 92 countries covering the period from 1982 to 2008 were employed. We found that reform process causes efficiency in the industry to go up but its effect is limited.
Moreover, our findings showed that reform process has a negative impact on the efforts to reduce network losses.
It is obvious that present econometric evidence on the impact of the reform process is quite limited. So, there is a definite need for continued analyses of the effect of reforms in the
electricity industry. Much work needs to be done and there are ample opportunities for research in this area. In many countries, power market reform is still an on-going process, a
28
that it is too early to reach any concrete judgment for future policy suggestions based on the
results from this paper and other comparable studies. An exact calculation of the long-term effects of reforms on efficiency levels will require much additional study over longer periods
of time.
Acknowledgements
I would like to take this opportunity to thank various people and institutions without whose
extremely generous support the present paper would have hardly been prepared. First of all, I would like to thank my supervisors (Dr. Michael Pollitt and Prof. David Newbery from University of Cambridge) for all their helpful comments and suggestions. Special thanks are
due to Dr. Paul Kattuman, who provided me with the econometrics background that I have extensively exploited to prepare the present paper. I would like to extend my sincere thanks
and appreciation to Mr. Anthony Haynes (professionalandhigher.com), who helped me to improve the language of the paper. I am also grateful to the Cambridge Overseas Trust for awarding me a full scholarship that has financed my doctoral (PhD) studies at University of
Cambridge (UK). Besides, I really appreciate the contribution of EU, OECD/IEA, UN, US Energy Information Administration and World Bank into this study by providing essential
data. Further, I owe many thanks to my wife who has stood by me in difficult times. Last but not least, I would like to thank two anonymous referees for their very helpful comments on earlier drafts of the paper. The author is, of course, responsible for all remaining errors and
29 References
Bacon, R.W., Besant-Jones, J., 2001. Global Electric Power Reform, Privatization and
Liberalization of the Electric Power Industry in Developing Countries. Annual Review of Energy and the Environment 26, 331-359.
Erdogdu, E., 2011. The impact of power market reforms on electricity price-cost margins and
cross-subsidy levels: A cross country panel data analysis. Energy Policy 39, 1080-1092.
EU, 2010. EU KLEMS Database November 2008. European Union.
Eurostat, 2010. Eurostat Online Database: Employment by sex, age groups and economic activity. Eurostat.
Fiorio, C.V., Florio, M., Doronzo, R., 2007. The Electricity Industry Reform Paradigm in the European Union: Testing the Impact on Consumers, Consumers and Utility Reforms
in the European Union Conference, June 8-9, 2007, Milan.
IEA, 2010a. Electricity Information (Edition: 2009). International Energy Agency.
IEA, 2010b. Electricity Information (Edition: 2009), OECD Net Electrical Capacity.
International Energy Agency.
Jamasb, T., Newbery, D., Pollitt, M., 2004. Core Indicators for Determinants and
Performance of Electricity Sector Reform in Developing Countries, Cambridge Working Papers in Economics.
Ruffin, C., 2003. The Political Economy of Institutional Change in the Electricity Supply
Industry: Shifting Currents. Edward Elgar, Cheltenham.
Steiner, F., 2001. Regulation, industry structure and performance in the electricity supply
30
UN, 2010. UN Online Database: Employment by sex and industry branch, ISIC 2 (thousands;
ILO) [code 4660]. UN.
US EIA, 2010. International Energy Statistics. US Energy Information Administration.
World Bank, 2010a. World Bank Country Classifications, URL: http://go.worldbank.org/K2CKM78CC0.
World Bank, 2010b. World Development Indicators (Edition: April 2010). World Bank.
Zhang, Y.-F., Parker, D., Kirkpatrick, C., 2008. Electricity sector reform in developing countries: an econometric assessment of the effects of privatization, competition and
Appendices
Appendix 1: Estimation Results
Model
No Dependent variable Explanatory variables Coef. Std. Err. t-stat. p-value
# of # of Hausman Test BPLM Test Preferred Optimal # of reform
steps countries obs. Stat. p-value Stat. p-value Specific.
1.1 Log of plant load factor Reform score 0.034 0.008 4.100 0.00 87 2,046 29.16 0.0000 - - Fixed Ef. 5
(All countries) Square of reform score -0.006 0.001 -5.770 0.00 Log of GDP per capita 0.265 0.021 12.480 0.00
Constant -1.344 0.031 -43.180 0.00
1.2 Log of plant load factor Reform score 0.043 0.006 6.690 0.00 32 771 87.96 0.0000 - - Fixed Ef. 7
(Developed countries) Square of reform score -0.006 0.001 -7.340 0.00 Log of GDP per capita 0.157 0.017 9.440 0.00
Constant -1.292 0.043 -29.910 0.00
1.3 Log of plant load factor Reform score -0.106 0.077 -1.380 0.17 8 191 30.15 0.0000 - - Fixed Ef. 0
(Developing countries in Africa) Square of reform score -0.009 0.014 -0.620 0.54 Log of GDP per capita 2.124 0.218 9.720 0.00
Constant -0.968 0.063 -15.380 0.00
1.4 Log of plant load factor Reform score 0.026 0.014 1.760 0.08 18 468 73.11 0.0000 - - Fixed Ef. 8
(Developing countries in America) Square of reform score -0.002 0.002 -1.080 0.28 Log of GDP per capita 0.120 0.037 3.220 0.00
Constant -1.099 0.046 -23.710 0.00
1.5 Log of plant load factor Reform score 0.082 0.015 5.290 0.00 12 293 1.43 0.6979 899.83 0.0000 Random Ef. 8
(Developing countries in Asia and Oceania) Square of reform score -0.009 0.002 -3.980 0.00 Log of GDP per capita 0.098 0.028 3.470 0.00
32
1.6 Log of plant load factor Reform score -0.066 0.014 -4.810 0.00 17 323 2.80 0.4232 1054.40 0.0000 Random Ef. 0
(Developing countries in Euro-Asia) Square of reform score 0.004 0.002 2.380 0.02 Log of GDP per capita 0.224 0.037 6.010 0.00
Constant -1.177 0.084 -13.930 0.00
2.1 Distance from optimal reserve margin Reform score -0.038 0.009 -4.400 0.00 28 585 13.10 0.0044 - - Fixed Ef. 7
(All countries) Square of reform score 0.005 0.001 5.370 0.00 Log of GDP per capita -0.141 0.028 -5.070 0.00
Constant 0.785 0.071 11.070 0.00
2.2 Distance from optimal reserve margin Reform score -0.032 0.009 -3.480 0.00 25 526 22.20 0.0001 - - Fixed Ef. 6
(Developed countries) Square of reform score 0.005 0.001 4.630 0.00 Log of GDP per capita -0.176 0.031 -5.740 0.00
Constant 0.896 0.082 10.970 0.00
2.3 Distance from optimal reserve margin Reform score -0.119 0.031 -3.790 0.00 3 59 - - - - Fixed Ef. 8
(Developing countries) Square of reform score 0.012 0.003 3.890 0.00 Log of GDP per capita 0.092 0.074 1.250 0.22
Constant 0.309 0.107 2.890 0.01
3.1 Electricity losses as a fraction of power generated Reform score 0.020 0.002 13.590 0.00 89 2,117 0.99 0.8033 9257.20 0.0000 Random Ef. 0 (All countries) Square of reform score -0.002 0.000 -11.290 0.00
Log of GDP per capita -0.041 0.003 -13.060 0.00
Constant 0.185 0.007 25.460 0.00
3.2 Electricity losses as a fraction of power generated Reform score 0.001 0.001 2.140 0.03 32 793 15.86 0.0012 - - Fixed Ef. 0 (Developed countries) Square of reform score 0.000 0.000 -2.620 0.01
Log of GDP per capita -0.011 0.002 -6.210 0.00
Constant 0.106 0.005 23.000 0.00
3.3 Electricity losses as a fraction of power generated Reform score 0.049 0.008 6.020 0.00 9 218 0.02 0.9990 1331.39 0.0000 Random Ef. 0 (Developing countries in Africa) Square of reform score -0.008 0.002 -5.450 0.00
Log of GDP per capita -0.018 0.020 -0.870 0.39
Constant 0.134 0.032 4.160 0.00
3.4 Electricity losses as a fraction of power generated Reform score 0.036 0.004 9.470 0.00 18 468 6.00 0.1118 1976.21 0.0000 Random Ef. 0 (Developing countries in America) Square of reform score -0.004 0.001 -8.740 0.00
Log of GDP per capita -0.044 0.009 -4.710 0.00
33
3.5 Electricity losses as a fraction of power generated Reform score -0.009 0.005 -1.760 0.08 12 293 4.40 0.2210 667.67 0.0000 Random Ef. 4 (Developing countries in Asia and Oceania) Square of reform score 0.002 0.001 2.460 0.01
Log of GDP per capita -0.036 0.009 -3.930 0.00
Constant 0.183 0.013 13.970 0.00
3.6 Electricity losses as a fraction of power generated Reform score 0.043 0.005 8.830 0.00 18 345 4.93 0.1773 558.77 0.0000 Random Ef. 0 (Developing countries in Euro-Asia) Square of reform score -0.005 0.001 -6.940 0.00
Log of GDP per capita -0.060 0.011 -5.400 0.00
Constant 0.217 0.019 11.450 0.00
4 Log of net generation per employee in elec. ind. Reform score 0.022 0.004 5.370 0.00 17 322 0.25 0.8807 2247.70 0.0000 Random Ef. 8 (Developed countries) Log of GDP per capita 0.785 0.035 22.360 0.00
Constant -1.392 0.156 -8.910 0.00
5.1 Log of net generation per employee in utility ind. Reform score 0.019 0.004 4.410 0.00 60 1,011 6.68 0.0355 - - Fixed Ef. 8 (All countries) Log of GDP per capita 0.581 0.033 17.800 0.00
Constant -1.296 0.067 -19.320 0.00
5.2 Log of net generation per employee in utility ind. Reform score 0.024 0.004 6.890 0.00 32 645 2.73 0.2557 4600.53 0.0000 Random Ef. 8 (Developed countries) Log of GDP per capita 0.642 0.028 22.920 0.00
Constant -1.441 0.129 -11.130 0.00
5.3 Log of net generation per employee in utility ind. Reform score 0.116 0.037 3.120 0.00 14 166 1.65 0.6479 267.10 0.0000 Random Ef. 6 (Developing countries in America) Square of reform score -0.018 0.005 -3.310 0.00
Log of GDP per capita 0.545 0.088 6.160 0.00
Constant -1.442 0.149 -9.700 0.00
5.4 Log of net generation per employee in utility ind. Reform score -0.078 0.069 -1.130 0.26 8 124 46.30 0.0000 - - Fixed Ef. 0 (Developing countries in Asia and Oceania) Square of reform score 0.023 0.012 1.910 0.06
Log of GDP per capita 0.708 0.137 5.150 0.00
Constant -1.717 0.058 -29.360 0.00
5.5 Log of net generation per employee in utility ind. Reform score -0.228 0.045 -5.070 0.00 5 75 8.55 0.0359 - - Fixed Ef. 0 (Developing countries in Euro-Asia) Square of reform score 0.031 0.004 6.890 0.00
Log of GDP per capita -0.192 0.159 -1.210 0.23