Munich Personal RePEc Archive
Technical efficiency analysis of banks in
major oil exporting Middle East
countries
Onour, Ibrahim and Abdalla, Abdelgadir
University of Khartoum, Sudan
25 January 2011
Technical efficiency analysis of banks in major oil exporting
Middle East countries
Ibrahim A. Onour
Abdelgadir M. A Abdalla
Arab Planning Institute, P. O. Box 5834 Safat 13059, Kuwait, Emails: onour@api.org.kw;
ibonour@hotmail.com , Tel. 965-940-12953 (Corresponding author).
.
Technical efficiency analysis of banks in major oil exporting
Middle East countries
Ibrahim A. Onour
Abdelgadir M. A Abdalla
Abstracts
This paper investigates efficiency performance of thirty six banks operating in Gulf Cooperation Council (GCC) countries during the period 2006-20081. Our results indicate in general GCC banks showed considerable pure technical efficiency in the past three years with the year 2007 exhibit the most efficient year, as the number of pure technical efficient banks reached 33 percent of the total banks compared to 25 percent in 2008. The fall in technical efficiency in 2008 is due to simultaneous fall in pure technical efficiency and the scale efficiency. The output loss caused by scale inefficiency (fall of scale operations below optimum level) in 2008 is estimated 16 percent compared to 5 percent in 2007. Our results also indicate scale efficiency is inversely related to banks' size implying a major source of scale inefficiency in GCC banks is due to sub-optimal size of operations. It is also indicated in the paper that scale efficiency is inversely related to risk, implying effective risk management policies may also enhance scale efficiency.
1.
Introduction:In the past decade monetary authorities in GCC countries embarked on
regulatory reforms in the financial sector with the purpose of deepening
their capital markets and enhancing competitiveness of the banking
sector. In this context, laws have been enacted to improve prudential
regulations of commercial banks, anti-money laundering policies were
adopted and restrictions have been eased for capital mobility between
GCC countries. The outcome of these policy reforms has been substantial
surge in the banking activities as this can be viewed by the significant rise
in the number of banks operating in the region in the last few years. The
prudential regulations adopted by the central banks in GCC countries
aimed at enhancing a competitive environment while protecting the
banking industry from repercussions of financial markets. Further more,
1
the banking environment in GCC countries became more competitive in
the past few years as all GCC countries accessed World Trade
Organization (WTO) membership, which requires opening up banking
sectors to foreign competition. Also the increasing integration among
GCC capital markets enhanced the competitive nature of banking sector
in the region as entry barriers removed between member states. An
extensive literature has shown that higher levels of banks competition
lead to lower cost of banks’ services, increase access to finance, and
increase efficiency. Thus, the more competitive GCC banking industry is
becoming, it is less likely to deal with “too big to fail” scenario. As a
result, estimation of GCC banks’ efficiency performance based on their
ability of rendering maximum possible financial services at a given
available resources is helpful in exposing the competitive environment of
the banking sector. In this paper we employed Data Envelopment
Analysis (DEA) to investigate competitiveness in GCC banks based on
efficiency performance of 36 banks operating currently in GCC countries.
The DEA literature distinguishes two types of efficiency; technical
efficiency and allocative efficiency. The technical efficiency refers to the
ability of a decision-making unit (DMU) to produce as much output as
possible at a given input level, or, to produce a given level of output
employing the least possible input combination; whereas allocative
efficiency refers to cost-minimizing mix of inputs, at a given relative
input prices. Thus, technical efficiency allows minimization of input
waste, to the extent that further reduction of inputs become infeasible. As
a result, the DEA approach can enable banks to identify both sources of
relative cost inefficiency - technical and allocative. Reducing excess
inputs would increase technical efficiency, and selecting the
cost-minimizing mix of inputs, given relative input prices, would lead to
edge in the competition for private savings by competing more effectively
with relatively cost-inefficient competitors2.
In the past, DEA approach has been extensively employed in the banking
efficiency literature. Miller and Noulas (1996) applied DEA methodology
on North American banking sector. Unlike the case of large banks in US
and UK, which experience economies of scale, Rezvanian and Mehdian
(2002) show small and medium size commercial banks in Singapore
enjoy economies of scale. Darrat et al (2002) employed DEA on a
number of banks in Kuwait showing evidence of technical inefficiency.
Banks managers in GCC region should find results in this paper useful for
identifying their efficiency status and for understanding better the causes
of their success (or failure). This study may also benefit policy makers in
GCC countries to improve the overall efficiency of the banking industry
and to assess the degree to which domestic banks need reforms. While the
primary purpose of the paper to assess efficiency performance of banks,
we also investigate the sources of inefficiency by assessing the linkage
between efficiency scores and key financial ratios.
The reminder of the paper is organized as follows. Section two illustrates
basic features of GCC banking industry; section three present the
methodology of the research; the final sections include the empirical
analysis and the conclusion.
2- GCC banks: salient features
Some prominent features of the banking sector in GCC countries involve
its dependence on traditional deposits as the main source of funds, and
loans as the major source of income generation. As a result, the role of
corporate bonds and foreign liabilities is very limited in the asset
2
components of GCC banks. More specifically, it is indicated in the
financial statements of 2007 and 2008, that GCC banks’ deposits as a
ratio of total banks liabilities, was 60 per cent, while corporate bonds
constituted around 2 per cent of the total liabilities. On the asset side,
loans and Islamic finance products take the highest proportion among the
asset components, as they make about 50 percent of the total assets
value in 2008 and 2007. The role of investment securities in the assets of
GCC banks vary from a country to another, as they range between 23
percent in Saudi Arabia, and 8 percent in Qatar. Also to be noted that
GCC banking sector is susceptible to high risk exposure due to
concentration of finance in a few sectors in the economy including real
estate and construction as well as household credits3. Financial statements
in 2008 also indicate banks in GCC countries (with exception of Saudi
Arabia) allocated 55 percent of total banks credit to real estate and
household finances. However, allocation of funds in Saudi banks is
relatively less skewed compared to other GCC banks, as the allocation of
funds to real estate and household declines to 30 percent.
In terms of ownership, the banking sector in GCC countries is largely
dominated by private domestic ownership, revealing some kind of entry
barriers for foreign non-GCC investors. The data in table (1), divide
ownership structure into five categories, including, private domestic;
foreign GCC; foreign non-GCC; government; and royal family
ownership. The absence of foreign non-GCC ownership in GCC banking
sector is evidence of presence of strong barriers against non-GCC foreign
ownership in a number of countries especially in Kuwait, Qatar, and
UAE. However, it seems there is a substantial cross-border ownership
among some GCC states (with exception of Saudi Arabia and Kuwait), as
the percentage of foreign GCC ownership is quite significant. It is also to
3
be noted that there is quite considerable government presence in GCC
banks ownership, notably in Saudi Arabia and UAE, where the
government ownership reaches up to 70 in some banks operating in these
countries. As contrary to the common perception, royal families
ownership in GCC banks is very minimal except in UAE.
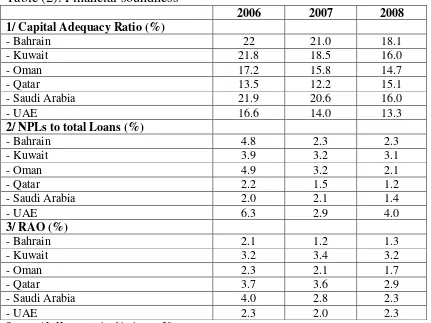
Financial soundness ratios presented in table (2) indicate, banks in GCC
countries are well capitalized as the capital adequacy ratios during the
period 2006 – 2008, are well above the minimum required levels, and as
the declining ratios of the non-performing loans reveal prudential
regulation soundness4. Despite the high quality of assets, reflected by the
low ratios of the non-performing loans in all GCC banks, the profitability
measure indicated by return-on-asset ratios (ROA) are a bit below the
standard international levels for most of GCC banks, indicating resource
under utilization. The ranking of the GCC banks in terms of key financial
ratios including deposits, and investments, show banks in Saudi Arabia
and United Arab Emirates lead GCC banks in terms of size indicators,
while banks in Sultinate Oman ranked among the smallest in the group.
4
Table (1): Banks ownership structure*
Ownership (%) Number of Banks
Bahrain 11
- Private domestic 100 to 33 9
- Foreign GCC 65 to 5 9
- Non-GCC 66 1
- Government 49 to 4 2
- Royal Family - -
Kuwait 9
- Private domestic 100 to 51 9
- Foreign GCC - -
- Non-GCC - -
- Government 49 to 2 4
- Royal Family - -
Oman 7
- Private domestic 90 to 16 7
- Foreign GCC 35 to 15 3
- Non-GCC 49 to 10 3
- Government 27 to 7 5
- Royal Family 10 1
Qatar 9
- Private domestic 100 to 50 9
- Foreign GCC 40 to 10 3
- Non-GCC - -
- Government 50 to 18 2
- Royal Family - -
Saudi 11
- Private domestic 100 to 20 11
- Foreign GCC - -
- Non-GCC 40 to 3 7
- Government 70 to 6 9
- Royal Family - -
UAE 19
- Private domestic 100 to 20 19
- Foreign GCC 20 to 11 3
- Non-GCC - -
- Government 77 to 3 16
- Royal Family 70 to 12 6
* For the year 2008.
[image:8.595.101.491.97.716.2]Table (2): Financial soundness
2006 2007 2008
1/ Capital Adequacy Ratio (%)
- Bahrain 22 21.0 18.1
- Kuwait 21.8 18.5 16.0
- Oman 17.2 15.8 14.7
- Qatar 13.5 12.2 15.1
- Saudi Arabia 21.9 20.6 16.0
- UAE 16.6 14.0 13.3
2/ NPLs to total Loans (%)
- Bahrain 4.8 2.3 2.3
- Kuwait 3.9 3.2 3.1
- Oman 4.9 3.2 2.1
- Qatar 2.2 1.5 1.2
- Saudi Arabia 2.0 2.1 1.4
- UAE 6.3 2.9 4.0
3/ RAO (%)
- Bahrain 2.1 1.2 1.3
- Kuwait 3.2 3.4 3.2
- Oman 2.3 2.1 1.7
- Qatar 3.7 3.6 2.9
- Saudi Arabia 4.0 2.8 2.3
- UAE 2.3 2.0 2.3
Source: AL-Hassan et al, table 4, page 20.
3- Methodology:
Several alternative DEA models have been employed in banks efficiency
literature. The DEA models differ according to difference in the shape of
the efficient frontier. In this paper we employed two DEA models. We
use the CCR (Charnes, Cooper, and Rohdes, 1978), and BCC (Banker,
Charnes, and Cooper, 1984). The CCR and BCC models differ as the
former evaluates scale as well as technical inefficiencies simultaneously,
whereas the latter evaluates pure technical efficiency. In other words, for
a DMU to be considered as CCR efficient, it should be both scale and
pure technically efficient. For a DMU to be BCC efficient, it only needs
to be pure technically efficient. As a result, the ratio of CCR efficiency
score over the BCC score gives the scale efficiency index. The main
[image:9.595.84.515.99.422.2]efficient frontiers of the DMUs in the sample, under the assumptions of
constant return to scale and change in return to scale. There are two
directions, input-oriented approach that aims at reducing the input
amounts by as much as possible at a given level of output, and the
output-oriented, approach that maximizes output levels at a given input level.
In the following we discuss briefly the main concepts behind each of
these models.
3.1: Basic DEA models:
In vector and matrix notation the input-oriented CCR model, with a real
variable and a non-negative vector T n)
,.. (1
of variables can be
expressed as:
(LP0) min (1)
subject to:
0
0 x
x
(2)
0
0 y
y (3)
0
(4)
Where y0 and x0 are respectively the output and the input levels related to
the specific DMU0 under investigation, and y and x are matrices denoting
output and input variables. The objective function in equation (1)
minimizes the input level, whereas the constraints in equations (2) and (3)
constrain the minimization of input within a feasible region, and equation
(4) stipulates non-negativity constraint of the input and output weights.
The problem (LP0) has a feasible solution at =1, 0 1, i 0(j0).
Hence the optimal , denoted by *, is not greater than 1. On the other
because y0>0. Putting all this together, we have0* 1. The input
excesses S and the output shortfalls S can be identified as:
x x
S 0 (5)
y y
S 0 (6)
With S 0, S 0 for any feasible solution (,)of DLP0.
If an optimal solution ( * * * *
, ,
, S S
) above satisfies *=1 with
zero-slacks (S* 0,S* 0), then the DMU0 is called CCR-efficient.
Otherwise, the DMU0 is called inefficient. Thus, full
CCR-efficiency needs to satisfy:
(i) *=1
(ii) All slacks are zero.
The first of these two conditions is referred to as “radial efficiency”. It is also referred to as “technical efficiency” because a value of *
<1 means
that all inputs can be simultaneously reduced without altering the
proportion in which they are utilized. Because (1-*) is the maximal
proportionate reduction allowed by the production possibility set, any
further reductions associated with nonzero slacks will necessarily change
the input proportions5. Hence the inefficiencies associated with any
nonzero slack identified in the above two phase procedure are referred to as “mix inefficiencies”. “Weak efficiency” is sometime used when attention is restricted to condition (i). The conditions (i) and (ii) taken together describe what is also called “Pareto-Koopmans” efficiency. The weak efficiency also called “Farrell efficiency” because nonzero slack, when present in any input or output, can be used to effect additional
5
improvements without worsening any other input or output. On the other
hand CCR-efficiency refers to satisfaction of both (i) and (ii) conditions.
The input-oriented BCC model evaluates the efficiency of DMU0
(0=1,...n) by adding to the constraints in (2) – (4), the new constraint
1
e , and solving for the minimum objective function in equation (1).
It is clear that difference between CCR and BCC models is present in the
free variable u0, which is the dual variable associated with the constraint
which also does not appear in the CCR model.
If BBC0 satisfiesB*=1 and has no slack ( 0
*
S ,S* 0) then the DMU0
is called BCC-efficient, otherwise it is BCC-inefficient.
Figure (1)
Output
Input
Figure 1, exhibits the DMUs, A, R, B, q, and D each with one output and
one input. The efficient frontier of the CCR model is the line (OAC), that
passes through the origin. The frontier of the BCC model consists of the
lines connecting v, R, q and D. The production possibility set is the area
enclosing the frontier lines. At point B, a DMU is CCR and BCC
inefficient. But at point q, a DMU is CCR and BCC efficient. Generally,
the CCR-efficiency does not exceed BCC-efficiency. The inefficiency
score of the point B inside the frontier according to CCR model is
A
B C
D
R
F
O
F
[image:12.595.98.409.355.552.2]computed as ratio FA/FB (reflecting how close point B would be to point
A, along the radial line OC). Thus, according to CCR model a DMU
should reduce its inputs by (1i) in order to be at the efficiency frontier
at point A. However, when the BCC model (variable return to scale
technology) is taken into account, the overall technical efficiency reveal
pure technical efficiency, which is given by the ratioFR/FBi, which
measures the scope for efficiency improvement at current scale of
operation. It is important to note that scale efficiency can be affected by
poor management within the organization or disadvantageous operating
environment. Thus, scale efficiency which is i i / measures the
extent to which a bank can take advantage of return-to-scale by altering
its size towards optimal scale. The fraction of output lost due to scale
inefficiency can be computed as(1i). Scale efficiency equal one unit at
any point along the CCR frontier line OC, at which production
technology exhibits constant return to scale. Scale inefficiency can arise
due to variable (increasing or decreasing) return to scale. On the other
hand, pure technical inefficiency occurs because a DMU uses more inputs
than needed (input waste). Alternatively, pure technical inefficiency can
be can be caused by inefficient implementation of the production plan in
converting inputs to outputs (managerial inefficiency). However scale
inefficiency could be due to divergence of DMU from the most
productive scale size. Therefore decomposing technical efficiency into
pure technical and scale efficiencies allows us to gain insight into the
main source of inefficiency.
3.2: Regression Analysis:
An important question to be addressed at this stage is: how efficiency
scores of banks are associated with key financial drivers? The standard
financial ratios on the efficiency scores of banks in each country. The
financial ratios include profitability measures represented by
return-on-assets (ROA); a measure of risk management denoted by loan-to-deposits
ratio (LDR); and a measure of a bank size represented by the ratio of each
bank's deposit to total banks’ deposits in each country. The LDR variable
is meant to reflect the relationship between efficiency and risk taking
propensity, in which higher LDR implies a higher risk propensity.
The dependent variable in each panel regression includes the efficiency
scores of CCR and scale efficiency. The panel data covers the sample
period 2006-2008, treating banks in each country as a panel. The
regression equations can be expressed as:
ce independen tion cross j i f or e e E and e E where N i t f or e X Y jt it i it i it it it sec 0 ) ( ) ( . ,... 2 , 1 ; 3 , 2 , 1 2 2
Where y is efficiency scores, and the x vector is the explanatory
variables (ROA, LDR, and the bank size variable), and Ni is the number
of banks in each country. A Lagrange multiplier statistics can be
employed to test for the heteroscedasticty. The null-hypothesis of
homoscedasticity can be rejected if the statistic exceeds the critical value
from a Chi-square distribution with N-1 degrees of freedom6.
6
4. Results and analysis
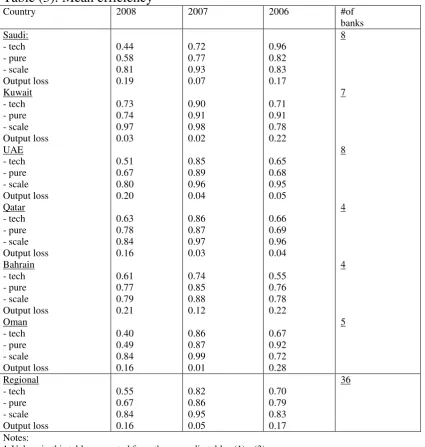
Since our primary concern in this study is country level analysis, rather
than individual bank analysis, table (3) present the mean efficiency scores
of the banking industry in GCC countries during the sample period 2006
-2008. On regional level, the overall technical efficiency fell in 2008, by
32 per cent comparedto its level in 2007, due to simultaneous fall in pure
technical efficiency by 22 per cent and the scale efficiency by 11 per cent.
The output loss due to scale inefficiency in 2008 estimated as 16 percent
compared to 5 percent in 2007. A similar result can also be concluded
from the appendix tables 4 &5, as the number of GCC banks which are
pure technical efficient fell in 2008 to 25 percent compared to 33 percent
in the preceding year. Table (3) also shows that the contribution of pure
technical efficiency in the overall technical efficiency is relatively smaller
compared to the scale efficiency contribution across all GCC countries.
This implies the overall technical efficiency in GCC banks can be
improved by targeting some key financial ratios associated with pure
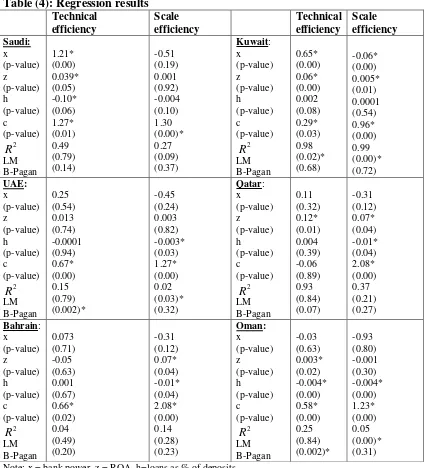
technical efficiency. The regression results in table (4), present the
relationship between the efficiency scores and some financial ratios. The
financial ratios include a measure of profitability denoted by
return-on-assets; a measure of risk variable denoted by loan-to-deposit ratio; and a
bank size variable represented by the ratio of bank's deposit to the total banks’ deposits in each country. Results in table (4) reveal that scale efficiency is inversely related to banks' size (though insignificant for all
except Kuwait) implying a major source of scale inefficiency in GCC
banks is sub-optimal size of operations. A similar result can also be
concluded from appendix tables (1) & (8), as the top five largest banks in
terms of deposit and investment capital in 2008, experienced scale
five banks in the group experienced scale inefficiency due to increasing
return to scale7. It is also indicated in the table that scale efficiency is
inversely related to the risk variable, indicating effective risk
management policies can enhance scale efficiency. Since the impact of
the three explanatory variables is more significant on pure technical
efficiency compared to scale efficiency in Saudi banks, it is very likely
that the overall technical efficiency in Saudi banks can be improved by tackling the banks’ size and the risk variables.
7
Table (3): Mean efficiency
Country 2008 2007 2006 #of
banks Saudi: - tech - pure - scale Output loss Kuwait - tech - pure - scale Output loss UAE - tech - pure - scale Output loss Qatar - tech - pure - scale Output loss Bahrain - tech - pure - scale Output loss Oman - tech - pure - scale Output loss 0.44 0.58 0.81 0.19 0.73 0.74 0.97 0.03 0.51 0.67 0.80 0.20 0.63 0.78 0.84 0.16 0.61 0.77 0.79 0.21 0.40 0.49 0.84 0.16 0.72 0.77 0.93 0.07 0.90 0.91 0.98 0.02 0.85 0.89 0.96 0.04 0.86 0.87 0.97 0.03 0.74 0.85 0.88 0.12 0.86 0.87 0.99 0.01 0.96 0.82 0.83 0.17 0.71 0.91 0.78 0.22 0.65 0.68 0.95 0.05 0.66 0.69 0.96 0.04 0.55 0.76 0.78 0.22 0.67 0.92 0.72 0.28 8 7 8 4 4 5 Regional - tech - pure - scale Output loss 0.55 0.67 0.84 0.16 0.82 0.86 0.95 0.05 0.70 0.79 0.83 0.17 36 Notes:
[image:17.595.87.513.99.547.2]Table (4): Regression results Technical efficiency Scale efficiency Technical efficiency Scale efficiency Saudi: x (p-value) z (p-value) h (p-value) c (p-value) 2 R LM B-Pagan 1.21* (0.00) 0.039* (0.05) -0.10* (0.06) 1.27* (0.01) 0.49 (0.79) (0.14) -0.51 (0.19) 0.001 (0.92) -0.004 (0.10) 1.30 (0.00)* 0.27 (0.09) (0.37) Kuwait: x (p-value) z (p-value) h (p-value) c (p-value) 2 R LM B-Pagan 0.65* (0.00) 0.06* (0.00) 0.002 (0.08) 0.29* (0.03) 0.98 (0.02)* (0.68) -0.06* (0.00) 0.005* (0.01) 0.0001 (0.54) 0.96* (0.00) 0.99 (0.00)* (0.72) UAE: x (p-value) z (p-value) h (p-value) c (p-value) 2 R LM B-Pagan 0.25 (0.54) 0.013 (0.74) -0.0001 (0.94) 0.67* (0.00) 0.15 (0.79) (0.002)* -0.45 (0.24) 0.003 (0.82) -0.003* (0.03) 1.27* (0.00) 0.02 (0.03)* (0.32) Qatar: x (p-value) z (p-value) h (p-value) c (p-value) 2 R LM B-Pagan 0.11 (0.32) 0.12* (0.01) 0.004 (0.39) -0.06 (0.89) 0.93 (0.84) (0.07) -0.31 (0.12) 0.07* (0.04) -0.01* (0.04) 2.08* (0.00) 0.37 (0.21) (0.27) Bahrain: x (p-value) z (p-value) h (p-value) c (p-value) 2 R LM B-Pagan 0.073 (0.71) -0.05 (0.63) 0.001 (0.67) 0.66* (0.02) 0.04 (0.49) (0.20) -0.31 (0.12) 0.07* (0.04) -0.01* (0.04) 2.08* (0.00) 0.14 (0.28) (0.23) Oman: x (p-value) z (p-value) h (p-value) c (p-value) 2 R LM B-Pagan -0.03 (0.63) 0.003* (0.02) -0.004* (0.00) 0.58* (0.00) 0.25 (0.84) (0.002)* -0.93 (0.80) -0.001 (0.30) -0.004* (0.00) 1.23* (0.00) 0.05 (0.00)* (0.31) Note: x = bank power, z = ROA, h=loans as % of deposits.
5. Concluding remarks:
To measure technical efficiency of commercial banks in GCC countries
we used Data Envelopment Analysis (DEA) based on the intermediation
approach of banking services, which entails banks produce financial
services using inputs. The input variables include salaries & wages and
deposits; while the output variables include loans and net incomes8. The
sample period of the research extend from 2006 to 2008, and includes
thirty six banks operating currently in GCC countries. Our results indicate
in general GCC banks showed considerable pure technical efficiency in
the past three years, with the year 2007 exhibits the most efficient year, as
the number of efficient banks reached 33 percent compared to 25
percent in 20089. It is interesting to realize that GCC banks experienced
some inefficiencies in the year 2008 as this was the year of international
financial crisis and crude oil price fall from over hundred dollars per
barrel. The fall in overall technical efficiency in 2008 is due to
simultaneous fall in pure technical efficiency and the scale efficiency.
The output loss due to scale inefficiency (divergence of output from its
optimum scale level) in 2008 is estimated 16 percent compared to 5
percent in 200710. It is also indicated, the contribution of pure technical
efficiency in the overall technical efficiency is relatively smaller
compared to the scale efficiency contribution across all GCC countries.
This imply the overall technical efficiency in GCC banks can be
improved by targeting some key financial ratios that influence pure
technical efficiency. These financial ratios include a measure of
profitability, measured by return-on-assets; a measure of risk indicator
8
Other studies define inputs as total expenses on labor (salaries & wages), capital (book value of fixed assets) and deposits (demand and saving deposits).
9
Technical efficiency can be divided into pure technical efficiency which implies efficient
implementation of production plan of converting inputs into outputs; and scale efficiency which refers to scaling banks services to the most productive scale size.
10
Technical efficiency can be divided into pure technical efficiency which implies efficient
denoted by loan-to-deposit ratio; and a measure of bank size represented
by the ratio of bank's deposit to the total banks’ deposits in each country.
Our results indicate scale efficiency is inversely related to banks' size
(though insignificant for all except Kuwait) implying a major source of
scale inefficiency in GCC banks is sub-optimal size of operations. It is
also indicated in the paper that scale efficiency is inversely related to the
risk variable, implying effective risk management policies may also
enhance scale efficiency. Since the impact of the three explanatory
variables is more significant on pure technical efficiency compared to
scale efficiency in Saudi banks, it is very possible that the overall
References:
AL-Hassan A., Khamis M., Oulid N., (April 2010) “The GCC banking sector:
topology and analysis” IMF, WP/10/87.
Banker, R.D; Charnes A.; Cooper, W., (1984) “Some Models for Estimating Technical and Scale Inefficiencies in Data Envelopment Analysis” Management
Science, 30, pp.1078 – 1092.
Charnes A.; Cooper W; and Rhodes E., (1978) “Measuring the Efficiency of
Decision Making Units” European Journal of Operation Research, 2, pp.429-444.
Charnes A.; Cooper W.; Lewin A.; and Seiford L. (Eds.), 1994: Data Envelopment Analysis: Theory, Methodology, and Application, Kluwer Academic Publishers, Boston, MA.
Charnes, A.; Cooper W.; Golany B; Seiford L.; Stutz J. (1985) "Foundations of Data Envelopment Analysis for Pareto-Coopmans Efficient Empirical Production Functions" Journal of Econometrics, 30 (1-2),pp.91-107.
Darrat A.; Topuz C.; and Yousef T., (2002) “Assessing Cost and Technical Efficiency of Banks in Kuwait” Economic Research Forum, 8th
annual conference, Cairo.
Drake, L.; and Hall, M. (2003) "Efficiency in Japanese Banking: An Empirical Analysis" Journal and Banking and Finance, 27, pp.891-917.
Miller S, and Noulas A., (1996) “The Technical Efficiency of Large Bank
Production, Journal of Banking and Finance, 20, pp. 495 – 509.
Rezvanian R.; and Mehadian S., (2002) “An Examination of Cost Structure and
Appendix (1): Efficiency scores (2008)
Bank
Technical efficiency
Pure technical efficiency
Scale efficiency
RTS
Riyad Bank 0.448 0.591 0.758037 Decreasing
Bank Al Jazira 0.312 0.325 0.96 Increasing
SAIB 0.452 0.457 0.989059 Increasing
SHB 0.365 0.374 0.975936 Decreasing BSF 0.546 0.755 0.723179 Decreasing
SABB 0.459 0.609 0.753695 Decreasing
ANB 0.446 0.561 0.795009 Decreasing SAB 0.542 1.00 0.542 Decreasing
NBK 1.00 1.00 1 Constant
GULF BANK 0.571 0.573 0.99651 Increasing
CBK 1.00 1.00 1 Constant
ABK 0.225 0.273 0.824176 Increasing BKM 0.697 0.700 0.995714 Increasing
KIB 1.00 1.00 1 Constant
burgan bank 0.641 0.649 0.987673 Decreasing
NBZ 0.579 0.852 0.679577 Decreasing ZCB 0.545 0.565 0.964602 Decreasing CBI 0.338 0.382 0.884817 Increasing FGB 0.662 0.875 0.756571 Decreasing UNB 0.551 0.554 0.994585 Increasing CBD 0.559 0.569 0.982425 Decreasing EBI 0.396 1.00 0.396 Decreasing
mashreq bank 0.464 0.600 0.773333 Decreasing
NBB 1.00 1.00 1 Constant
BBK 0.531 0.564 0.941489 Increasing AUB 0.362 0.526 0.688213 Decreasing BSB 0.555 1.00 0.555 Increasing
Ahli bank 0.336 0.606 0.554455 Increasing
BDOF 0.420 0.475 0.884211 Increasing
bank muscat 0.439 0.467 0.940043 Decreasing
NBO 0.417 0.445 0.937079 Increasing OIB 0.422 0.475 0.888421 Increasing QNB 0.644 1.00 0.644 Decreasing CBQ 0.856 1.00 0.856 Decreasing
Doha bank 0.579 0.604 0.958609 Decreasing
ABQ 0.476 0.526 0.904943 Increasing
Note: See appendix for the acronyms under DMUs.
Appendix (2): Efficiency scores (2007)
Bank
Technical efficiency
Pure technical efficiency
Scale
efficiency RTS
Appendix (3): Efficiency scores (2006)
Bank
Technical efficiency
Pure technical efficiency
Scale
efficiency RTS
Appendix 4: Efficiency scores (2008-2006)
Bank
Technical efficiency
Pure technical efficiency
Scale efficiency
Riyad Bank 0.5753 0.687653 0.830025
Bank Al Jazira 0.741453 0.749387 0.982767
SAIB 0.658827 0.682587 0.97283
SHB 0.480737 0.514063 0.94021
BSF 0.689577 0.87536 0.78784
SABB 0.577013 0.698677 0.821343
ANB 0.58237 0.663283 0.870582
SAB 0.660297 1 0.660297
NBK 0.892427 1 0.892427
GULF BANK 0.808443 0.811243 0.996529
CBK 0.998393 1 0.998393
ABK 0.49444 0.554147 0.874546
BKM 0.7324 0.740343 0.989036
KIB 0.768447 0.78715 0.967357
burgan bank 0.791477 0.79842 0.99016
NBZ 0.724773 0.826457 0.876164
ZCB 0.848333 0.855 0.988201
CBI 0.56613 0.598973 0.93098
FGB 0.7248 0.807227 0.905615
UNB 0.688977 0.69678 0.989184
CBD 0.700853 0.710197 0.985307
EBI 0.557707 0.83846 0.710179
mashreq bank 0.58311 0.668183 0.865834
NBB 0.70382 0.708037 0.993467
BBK 0.64317 0.66429 0.965363
AUB 0.61691 0.842 0.725648
BSB 0.581973 1 0.581973
Ahli bank 0.778667 0.868667 0.851485
BDOF 0.661533 0.703977 0.930296
bank muscat 0.648447 0.692877 0.929285
NBO 0.62387 0.654703 0.944984
OIB 0.528893 0.56331 0.934625
QNB 0.69323 0.828247 0.860862
CBQ 0.8599 0.931553 0.922235
Doha bank 0.728143 0.74048 0.980639
ABQ 0.605493 0.63733 0.946422
Appendix 5: Ranking leading indicators
DMU Deposits Net proft investment
Riyad Bank 6 7 4
Bank Al Jazira 26 26 20
SAIB 17 23 12
SHB 16 19 15
BSF 8 9 9
SABB 5 8 6
ANB
9 11 7
SAB 3 2 1
NBK 10 3 10
Gulf bank 15 16 22
CBK 18 15 26
ABK 19 34 23
BKM 25 24 27
KIB 31 25 30
Burgan bank 20 18 29
NBZ 4 5 13
ZCB 11 13 17
CBI 32 33 33
FGB 12 10 14
UNB 14 17 25
CBD 23 21 24
EBI 1 1 2
Mashreq bank 13 12 8
NBB 27 27 21
BBK 30 28 19
AUB 2 4 3
BSB 36 36 31
Ahli bank 35 35 35
BDOF 34 32 36
Bank Muscat 22 22 18
NBO 29 29 32
OIB 33 31 34
QNB 7 6 11
CBQ 21 14 16
Doha bank 24 20 5
ABQ 19 34 28
Appendix 6: Key to abbreviations and acronyms Country Bank's Name Acronym Saudi Arabia Riyad Bank Riyad Bank
Bank Al Jazira Bank Al Jazira The Saudi Investment Bank SAIB
Saudi Hollandi Bank SHB Banque Saudi Fransi BSF
The Saudi British Bank SABB Arab National Bank ANB
Saudi American Bank SAB
Kuwait National bank of kuwait NBK
Gulf bank Gulf bank
The commercial bank of kuwait CBK Al-ahly bank of kuwait ABK Bank of kuwait and middle east BKM kuwait international bank KIB
Burgan bank Burgan bank
UAE National bank of abu dhabi NBZ Abu dhabi commercial bank ZCB Commercial bank international CBI
First gulf bank FGB
Union national bank UNB Commercial bank of dubai CBD Emirates bank international EBI
Mashreq bank Mashreq bank
Bahrain National bank of bahrain NBB Bank of Bahrain & kuwait BBK Al Ahli united bank AUB The bahraini saudi bank BSB
Oman Ahli bank Ahli bank Bank dhofar al omani al fransi BDOF
Bank moscat Bank moscat
National bank of oman NBO Oman international bank OIB
Qatar Qatar national bank QNB The commercial bank of qatar CBQ
Doha bank Doha bank