www.impactjournals.com/oncotarget/ Oncotarget, 2016, Vol. 7, (No. 50), pp: 82440-82449
Identification of self-interacting proteins by exploring
evolutionary information embedded in PSI-BLAST-constructed
position specific scoring matrix
Ji-Yong An1,*, Zhu-Hong You2,*, Xing Chen3, De-Shuang Huang4, Zheng-Wei Li1,
Gang Liu5, Yin Wang1
1School of Computer Science and Technology, China University of Mining and Technology, Xuzhou 21116, China 2Xinjiang Technical Institute of Physics and Chemistry, Chinese Academy of Science, Urumqi 830011, China
3School of Information and Electrical Engineering, China University of Mining and Technology, Xuzhou 221116, China 4School of Electronics and Information Engineering, Tongji University, Shanghai 201804, China
5College of Computer Science and Software Engineering, Shenzhen University, Shenzhen, Guangdong 518060, China *joint First Authors
Correspondence to: Zhu-Hong You, email: [email protected] Xing Chen, email: [email protected]
De-Shuang Huang, email: [email protected]
Keywords: disease, position-specific scoring matrix, protein self-interaction, cancer
Received: June 29, 2016 Accepted: September 28, 2016 Published: October 08, 2016
ABSTRACT
Self-interacting Proteins (SIPs) play an essential role in a wide range of biological processes, such as gene expression regulation, signal transduction, enzyme activation and immune response. Because of the limitations for experimental self-interaction proteins identification, developing an effective computational method based on protein sequence to detect SIPs is much important. In the study, we proposed a novel computational approach called RVMBIGP that combines the Relevance Vector Machine (RVM) model and Bi-gram probability (BIGP) to predict SIPs based on protein sequence. The proposed prediction model includes as following steps: (1) an effective feature extraction method named BIGP is used to represent protein sequences on Position Specific Scoring Matrix (PSSM); (2) Principal Component Analysis (PCA) method is employed for integrating the useful information and reducing the influence of noise; (3) the robust classifier Relevance Vector Machine (RVM) is used to carry out classification. When performed on yeast and human datasets, the proposed RVMBIGP model can achieve very high accuracies of 95.48% and 98.80%, respectively. The experimental results show that our proposed method is very promising and may provide a cost-effective alternative for SIPs identification. In addition, to facilitate extensive studies for future proteomics research, the RVMBIGP server is freely available for academic use at http://219.219.62.123:8888/RVMBIGP.
INTRODUCTION
Whether proteins can interact with their partners is a crucial problem for fundamental research. Self-interacting proteins (SIPs) is a special type of PPIs. SIPs are those whose more than two copies can interact with each other. Two SIP partners can be represented by the same gene and are the same copies, which can result in the formation of homo-oligomer. Knowledge of SIPs whether can play an important role in biological process and provides insight
computational methods for identifying SIPs based on protein sequence.
In recent years, a number of computational approaches proposed to predict PPIs. Such as, R Jansen et al. [2] proposed a method employing Bayesian networks for predicting protein-protein interactions genome-wide on yeast dataset, which obtained good prediction results. A Benhur et al. [3] proposed a kernel method to predict PPIs using protein sequences, which converts a kernel between single proteins into a kernel between pairs of proteins. The effectiveness of the method was evaluated
using support vector machine classifier. Zahiri J et al. [4] proposed a computational method named as PPIevo to detect PPIs. The evolutionary information can be captured
from PSSM (Position-Specific Scoring Matrix) of protein
sequence employing the PPIevo approach. J Shen et al. [5] presented an approach to predict PPI by using only protein sequence’s information. The approach employed a machine learning algorithm (support vector machine). These methods usually consider for the correlational information between protein pairs, for instance, co-expression, co-localization and coevolution [1]. However, this information is not available for detecting SIPs. In addition, the datasets that not contain SIPs used to predict PPIs. Because of these reasons, these computational
methods are not fit for detecting SIPs. N Zaki et al. [6] proposed an approach called as PPI-PS (Pairwise Similarity) to predict PPIs. The PPI-PS combined pairwise similarity score with support vector machine (SVM) for detecting PPIs. The PPI-PS obtained reasonable experimental results for predicting PPIs. In the past study, Liu et al. [7] proposed a method integrating several representative known properties to create a prediction mode called as SLIPPER to predicting SIPs. There exists a variously disadvantage that the method can only dispose of these proteins that the current human interatomic contains. Due to the limitations of the aforementioned methods, there exists a critical challenge to develop automated methods for SIPs detection.
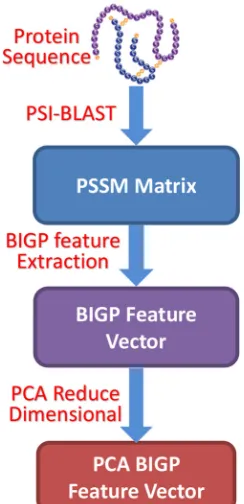
In the paper, we presented a novel computational approach called RVMBIGP to detect SIPs only using protein amino acids sequence. The proposed model generally can be divided into three steps: (1) an effective feature extraction method named BIGP is used to represent candidate self-interacting proteins by exploring evolutionary information embedded in PSI-BLAST-constructed PSSM; (2) PCA (Principal Component Analysis ) is employed to decrease the dimensional of feature vectors and capture the useful information, which can decrease the
effects of noise; (3) the robust classifier Relevance Vector Machine is employed to carry out classification. The fivefold cross validation is used in the experiment. These
experimental results display that our RVMBIGP model can achieve very high accuracies of 95.48% and 98.80% on yeast and human datasets, respectively. In order to evaluate the performance of RVMBIGP, we also compared it with
SVM classifier (support vector machine) and other several
approaches on yeast and human datasets. It can be seen that proposed matrix-based feature representation can extract the hidden key information beyond the sequence itself and, hence, can yield much better prediction accuracy than previous method. It is demonstrated that our approach is
fit for SIPs detection and can perform incredibly well for
predicting SIPs.
RESULTS AND DISCUSSION
Performance of the proposed method
For demonstrating the effectiveness of our prediction model called as RVMBIGP, the experiment was executed on yeast and human dataset, respectively. To prevent the
overfitting of the proposed approach, we divided yeast
and human datasets into training datasets and independent
test datasets respectively. More specifically, 1/6 of human dataset were randomly selected as independent test dataset and the remaining human dataset selected as training dataset. The same strategy was also used to apply in the yeast dataset. In addition, to provide a fair comparison, the
experimental dataset was repeatedly constructed five times.
In order to guarantee the fair, the parameters of RVMBIGP prediction model should be optimized. In the experiments, the Gaussian kernel function was selected and three
parameters set up as following: beta = 0, initapla = 1/N, and width = 2, where width is Gaussian function’s width, N represents a total of training dataset, and beta represents
classification. The prediction model is report Ac, Sn, Pe and
Mcc for yeast and human dataset. The results are displayed in Tables 1–2.
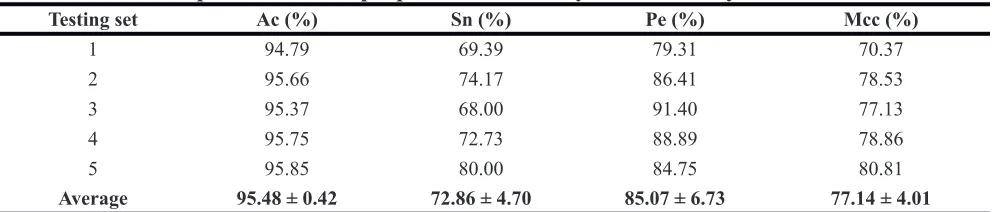
We can see from Table 1 that the average accuracies
of five experiments are all above 94% for yeast dataset.
Specifically, the each time overall accuracies of 94.79%,
95.66%, 95.37%, 95.75% and 95.85 were achieved. At the same time, the proposed method also obtained average Sensitivity, Precision, and Mcc of 72.86%, 85.07%, 77.14% and the standard deviations of them of 4.7%, 6.7%, and 4.0% on yeast dataset. Similarly average Accuracy of 98.80% was also obtained on human dataset. The average Mcc, Precision and Sensitivity of 92.06%, 94.86% and 90.44% and the standard deviations of them of 0.97%, 0.91% and 1.89% were also acquired respectively. Because of the choice of feature extraction method
and classifier, we can found from Table 1 and Table 2
When this done, thus each protein sequence can obtain a set of bi-grams from the conserved area [8]. As a result, it can provide a greet help in predicting SIPs. (3) We converted into the dimensional of each BIGP feature vector from 400 to 350 through employing Principal Component Analysis (PCA) method for reducing the
influence of noise. Thus, the experiment results show that
the proposed approach may provide a useful tool for the accurate prediction of SIPs.
Comparison with the SVM-based method
Despite our prediction model obtained god prediction results. However, for further evaluating the
prediction performance of the proposed classifier, the
comparison of prediction accuracy executed between RVM
classifier and the SVM classifier (support vector machine)
by using BIGP feature extraction approach on human and yeast dataset. The SVM classifier used the LIBSVM tool [9] to carry out classification. The RBF function (radial
basis function) was choose as SVM’s kernel function. A grid search method was employed to optimize the RBF kernel parameters, where c = 0.1 and g = 0.01.
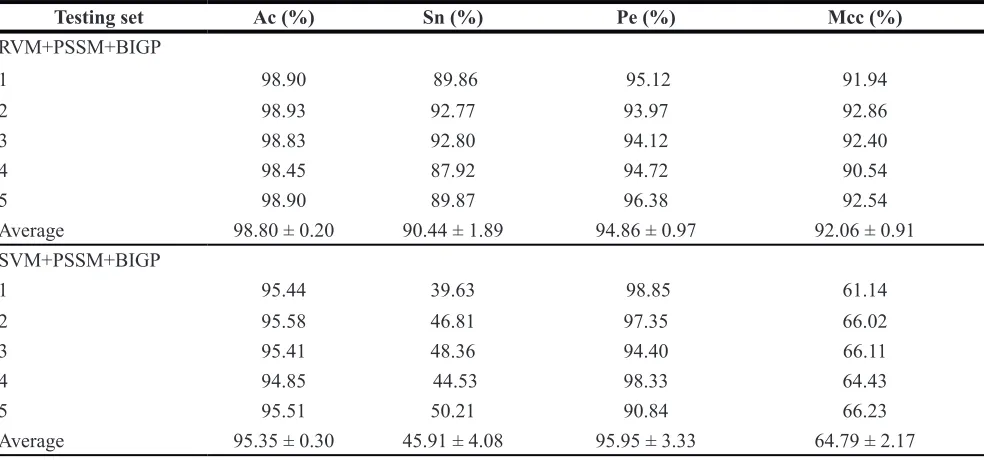
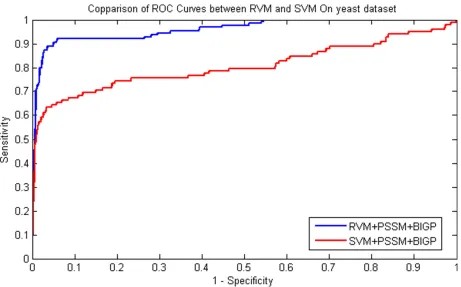
The prediction results of SIPs for RVM and SVM
classifier were presented in Table 3 and Table 4 on
yeast and human datasets respectively. Similarity, the comparison of ROC Curves was shown in Figure 1 and Figure 2 on yeast and human datasets respectively. We
can find from Table 3 that SVM obtained 91.35% average
accuracy on yeast dataset. However, the RVM classifier
achieved 95.48% average Accuracy. Similarly as displayed in Table 4, 98.80% average Accuracy obtained by the
proposed RVM classifier and 95.35% average Accuracy
achieved by the SVM classifier on human dataset. These prediction results from Table 3 and Table 4 demonstrated that the performance of RVM is obviously higher than that of SVM. Meanwhile, it can be found from Figure 1 and Figure 2, RVM’s ROC curves is also obviously better than that of SVM. This may be attributed to as following
reason: (1) The RVM classifier can greatly reduce kernel
function calculation; (2) The obvious disadvantage of SVM that kernel function need to be meet the demand of
Mercer overcome by RVM classifier. As a result, all of
these demonstrated that the proposed prediction model might become useful tools for predicting SIPs, as well as other bioinformatics tasks.
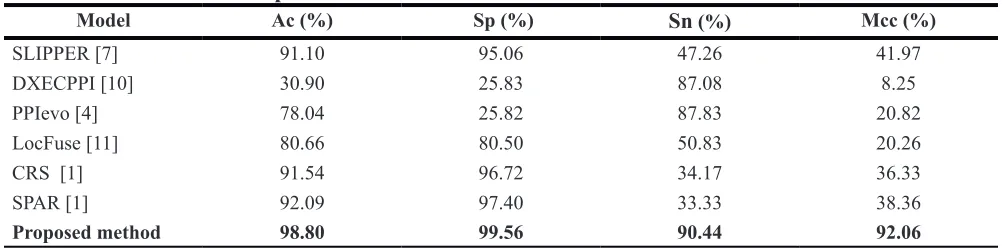
Comparison with other methods
In the paper, for further evaluating the performance of the proposed prediction model, the comparison of prediction performance executed between the proposed prediction model called RVMBIGP and other existing methods: SPAR , CRS, SLIPPER, DXECPPI [10], PPIevo [4] and LocFuse [11] based on the yeast and human dataset. These results were displayed in Table 5 and Table 6 using the above mentioned methods on yeast and human datasets. From Table 5, we can found that the proposed model average accuracy is obviously better other methods on yeast dataset. Similarity, as shown in
Table 6, the prediction results of our final model is also
[image:3.612.60.556.64.170.2]obviously better other methods on human dataset. The results demonstrated that the RVMBIGP prediction model has good executive ability. This further proved that our prediction model is a useful tool for SIPs prediction.
Table 1: Prediction performance of proposed method on yeast dataset by five tests
Testing set Ac (%) Sn (%) Pe (%) Mcc (%)
1 94.79 69.39 79.31 70.37
2 95.66 74.17 86.41 78.53
3 95.37 68.00 91.40 77.13
4 95.75 72.73 88.89 78.86
5 95.85 80.00 84.75 80.81
[image:3.612.60.555.204.308.2]Average 95.48 ± 0.42 72.86 ± 4.70 85.07 ± 6.73 77.14 ± 4.01
Table 2: Prediction performance of proposed method on
human
dataset by five tests
Testing set Ac (%) Sn (%) Pe (%) Mcc (%)
1 98.90 89.86 95.12 91.94
2 98.93 92.77 93.97 92.86
3 98.83 91.80 94.12 92.40
4 98.45 87.92 94.72 90.54
5 98.90 89.87 96.38 92.54
MATERIALS AND METHODS
Dataset
There are 20,199 curated human protein sequences in the UniProt database [12]. We can obtain the PPI datasets from variously resources, containing DIP [13], BioGRID [14], IntAct [15], InnateDB [16] and MatrixDB [17]. In the work, the PPIs datasets were created, which only contain the identical two interactions protein
sequences. The interaction type of PPIs datasets was
defined as ‘direct interaction’ in relevant databases. As
a result, 2994 human Self-interaction protein sequences
obtained in the experiment. For assessing the efficiency
[image:4.612.67.555.80.308.2]of our prediction model, we created the experiment datasets through the following three steps [1]: (1) We only reserved the protein sequences, whose length longer than 50 residues and less than 5000 residues from the whole human proteome; (2) The Protein Self-interaction data were selected for constructing positive datasets, which
Table 3: Comparison of the prediction performance by the RVM and SVM classifier based on
BIGP on the
yeast
dataset
Testing set Ac (%) Sn (%) Pe (%) Mcc (%)
RVM+PSSM+BIGP
1 94.79 69.39 79.31 70.37
2 95.66 74.17 86.41 78.53
3 95.37 68.00 91.40 77.13
4 95.75 72.73 88.89 78.86
5 95.85 80.00 84.75 80.81
Average 95.48 ± 0.42 72.86 ± 4.70 85.07 ± 6.73 77.14 ± 4.01
SVM+PSSM+BIGP
1 92.86 29.59 85.29 49.87
2 90.93 22.50 96.43 44.52
3 89.77 20.00 80.65 38.99
4 91.31 25.62 100.0 48.30
5 91.89 35.20 93.62 55.25
Average 91.35 ± 1.14 26.58 ± 6.00 91.20 ± 8.01 47.21 ± 5.99
Table 4: Comparison of the prediction performance by the RVM and SVM classifier based on
BIGP on the human dataset
Testing set Ac (%) Sn (%) Pe (%) Mcc (%)
RVM+PSSM+BIGP
1 98.90 89.86 95.12 91.94
2 98.93 92.77 93.97 92.86
3 98.83 92.80 94.12 92.40
4 98.45 87.92 94.72 90.54
5 98.90 89.87 96.38 92.54
Average 98.80 ± 0.20 90.44 ± 1.89 94.86 ± 0.97 92.06 ± 0.91
SVM+PSSM+BIGP
1 95.44 39.63 98.85 61.14
2 95.58 46.81 97.35 66.02
3 95.41 48.36 94.40 66.11
4 94.85 44.53 98.33 64.43
5 95.51 50.21 90.84 66.23
[image:4.612.63.555.364.594.2]must be meet one of the following conditions: (a) The Self-interaction positive protein datasets have been found through at least two kinds of large scale experiments or one small-scale experiment; (b) the protein has been
defined as homooligomer (including homodimer and
homotrimer) in UniProt; (c) The Self-interaction positive protein datasets have been reported by at least two publications; (3) For creating the negative dataset, we removed all types of SIPs from the whole human proteome
(including proteins annotated as ‘direct interaction’ and more extensive ‘physical association’) and UniProt
database. Thus, 1441 human positive SIPs and 15,938 human negative non-SIPs were created in the experiment. In addition, for further proving the prediction performance
of RVMBIGP, the yeast dataset that contains 710 positive SIPs and 5511 negative non-SIPs was constructed by using the same strategy [1].
Position specific scoring matrix
Position Specific Scoring Matrix (PSSM) was
originally used to detect distantly related proteins.
Now, PSSM is employed to predict protein disulfide
connectivity, quaternary structural attributes, and folding pattern [18]. In the paper, we used PPSM to predict
SIPs. Using the Position Specific Iterated BLAST
[image:5.612.60.556.80.203.2](PSI-BLAST) [19] transform each protein sequence into a PSSM matrix. A PSSM is an N × 20 matrix
[image:5.612.246.368.437.689.2]Figure 1: Flowchart of the proposed featureextraction method based on PSI-BLAST-constructed position specificscoring matrix.
Table 5: Performance comparison of the RVMBIGP and the other methods on yeast dataset
Model Ac (%) Sp (%) Sn (%) Mcc (%)
SLIPPER [7] 71.90 72.18 69.72 28.42
DXECPPI [10] 87.46 94.93 29.44 28.25
PPIevo [4] 66.28 87.46 60.14 18.01
LocFuse [11] 66.66 68.10 55.49 15.77
CRS [1] 72.69 74.37 59.58 23.68
SPAR [1] 76.96 80.02 53.24 24.84
Figure 2: Performance comparisons betweenRVM and SVM on yeast dataset.
{ ij :1 1 , 1 20}
M = M i = …N j= … , where N is the length of a given protein sequence, and 20 are a total of 20 amino acids and can assign the score
M
ij that represent theth
j
amino acid in thei
th position for the query proteinsequence. The score
M
ijis 20
1
( , ) ( , )
ijk
M
p i k q j k
=
=
∑
×
,where
p i k
( , )
represents the appearing frequency value of thek
th amino acid at positioni
of the probe, andq i k
( , )
is the value of Dayhoff’s mutation matrix betweenj
th andk
th amino acids. Thus, a high scorerepresents a well conserved position and a low score represents a weakly conserved position.
In our work, in order to create experiment datasets, we used PSI-BLAST to convert each protein sequence into a PSSM for predicting SIPs. For obtaining highly and widely homologous sequences, we set up the e-value parameter of PSI_BLAST is 0.001 and selected three iterations. Finally, the PSSM can be expressed as a 20-dimensional matrix though using PSI-BLAST, which contains M× 20 elements, where M is the number of residues of a protein and 20 columns represent a count of 20 amino acids.
Bi-gram probabilities
The Bi-gram Probabilities (BIGP) have been used for protein fold recognition. In the literature [20], a given protein sequence was represented using its original primary sequence or its consensus sequence. Instead of, we employed the improved BIGP feature extraction method that proposed by the literature [21] and expressed a protein sequence by its PSSM (PSSM has been mentioned in the 2.2 section of the paper) directly for predicting SIPs. In detail, the Bi-gram feature vector was computed through counting the bi-gram frequencies of occurrences in PSSM. It is assumed that P represents the PSSM of a protein sequence, which contains L rows and 20 columns, where L represents the length of a given protein sequence length and 20 columns represents a total of 20 amino acids. The PSSM element
P
ij can be interpreted as the relative probability ofj
th amino acid atthe
i
th location of the primary protein sequence,P
ij canbe expressed as 20
j 1
i :1 1 L, j 1 20
P
ij=
=
∑
= …
= …
. Thefrequency of occurrence of transition from
m
th aminoL 1 mn i,m i 1,n
i 1
BIGP −P P 1 m 20,1 n 20+ =
=
∑
≤ ≤ ≤ ≤ (1)The equation (1) gives 400 frequencies of occurrences
BIGP
mn for 400 bi-gram transitions, the matrix BIGP called the bi-gram occurrence matrix ,whose 400 elements represent the bi-gram feature vector [21] as following:1,1 1,2 1,20 2,1 2,20 20,1 20,20
[
,
,
,
,
,
]
BF
BGP BGP
BGP BGP
BGP
BGP
BGP
=
…
…
……
…
(2)These bi-gram features can also be expressed as following:
1, 2 3, ,
[ , ,
u,
]
BF
=
ϕ ϕ ϕ
…
ϕ
…
ϕ
θ (3)Where
θ =
mn 400
=
is the dimensionality of the feature vectorBF,
theϕ
u can be represented asfollowing: 1, 2, 20 20, 380
(1
20)
(21
40)
(381
400)
u u u u
BGP
u
BGP
u
BGP
u
ϕ
− −≤ ≤
≤ ≤
= ……
≤ ≤
(4)Finally, each yeast and human protein sequence was transformed into a 400-dimensional vector using the Bi-gram Probabilities feature extraction method. In our
work, in order to reduce the influence of noise and improve
the prediction accuracy, the dimensional of yeast and human were reduced from 400 to 350 by using Principal
Component Analysis (PCA) method. The flow chart of the
proposed feature extraction method is displayed in Figure 3.
Relevance vector machine
The characteristics of the Relevance Vector Machine described in the literature [22]. We assumed
{ , }
N1n n n
x t
= ,d n
x
∈
R
represents the training set for binaryclassification problems, where
t
n∈
{0,1}
is the trainingset label,
t
i is the testing set label, andt
i= +
y
iε
i ,where
( )
1(
,)
0N T
i i j j i j
y w=
ϕ
x =∑
= w K x x +w is theclassification model;
ε
i is the additional noise, with a mean value of zero and a variance ofσ
2, where(
2)
(
2)
~
0,
, ~
,
i
N
t
iN y
iε
σ
σ
. It is assumed that thetraining sets are independent and identically distributed; the vector
t
submits to as following distribution:(
2)
2 /2 22
1
| , ,
(2
)
exp[
|
| ]
2
Np t x w
σ
πσ
t
ϕ
w
σ
−
=
−
−
(2) Where
ϕ
is defined as following:(
)
1 1 1
1
1
( , )
( , ))
1
,
( , )
N
N N N
k x x
k x x
k x x
k x x
ϕ
= …
…
…
…
(3) The training set labelt
is employed to detect the testing set labelt
*, given by( )
(
2)
2 2*
|
*| ,
( , | )
p t t
=
∫
p t w
σ
p w
σ
t dwd
σ
(4)Because of making the value of most components of the weight vector
w
zero and reducing the number of calculation of the kernel function, additional conditions is attached to the weight vectorw
. Assuming thati
w
obeys a distribution with a mean value of zeroand a variance of
α
i−1, the mean~ (0, )
1i i
w N
α
− ,( )
| iN0 ( | )i ip w a = ∏= p w a , where
a
is ahyper-parameters vector of the prior distribution of the weight vector
w
.( )
(
2)
2* *
2
|
| , ,
( , , | )
p t t
p t w a
p w a
t
dwdad
σ
σ
σ
=
∫
[image:7.612.56.557.64.188.2](5)
Table 6: Performance comparison of the RVMBIGP and the other methods on
human
dataset
Model Ac (%) Sp (%) Sn (%) Mcc (%)
SLIPPER [7] 91.10 95.06 47.26 41.97
DXECPPI [10] 30.90 25.83 87.08 8.25
PPIevo [4] 78.04 25.82 87.83 20.82
LocFuse [11] 80.66 80.50 50.83 20.26
CRS [1] 91.54 96.72 34.17 36.33
SPAR [1] 92.09 97.40 33.33 38.36
(
2)
(
)
2*
| , ,
( |
* *; , )
p t w a
σ
=
N t y x w
σ
. (6) Becausep w a
(
, , |
σ
2t
)
cannot be obtained by an integral. As a result, it must be resolved using a Bayesian formula, as given(
, , |
2) (
| , ,
2)
( ,
2| )
p w a
σ
t
=
p w a
σ
t p a
σ
t
(7)(
| , ,
2) (
| ,
2)
( )
| /
(
| ,
2)
p w a
σ
t
=
p t w
σ
p w a p t a
σ
(8)The integral of the product of
p t a
( | , )
σ
2 and( )
|
p w a
as following:(
| ,
2)
(2 )
/2| |
1/2exp(
1)
2
TN
t
t
p t a
σ
=
π
−Ω
−−
Ω
− (9)(
)
2 1
0, 1,
, ,
TN
I
A
A diag a a
a
σ
ϕ
−ϕ
Ω =
+
=
…
, (10)(
| , ,2)
(2 ) ( 1)/2| |1/2exp((
) (
)
)2
T
N w u w u
p w aσ t = π − + Σ − − − −
(11)
2 1
(
σ ϕ ϕ
− TA
)
−Σ =
+
(12)2 T
u
=
σ
−Σ
ϕ
t
(13)For the sake of
( ,
p a
σ
2|
t
)∝
p t a
(
| ,
σ
2)
2
( ) ( )
p a p
σ
and( ,
p a
σ
2|
t
) cannot be solved by
means of integration, the solution is approximated using the maximum likelihood method, represented by
(
2)
2 2,
,
arg
( | , )
MP MP a
a
maxp t a
σ
σ
=
σ
(14)The iterative process of
a
MP andσ
MP2 given by:2
2 2
0
|
|
( )
1
,
new i i
i
new
N i i
i i
a
t
N
a i i
γ
µ
ϕµ
σ
µ
γ
=
=
−
=
−
= −
∑
∑
(15)
Here
∑
i i
,
isi
th
element in theΣ
'
s
diagonal and the initial value ofa
andσ
2 can be decided via the approximation ofa
MP andσ
MP2 using formula (15)continuously updated. After enough iterations, most of
i
a
will be close to infinity, the corresponding parametersin
w
i will be zero, and othera
i values will be close to finite. The resulting corresponding parametersx
i ofa
i [image:8.612.59.557.403.703.2]are now referred to as the relevance vector.
Performance evaluation
In the paper, in order to evaluate power of the proposed method, the following measures are used to
assess the performance of the RVM classifiers employed in this work. The definition is showed as following:
Ac
TP TN
TP FP TN FN
+
=
+
+
+
Sn
TP
TP TN
=
+
Sp
TN
FP TN
=
+
Pe
TP
FP TP
=
+
( ) ( )
Mcc
( ) ( ) ( ) ( )
TP TN FP FN
TP FN TN FP TP FP TN FN
× − ×
=
+ × + × + × +
Where Ac represents Accuracy, Sn represents
Sensitivity, Sp is specificity, Pe is Precision and Mcc represents Matthews’s correlation coefficient respectively.
In the above formula, TP represents true positives (the count of true interacting pairs correctly predicted), FP represents false positives (the count of true non-interacting
pairs falsely predicted), TN represents true negatives (the
number of true non-interacting pairs predicted correctly)
and FN represents false negatives (true interacting pairs
falsely predicted to be non-interacting pairs). Moreover, in order to assess the performance of the proposed prediction model, we created Receiver Operating Curve (ROC) in the experiment.
Webserver
In order to provide convenience for using the proposed prediction model, a web server created which executes the prediction function of the proposed RVMBIGP model. It is available at
http://219.219.62.123:8888/RVMBIGP/. The Web Server
mainly used to predict SIPs on human dataset, which enable users can obtain the probability scores of SIPs by RVMBIGP prediction model. The prediction results can be listed on the Webpage and send it to the users’ email.
CONCLUSIONS
In the paper, we proposed an approach named RVMBIGP was proposed, which combines the RVM (Relevance Vector Machine) model with BIGP (Bi-gram probability) to predict SIPs based on protein sequence information. There are several obvious advantages for the proposed method: (1) an effective feature extraction
method named BIGP is used to represent protein sequences on PSSM, which can characterize the subsequence of amino acids in the conserved regions and capture the useful evolutionary information; (2) PCA (Principal Component Analysis) method employed to capture the evolutionary
information and reduce the influence of noise; (3) using the robust classifier Relevance Vector Machine (RVM) to carry out classification. When performed on yeast and human datasets, the proposed RVMBIGP model obtained high accuracy of 95.48% and 98.80%, respectively, which obviously higher than the prediction model based SVM
classifier and other exiting methods. In conclusion, the
proposed RVMBIGP prediction model is robust, powerful and effective. This make it is a useful tool and suitable for predicting SIPs, as well as other bioinformatics tasks. More machine learning algorithms and effective feature extraction approaches should be developed for identifying SIPs in the future study.
ACKNOWLEDGMENTS AND FUNDING
ZHY and JYA are supported in part by the National Natural Science of Foundation of China under Grant61373086, 61572506, in part by the Pioneer Hundred Talents Program of Chinese Academy of Sciences. XC is
supported by the National Natural Science of Foundation of China under Grant 11301517 and National Center for
Mathematics and Interdisciplinary Sciences, CAS.
CONFLICTS OF INTEREST
The authors declare no conflict(s) of interest.
Authors’ contributions
JYA and ZHY conceived the algorithm, carried out
analyses, prepared the data sets, carried out experiments, and
wrote the manuscript; XC, DSH, and YW designed, performed
and analyzed experiments and wrote the manuscript. All
authors read and approved the final manuscript.
REFERENCES
1. Liu X, Yang S, Li C, Zhang Z, Song J. SPAR: a random forest-based predictor for self-interacting proteins with
fine-grained domain information. Amino Acids 2016: 1–11.
2. Chen X, Huang YA, Wang XS, You ZH, Chan KC.
FMLNCSIM: fuzzy measure-based lncRNA
functional similarity calculation model. Oncotarget.
2016; 7:45948–45958. doi: 10.18632/oncotarget.10008. 3. Li ZW, You ZH, Chen X, Gui J, Nie R. Highly Accurate
Evolutionary Information and Physicochemical Characteristics. 2016; 17.
4. You ZH, Zhou M, Luo X, Li S. Highly Efficient Framework
for Predicting Interactions Between Proteins. IEEE Transactions on Cybernetics. 2016: 1–13.
5. An JY, Meng FR, You ZH, Chen X, Hu JP. Improving
protein-protein interactions prediction accuracy using protein evolutionary information and relevance vector machine model. Protein Science A Publication of the Protein Society. 2016.
6. Li S, You ZH, Guo H, Luo X. Inverse-Free Extreme
Learning Machine With Optimal Information Updating. IEEE Transactions on Cybernetics. 2015; 46:1229–1241.
7. You ZH, Yu JZ, Zhu L, Li S, Wen ZK. A MapReduce based
parallel SVM for large-scale predicting protein–protein
interactions. Neurocomputing. 2014; 145:37–43.
8. You ZH, Lei YK, Gui J, Huang DS, Zhou X. Using manifold
embedding for assessing and predicting protein interactions from high-throughput experimental data. Bioinformatics. 2010; 26:2744–2751.
9. Jansen R, Yu H, Greenbaum D, Kluger Y, Krogan NJ,
Chung S, Emili A, Snyder M, Greenblatt JF, Gerstein M.
A Bayesian Networks Approach for Predicting
Protein-Protein Interactions from Genomic Data. Science. 2003; 302:449–453.
10. Benhur A, Noble WS. Kernel methods for predicting
protein-protein interactions. Bioinformatics. 2005; 21:i38–46.
11. Zahiri J, Yaghoubi O, Mohammad-Noori M, Ebrahimpour R, Masoudi-Nejad A. PPIevo: Protein-Protein
Interaction Prediction from PSSM Based Evolutionary Information. Genomics. 2013; 102:237–242.
12. Shen J, Zhang J, Luo X, Zhu W, Yu K, Chen K, Li Y,
Jiang H. Predicting protein-protein interactions based only
on sequences information. Proceedings of the National
Academy of Sciences. 2007; 104:4337–4341.
13. Zaki N, Lazarovamolnar S, Elhajj W, Campbell P.
Protein-protein interaction based on pairwise similarity. Bmc Bioinformatics. 2009; 10:1–12.
14. Liu Z, Guo F, Zhang J, Wang J, Lu L, Li D, He F.
Proteome-wide prediction of self-interacting proteins based on multiple properties. Molecular & Cellular Proteomics Mcp. 2013; 12:1689–1700.
15. Sharma A, Lyons J, Dehzangi A, Paliwal KK. A feature extraction technique using bi-gram probabilities of position
specific scoring matrix for protein fold recognition. Nanobioscience IEEE Transactions on. 2013; 320:41–46.
16. Chang CC, Lin CJ. LIBSVM: A library for support vector machines. Acm Transactions on Intelligent Systems & Technology. 2011; 2:389–396.
17. Xiuquan Du JC, Tingting Zheng, Zheng Duan, Fulan Qian. A Novel Feature Extraction Scheme with Ensemble Coding
for Protein–Protein Interaction Prediction. International Journal of Molecular Sciences. 2014; 15:12731–12749.
18. Zahiri J, Mohammad-Noori M, Ebrahimpour R, Saadat S, Bozorgmehr JH, Goldberg T, Masoudi-Nejad A. LocFuse: Human protein–protein interaction prediction via classifier fusion using protein localization information. Qrevchemsoc.
2014; 104:496–503.
19. Consortium UP. UniProt: a hub for protein information.
Nucleic Acids Research. 2014; 43:D204–212.
20. Salwinski L, Miller CS, Smith AJ, Pettit FK, Bowie JU, Eisenberg D: The Database of Interacting Proteins: 2004
update. Nucleic Acids Research. 2004; 32:D449–D451.
21. Chatraryamontri A, Breitkreutz BJ, Oughtred R, Boucher L,
Heinicke S, Chen D, Stark C, Breitkreutz A, Kolas N,
O'Donnell L. The BioGRID interaction database: 2015
update. Nucleic Acids Research. 2015; 43:470–478.
22. Orchard S, Ammari M, Aranda B, Breuza L, Briganti L,
Broackes-Carter F, Campbell NH, Chavali G, Chen C, Del-Toro N. The MIntAct project--IntAct as a common curation platform for 11 molecular interaction databases. Nucleic
Acids Research. 2014; 42:358–363.
23. Breuer K, Foroushani AK, Laird MR, Chen C, Sribnaia A, Lo R, Winsor GL, Hancock REW, Brinkman FSL, Lynn DJ. InnateDB: Systems biology of innate immunity and beyond
- Recent updates and continuing curation. Nucleic Acids
Research. 2012; 41:D1228–D1233.
24. Launay G, Salza R, Multedo D, Thierrymieg N,
Ricardblum S. MatrixDB, the extracellular matrix interaction database: updated content, a new navigator and
expanded functionalities. Nucleic Acids Research. 2015;
43:321–327.
25. Gribskov M, Mclachlan AD, Eisenberg D. Profile analysis:
detection of distantly related proteins. Proceedings of the
National Academy of Sciences of the United States of
America. 1987; 84:4355–4358.
26. Altschul SF, Koonin EV. Iterated profile searches with
PSI-BLAST—a tool for discovery in protein databases. Trends in Biochemical Sciences. 1998; 23:444–447.
27. Ghanty P, Pal NR. Prediction of Protein Folds: Extraction of New Features, Dimensionality Reduction, and Fusion of Heterogeneous Classifiers. IEEE Transactions on Nanobioscience. 2009; 8:100–110.
28. Sharma A, Lyons J, Dehzangi A, Paliwal KK. A feature extraction technique using bi-gram probabilities of position
specific scoring matrix for protein fold recognition. Nanobioscience IEEE Transactions on. 2012; 320:41–46.