Running Header: On the use of Hidden Information
On the use of Hidden Information as a Measure of Complexity in Supply Chains. Peter Dickinson
00063665
Salford Business School, University of Salford, Manchester, UK.
On the use of Hidden Information
P a g e | ii
Table of Contents
1 CHAPTER 1: INTRODUCTION ... 3
1.1 Background ... 5
1.2 Motivation ... 8
1.3 Relevance ... 9
1.4 Aim and Objectives ... 10
1.5 Research Questions ... 10
1.6 Contribution ... 11
1.7 Method ... 13
1.8 Thesis Structure ... 13
2 CHAPTER 2: THEORETICAL FOUNDATION ... 16
2.1 Background ... 16
2.2 Complexity ... 21
2.3 Entropy ... 28
2.3.1 Entropy, and the Metaphor. ... 30
2.3.2 The Basics of a Classic Thermodynamic systems. ... 34
2.4 Information Theory ... 44
2.4.1 The Basics of Information Theory. ... 44
2.4.2 A Critique and Review of the work of Hartley and Shannon. ... 49
2.4.3 Entropy and Information Theory ... 59
On the use of Hidden Information
P a g e | iii
2.4.5 Implications for this Research. ... 81
2.5 Complex Networks ... 82
2.5.1 Complex Network Structures. ... 83
2.5.2 Basic Random Network Models. ... 93
2.5.3 The Application of Graph Theory to Supply Chain Management. ... 99
2.5.4 Alternative approaches to studying Network Complexity. ... 102
2.6 Developing a revised model ... 105
2.6.1 Worked Example ... 115
3 CHAPTER 3: RESEARCH QUESTION... 118
4 CHAPTER 4: METHOD ... 119
4.1 The Issues of Research ... 119
4.1.1 Research Strategy Development. ... 124
4.1.2 Research Approach ... 129
4.1.3 Research Structure... 129
4.1.4 Summary ... 137
4.2 Research Paradigms ... 138
4.2.1 The Context of this Research. ... 138
4.2.2 The Purpose of this Research. ... 139
4.2.3 The Process of Research... 140
4.2.4 Research Paradigm. ... 141
4.3 Research Methodology ... 145
5 CHAPTER 5: ANALYSIS ... 150
5.1 Construction of the adjacency matrix and the business scenarios ... 150
5.1.1 Basic Adjacency Construct ... 150
On the use of Hidden Information
P a g e | iv
5.2 Analysis of the basic scenarios ... 170
5.2.1 Analysis of the Basic Construct. ... 170
5.2.2 Macro Level Analysis for the Basic Construct ... 179
5.2.3 Micro Level Analysis for the Basic Construct ... 191
5.3 Comparison of Hidden Information and Entropy for the Multi-organisational Construct ... 199
5.3.1 Macro Level Analysis of Multi Organisation Construct ... 200
5.3.2 Micro Level Analysis for the Multi Organisation Construct ... 206
5.4 Comparison of Hidden Information and Entropy for Minimalistic Construct ... 213
5.4.1 Macro Level Analysis of Minimalistic Construct ... 214
5.4.2 Micro Level Analysis of Minimalistic Construct ... 220
5.5 The Comparative analysis of each Scenario ... 227
5.6 The Structuring effects on Question Sets ... 231
6 CHAPTER 6: DISCUSSION ... 238
6.1 Major Findings ... 239
6.2 The Meaning and Importance ... 244
6.3 Relation to similar findings ... 251
6.4 Alternative Explanations ... 257
6.5 Relevance of the Findings ... 259
6.6 Limitation of the Research ... 270
6.7 Further Research ... 271
7 CHAPTER 7: CONCLUSIONS ... 274
On the use of Hidden Information
P a g e | v
APPENDIX ... 287
Appendix A: Proofs of the form H ... 287
Ben-Naims proof of the form H ... 287
Shannon’s proof of the form H ... 291
Appendix B: The construction of the adjacency matrix from the SCOR model. ... 293
Appendix C: Tables for the supply chain operating reference model ... 295
Tables for the Planning processes ... 295
Tables for the Sources processes. ... 297
Tables for the Make process ... 299
Tables for the Deliver processes ... 301
Tables for the Return processes ... 304
Appendix D ... 307
Process Steps ... 307
Questionnaire ... 309
Appendix E ... 330
On the use of Hidden Information
P a g e | vi
Tables
Table of Figures
Figure 1: Foundation of Systems Thinking (adapted from Gharajedaghi, 2011) ...9
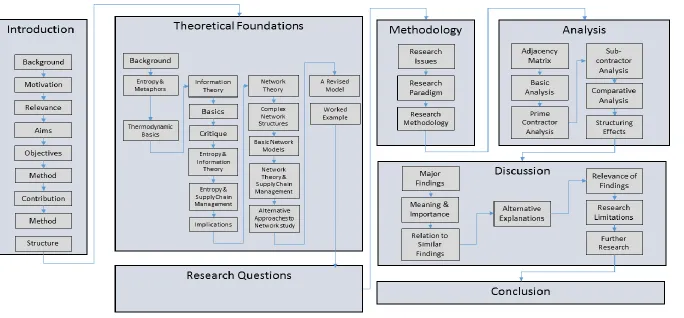
Figure 2: Structure of this thesis ...15
Figure 3: Structural and Operational Complexity ...25
Figure 4: Diagrammatic representation of the range and scales of supply chain processes necessary to operate the business. ...27
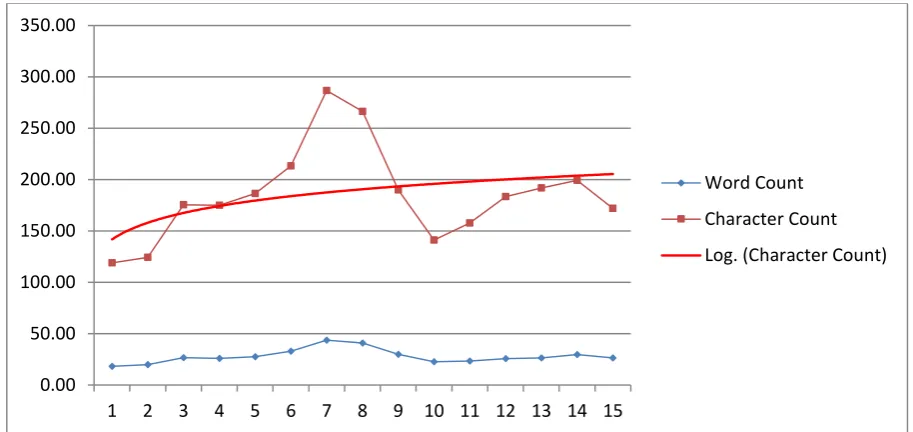
Figure 5: Graphical representation of supply chain definitions data count ...48
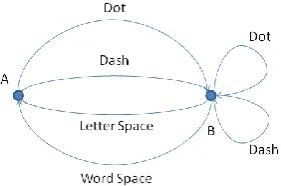
Figure 6: A,B and AB ...49
Figure 7: Shannon's network diagram for morse code. ...53
Figure 8: Choice and successive choices (from Shannon, 1948) ...56
Figure 9: Diagram for the Effects on Entropy and 'Hidden Information' as consolidation occurs...66
Figure 10: Diagram showing the dimension of Entropy and Hidden Information during the consolidation process. ...66
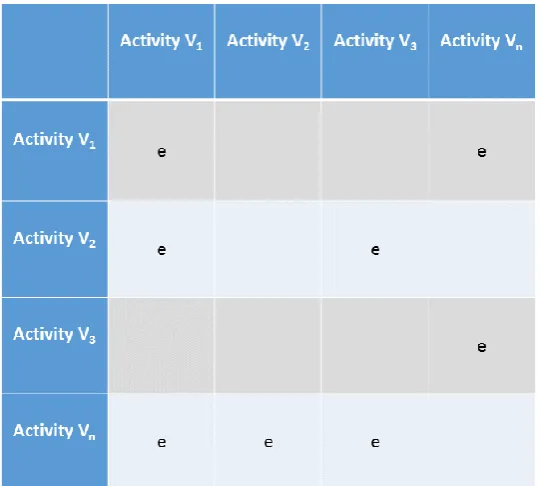
Figure 11: The Adjacency matrix with connections e ...83
Figure 12: The star structure ...85
Figure 13: The comb structure ...85
Figure 14: The brush structure ...85
Figure 15: The Bipartite Graph ...86
Figure 16: Bipartite Adjacency Matrix (Incidence Matrix) ...87
Figure 17: The Hypergraph Structure ...88
Figure 18: The cage graph ...88
Figure 19: The complete graph ...89
Figure 20: The Multigraph Structure ...89
Figure 21: The four nodes and seven links of the Konigsburg bridge problem. ...96
Figure 22: The micro and macro components of hidden information ...114
Figure 23: The Issue of Research ...120
Figure 24:The multidemensional approach; developed by Burrell and Morgan (1979) ...123
Figure 25: Research Context Component One ...125
Figure 26: The Researchers Perspective on Problem Scoping and Solving. ...136
Figure 27: Research ontology, developed from Hussey and Hussey (1996)...141
Figure 28: Bi-directional process connector for processes A and B. ...145
Figure 29: Sample of the SCOR adjacency matrix in excel ...155
Figure 30: Graph of Kout degree frequencies ...171
Figure 31: Graph of Kin degree frequencies ...171
On the use of Hidden Information
P a g e | vii
Figure 33: Joint in/out degree for adjacency matrix ...173
Figure 34: Matrix power law distribution ...174
Figure 35: Visual map of the 186 nodes and 1261 links in the adjacency matrix. ...175
Figure 36: Circular visualisation (shows a view orthogonal to Figure 35) ...176
Figure 37: Plan links ...176
Figure 38: Source links ...177
Figure 39: Make links ...177
Figure 40: Deliver links...178
Figure 41: Return links ...178
Figure 42: NGI links ...179
Figure 43: Graphical comparision of entropy and hidden information for the complete adjacency matrix ...187
Figure 44: Entropy and Hidden Information for the Plan subset ...189
Figure 45: Entropy and Hidden Information for the Make subset ...189
Figure 46: Entropy and Hidden Information for the Return subset ...189
Figure 47: Entropy and Hidden Information for the Source subset ...189
Figure 48: Entropy and Hidden Information for the Deliver subset ...189
Figure 49: Entropy and hidden information 'micro level' for the complete matrix. ...197
Figure 50: Superset network diagram. ...200
Figure 51: Scenario Comparison Entropy and Hidden Information ...205
Figure 52: Entropy and hidden information 'micro level' for the multi organization scenario. ...211
Figure 53: Subset network...214
Figure 54: Scenario Comparison Entropy and Hidden Information ...219
Figure 55: Entropy and hidden information 'micro level' for the subcontractor scenario. ...225
On the use of Hidden Information
P a g e | viii
Table of Tables
Table 1: Table of molecule distributions. ...36
Table 2: Additional molecule distributions. ...37
Table 3: Binary expansion of position z. ...45
Table 4: Data count from supply chain management definitions. ...47
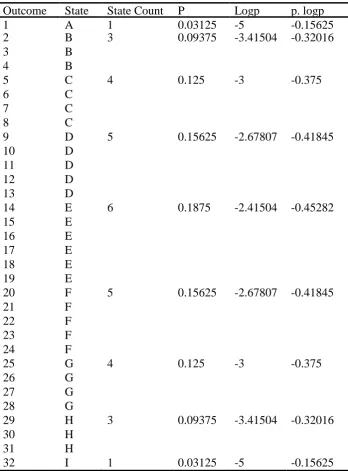
Table 5: Thirty two events grouped into nine categorisations. ...60
Table 6: Binary questions for remaining state 'E'. ...61
Table 7: ‘A’ primacy state count. ...62
Table 8: 'B' primacy state count. ...62
Table 9: From Gonzales et.al (2010). Understandability. Complexity and Reliability through Process Modelling and Execution phases. ...71
Table 10: Table of Multigraph Link Types. ...90
Table 11: The Multigraph Adjacency Matrix...90
Table 12: Corrected Multigraph Adjacency Matrix. ...91
Table 13: The number of ways the outcome of a throw of two dice can occur. ...106
Table 14: The specific way the outcome of the throw of a die can occur. ...108
Table 15: Probabilities for the throw of two dice. ...109
Table 16: The application of macro level analysis to the micro level elements. ...110
Table 17: Log base 2 for outcome probabilities. ...110
Table 18: Summary table of Shannon entropy. ...112
Table 19: Distribution of the letter of the english alphabet. ...115
Table 20: Varro's (left) and Ferris's (right) taxonomy of research characteristics. ...130
Table 21: Taxonomy for the selection of a research method. Adapted from Ferris 2009. ...131
Table 22: Ferris's taxonomy reproduced from table 21. ...138
Table 23: Methodological implications of different Epistemologies. Reproduced from Easterby-Smith, Thorpe and Jackson (2012). ...143
Table 24: Axes structure for SCOR plan. ...150
Table 25: Axes structure for SCOR source. ...151
Table 26: Axes structure for SCOR make. ...151
Table 27: Axes structure for SCOR deliver. ...152
Table 28: Axes structure for SCOR return. ...152
Table 29: Aggregation structure in the SCOR Model. ...154
Table 30: Sub-contractor scenario process decisions. ...157
Table 31: The number of interviewees selecting scenarios for each level in the model. ...157
Table 32: Axes structure for SCOR plan. ...159
Table 33: Axes structure for SCOR source. ...159
On the use of Hidden Information
P a g e | ix
Table 35: Axes structure for SCOR deliver. ...161
Table 36: Axes structure for SCOR return. ...162
Table 37: Sub-contractor scenario process decisions. ...164
Table 38: The number of interviewees selecting scenarios for each level in the model. ...164
Table 39: Axes structure for SCOR plan. ...166
Table 40: Axes structure for SCOR source. ...166
Table 41: Axes structure for SCOR make. ...167
Table 42: Axes structure for SCOR deliver. ...168
Table 43: Axes structure for SCOR return. ...169
Table 44: Table of values for the level three processes. ...172
Table 45: Entropy for each of the SCOR Analysis Levels. ...181
Table 46: Hidden Information for the SCOR Analysis Levels. ...183
Table 47: Comparative weighted average values for level three. ...184
Table 48: Macro entropy for each distinct SCOR Level. ...186
Table 49: Repeat of Table 47, macro hidden Information for the SCOR Analysis Levels. ...187
Table 50: Table of subset correlation coefficients. ...189
Table 51: Pearson product moment correlation. ...190
Table 52: Difference micro entropy for the complete matrix...192
Table 53: Difference hidden information for the complete matrix. ...193
Table 54: Hidden information for level zero at horizonal/macro and vertical/micro levels.. ...195
Table 55: Superset macro entropy for the SCOR Model. ...201
Table 56: Superset macro hidden information for the SCOR model. ...201
Table 57: Comparison value for Origin and the Multi-organisation scenario. ...202
Table 58: Difference in entropy and hidden information values. ...202
Table 59: Reduction in variables in the matrix. ...203
Table 60: Entropy values for the micro-analysis of the multi-organisational scenario. ...206
Table 61: Hidden information for the micro analysis of the multi-organisational scenario...207
Table 62: Hidden information for level zero at macro and micro level. ...209
Table 63: Entropy for the subcontractor scenario. ...215
Table 64: Hidden Information for the subcontractor scenario. ...215
Table 65: Comparison value for Origin and the subcontractor scenario. ...216
Table 66: Difference in entropy and hidden information values. ...217
Table 67: Reduction in variables in the matrix. ...217
Table 68: Entropy values for the micro-analysis of the sub-contractor scenario. ...220
Table 69: Hidden Information for the subcontractor scenario. ...221
Table 70: Hidden information for level zero at macro and micro level. ...223
On the use of Hidden Information
P a g e | x Table 72: Ontologies and assumptions about truth. Reproduced from Easterby -Smith, Thorpe and
Jackson (2012)...256
Table 73: Relationship between Outcomes and Groupings. ...288
On the use of Hidden Information
P a g e | xi
Equations
Equation 1 ...27
Equation 2 ...28
Equation 3 ...29
Equation 4 ...30
Equation 5 ...37
Equation 6 ...37
Equation 7 ...38
Equation 8 ...40
Equation 9 ...41
Equation 10 ...41
Equation 11 ...42
Equation 12 ...42
Equation 13 ...43
Equation 14 ...43
Equation 15 ...43
Equation 16 ...43
Equation 17 ...50
Equation 18 ...51
Equation 19 ...51
Equation 20 ...51
Equation 21 ...52
Equation 22 ...52
Equation 23 ...56
Equation 24 ...57
Equation 25 ...57
Equation 26 ...61
Equation 27 ...65
Equation 28 ...65
Equation 29 ...65
Equation 30 ...92
Equation 31 ...93
Equation 32 ...94
Equation 33 ...97
Equation 34 ...97
Equation 35 ...97
On the use of Hidden Information
P a g e | xii
Equation 37 ...98
Equation 38 ...100
Equation 39 ...106
Equation 40 ...107
Equation 41 ...107
Equation 42 ...108
Equation 43 ...109
Equation 44 ...109
Equation 45 ...111
Equation 46 ...111
Equation 47 ...113
Equation 48 ...113
Equation 49 ...113
Equation 50 ...116
Equation 51 ...116
Equation 52 ...116
Equation 53 ...148
Equation 54 ...149
Equation 55 ...149
Equation 56 ...158
Equation 57 ...158
Equation 58 ...158
Equation 59 ...165
Equation 60 ...165
Equation 61 ...165
Equation 62 ...173
Equation 63 ...180
Equation 64 ...180
Equation 65 ...180
Equation 66 ...180
Equation 67 ...183
Equation 68 ...183
Equation 69 ...184
Equation 70 ...185
Equation 71 ...186
Equation 72 ...186
Equation 73 ...186
On the use of Hidden Information
P a g e | xiii
Equation 75 ...191
Equation 76 ...192
Equation 77 ...199
Equation 78 ...213
Equation 79 ...229
Equation 80 ...289
Equation 81 ...289
Equation 82 ...290
Equation 83 ...290
Equation 84 ...291
Equation 85 ...291
Equation 86 ...291
Equation 87 ...291
On the use of Hidden Information
1 | P a g e
Abstract
With the increase in globalisation, mass customisation becoming ever more ubiquitous, product life cycles becoming shorter, midlife upgrades becoming more popular; with some product based solutions transitioning to service based solution, the supporting industry supply chains are becoming ever more complex. There is a likelihood that this complexity will increase with increasing access to emerging market cost effective capabilities and an international customer base. Working with this complexity is one of the challenges facing the supply chain executive, and there is no reason to think this increasing complexity will go away over the coming few years. Creating and managing an effective supply chain structure will be a key performance target and potentially a key differentiator. One element of the management task will be the understanding of structure and how it impacts on the overall key performance indicators.
Structures can be represented as activities and connections. These structures can be set out to reflect the complexity of the structure necessary to cover all potential business scenarios. A key determinant of a structure will be how ‘mixed up’ it needs to be to cope with the demands of complexity, flexibility and agility necessary for all the business scenarios. It is possible these structures can be represented as a matrix and, using information theory, analysed to measure complexity. This thesis looks to use a matrix approach and address these challenges by offering a revised model for structural complexity in the supply chain. Like most research in this field, this thesis will be experimental and laboratory based; however, the scenarios used in the analysis will be validated externally.
On the use of Hidden Information
2 | P a g e
On the use of Hidden Information
3 | P a g e
1
Chapter One: Introduction
Supply chain management, in some industries, has struggled to gain recognition as an important aspect of business operations. In industries such as food and automotive for instance, the concept of a supply chain is embraced and recognised as a key contributor; whereas in other industries, military aircraft or heavy industry perhaps serve as examples, the concept wrestles with traditional methodologies and transactional interactions that are classified, conceptually, as supply chain management.
The current transitions in the economic climate: rising debt levels and spending reductions across the western hemisphere and growth in the Indian, Chinese and Brazilian economies, for instance, add to the globalisation and/or internationalisation pressures on organisations’ supply chains. Internal to the organisation this pressure is only exacerbated: increasing levels of customer sophistication, mass customisation, the ever decreasing life cycle of most products all add to the challenge faced by supply chain management. The combined internal, external, product and market challenges only add to the complexity of form in the supply chain necessary to rise to these various challenges.
On the use of Hidden Information
4 | P a g e
term emergent) property of the system. The increased interest in a systemic view; looking from the environment, system and sub-system perspective, adds a new dimension to the challenge of understanding complexity of form. While the metaphorical heart, lungs, liver and brain of a supply chain have been well researched, research on the supply chain as a system; a system of internal, external, product and market interactions, is less pronounced and there is a need to add to the existing research on supply chains as complex systems.
Complexity theories have been researched and applied to various problems, complex adaptive systems for instance, and it has been this general acceptance of non-linearity and human sense and response that have highlighted the importance of research concerning the application of complexity theories to organisation problems. This human element of complexity brings with it the challenge of understanding what the complex problem is; the sense that complexity is about trying to understand a given problem or situation is one of the focus elements of this research. Complexity of form in the supply chain could then be concerned with how the form of the supply chain is understood: What does it take to understand the form of a given supply chain? Recognising the systemic perspective, this thesis will develop an approach to understanding complexity in the supply chain.
On the use of Hidden Information
5 | P a g e
1.1
Background
Entropy, in the physical sciences, has generally been considered to be the energy not available for work, expressed as a measure of disorder. In statistical mechanics, entropy is considered to be the amount of additional information required to understand the state of the system. In Information theory, entropy can be defined as a measure of the uncertainty associated with a set of data. The usefulness of entropy as a measure of uncertainty in various aspects of business has received some attention so far in the academic literature (Ebrahimi, Maasoumi, & Soofi, 1999; Blecker, Kersten, & Meyer, 2005; Calinescu, Efstathiou, Sivadasan, Schirn & Huatuco, 2000; Cardoso, 2005; Dionisio, Menezes, & Mendes, 2005; Efstathiou et al., 1999; Frizelle, 1998; Frizelle & Woodcock, 1995; Gleik, 2011; Gonzales, Rubio, Gonzales, & Velthuis, 2010; Jung, Chin, & Cardoso, 2011; Karberger & Masoon, 2001; Kumar, 1987; Li & Vitanyi, 2008; Rao & Gu, 1994; Lassan & van der Aalst, 2009; Scuricini, 1988; Shannon, 1948; Shuiabi, Thomas, & Biuyan, 2005; Sivadasan, Efstathiou, Frizelle, Shirazi, & Calinescu, 2002; Wilding, 1988; Yao, 1985). These researchers have looked, collectively, at the following important issues:
Differentiating between the structural and dynamic types of complexity in the business.
Justifying the information theory variant of entropy as a valid measure of supply chain complexity.
On the use of Hidden Information
6 | P a g e
All of the referenced research involving entropy as a measure of complexity use Shannon’s (1948) information theory variant as a definition. The validity of which will be considered in more detail later.
In the physical sciences entropy has developed in two forms: macro level entropy developed by Clausius (c.1850) and micro level entropy developed by Gibbs and Boltzmann (c.1867). The relationship between the micro level physical science variant and the information theory variant can be traced back to Shannon’s 1948 research. To be specific, although almost identical in form, the Gibbs – Boltzmann and Shannon equations were developed separately. Folklore has it that it was only after Shannon developed his research – aparently during a conversation between Shannon and Jon von Neumann – that the similarity in forms led to the label ‘entropy’, already applied to the Gibbs – Boltzmann variant, being applied to the Shannon information theory variant. The validity of this labeling and the form of the formula have already been questioned to some extent (Ben- Naim, 2011; Tsallis, 2009). Given this, the assumption that Shannon’s variant of entropy as a measure of uncertainty in the above research should be revisted; consequently, this research will review the Shannon variant for entropy and propose a modified approach relevant to the understanding of complexity in the supply chain.
On the use of Hidden Information
7 | P a g e
processes in that with graph theory, linkages as well as activities are considered. Furthermore, the study of supply chain management as a network is essential: Dorogovtsev (2010) argues that specific network architectures, namely cage graph architectures, in synchronised systems - like a supply chain - offer an optimal architectural design. That said, graph theory, in the context of understanding supply chains does have limitations; these will be explained later in the thesis along with an alternative approach to the use of graph theory in understanding supply chain complexity.
The origins of information theory appear to be attributed to Ralph Vinton Lyon Hartley of Bell Laboratories who, in 1927, published what appears to be the first seminal work on the subject. This was followed, in 1948, by the work of Claude Shannon, also from Bell Laboratories, who published what has become the de facto standard for formulating the understanding of complexity in information theory: Entropy. It is worth noting that Hartley did not use the term entropy, and his formulations for information theory did not align with the physical sciences or Shannon formulations. Shannon’s 1948 work on information theory is not without its critics: In 2009 Tsallis questioned the form and universality of the phenomena labeled ‘entropy’; offering a non-extensive version as an alternative. In 2011 Ben-Naim questioned the formulation and labeling for what Shannon termed entropy; proposing alternative formulations and a different name for what entropy is supposed to represent. Thus it makes sense in this research not to accept – as has been the case with other research in the field – Shannon’s version as the de-facto standard.
On the use of Hidden Information
8 | P a g e
existing research on the application of entropy as a measure of uncertainty in the supply chain, and more specifically, to explore the relationship between entropy as a measure, and the organisational structure of the supply chain. Secondly, to explore the use of an alternative method for capturing uncertainty and complexity in the supply chain. In doing so the research will not lose sight of the issue of actor legitimacy as an input to the sustainment, addition to, or removal of uncertainty and complexity in the supply chain. The hope is that this research will contribute considerably towards advancing the current state of knowledge in this area, and provide an approach that is easy to use from a practitioner perspective.
1.2
Motivation
On the use of Hidden Information
9 | P a g e Figure 1: Foundation of Systems Thinking (adapted from Gharajedaghi, 2011)
The motivation for the thesis – thinking about supply chains as a system – calls for a research strategy and design that recognises the systemic nature of the topic. Because of this systemic view, the next few section will take some time to outline the issue of research strategies before defining the specific strategy and design to be used.
1.3
Relevance
On the use of Hidden Information
10 | P a g e
1.4
Aim and Objectives
The aim of this research is to synthesis the use of entropy, network theory and information theory as an approach for understanding uncertainty - as complexity of form in structural components in a supply chain system.
The objectives of this research are five-fold and can be summarised in the following points:
To critically review the existing literature to appreciate the various approaches in this domain.
To advance the current state of understanding in the area by introducing an amended approach to conceptualising complexity in the supply chain. To investigate and compare the use of entropy as a measure of complexity,
with a revised measure proposed herein.
To reflect on the experimental findings and comment on the role of the actor in upholding the structural perspectives.
To develop an approach that is reasonably practical to implement.
1.5
Research Questions
On the use of Hidden Information
11 | P a g e
1.6
Contribution
The contribution to theory and practice made by this research can be summarised in five distinct points. The existing literature broadly relates complexity with variability; that is, variability is a component of the complex environment. This research looks to separate out variability from complexity. The reasoning for this is that variability is an everyday occurrence in business; the management of which is a pre-requisite of business operation. Variability has an impact on the parameters of process execution and, as a consequence, the operational complexity. It does not have an impact on structural complexity unless the variability exceeds the structural components of the supply chain; in which case the structure and operations become chaotic; a higher order complexity. A framework that enables the understanding of the extent of supply chain process and parameter dispersion necessary– the variability - to govern and operate a supply chain is required.
Research into the use of information theory and entropy as a measure of uncertainty has been carried out in some operational domains, and there appears to be little research on the application of the two theories in a supply chain context. The purpose of this research is to further contribute to this field of research.
On the use of Hidden Information
12 | P a g e
The business process model, from a non-information technology perspective, does not bring with it the logic gate construct necessary for an IT workflow construction. Such IT workflows offer a measure of complexity as a function of the logic gate construction. Where the business process model is not part of a logic gate construct, but is part of a business governance model, the ability to quantify a method for understanding complexity in business processes will contribute to the effective application of business processes to business operations.
From a research perspective Hartley (1927) explained the relationship between the length of the message, the language and the amount of information communicated; that is, as the number of language symbols reduce, for a give piece of information, the length of the message increases. Recognising this, there is a need to understand the effect on information brought about by the aggregation of the original language into a summarised language. It follows that if a language is aggregated into a lesser language, more symbols would be required to describe the state of the systems, and yet, in the case of management information, the structured approach assumes information can be aggregated into a lesser language without the loss of information. This seems contrary to Hartley (1927); hence there is a need to understand the effect on information, brought about by the aggregation of a language into management information. Understanding this contradiction will be a further contribution.
Finally, apocryphal, anecdotal or otherwise, the story surrounding the label ‘entropy’ defined by Shannon and associated with the form −𝑝 log 𝑝 for information theory has been questioned. This research contributes by further analysing and questioning this association.
On the use of Hidden Information
13 | P a g e
1.7
Method
The research will take a generally positivistic approach to analysing the process structures of organisations using a common process language (SCORTM) and using entropy as a measure of complexity. Initially, and for the purposes of this thesis, the research will be experimental; however, it is hoped that, post this piece of work, the approach can be developed and tested further through data provided either directly or via online data entry that will be developed and made available at www.supplychaincomplexity.co.uk. The latter approach is the outcome of the researcher’s efforts to establish a dedicated site to facilitate further research in this area. Throughout the research a thread of critical realism is maintained, sometimes the texts winds and twists in support of this epistemology; for instance, chapter four takes some time to contextualise and define fully the research ontology and epistemology. The author askes for your indulgence in this section, it does eventually contribute directly to the research findings.
1.8
Thesis Structure
The remainder of this research is set out as follows: Chapter 2 sets out the theoretical foundations for the research; focussing on entropy, information theory and network theory, before developing a revised model. Chapter 3 is a short section that sets out the research question; which is followed by Chapter 4 that takes time to set out the issues of research and the methodology. The analysis and discussion are presented in Chapters 5 and 6 respectively. Chapter 7 draws conclusions from the research.
On the use of Hidden Information
14 | P a g e
On the use of Hidden Information
[image:28.842.87.771.140.458.2]16 | P a g e
2
Chapter Two: Theoretical Foundation
2.1
Background
17 | P a g e
location and at the right time, in order to minimize system wide costs while satisfying service level requirements. Ayers (2001), Supply chain management is the design, maintenance and operation of the supply chain processes for the satisfaction of the end user.
The various definitions of supply chain management have continued to mature: Emmett and Crocker, (2006) define supply chain management as ‘The process that integrates, coordinates and controls the movement of goods, materials and information from the supplier through a series of intermediate customers to the end customer’. In some cases the definition is contingent on other business activities. Wang et al. (2007), using the work of Narasimhan and Mahapatra (2004), take this perspective by suggesting 'a supply chain is established when there is integration of operations across its constituent entities, namely, the suppliers, partners, and business customers.' Another alternative perspective is that of defining what a supply chain is rather than what it does or what is the situation in which a supply chain emerges. Bowersox, Closs and Cooper (2007) took this approach by suggesting supply chain management is an amalgam of organisations collaborating to leverage their position and improve operating efficiency. For each firm involved, the supply chain relationship reflects a strategic choice.
.
18 | P a g e
underlying elements of information, human resources and organisational structure. The impact of organisational structure of supply chains will be a feature of this research.
Supply chains as a structure are further complicated with the recognition that they act as a consequence of behavioural free will; the structure needs human intervention to make it work. This perspective has been noted relatively recently by Sokolov and Ivanov (2010) who take a complex adaptive systems perspective by recognising the complex dynamics and behavioural influence: 'Supply chains may be justifiably called complex dynamic multi- structural systems with active elements of free will behaviour'. Whilst this perspective is only recent to supply chain management research, it has been previously researched in the wider management domain; for instance, Dooley (1997) defined complex businesses as 'semi- autonomous organisational members interacting at many levels of cognition and action.' Given these varied and maturing definitions of supply chain management, for research in the subject to be succinct, a specific definition for the supply chain management metaphor relative to this research is required. This will be developed later in the text.
19 | P a g e
new. Sterman (2000) in his book Systems Dynamics uses a supply chain as an example of the complex systems interplay of a business. While complex, the advantages of such an approach were highlighted by Cousins and Menguc (2005), who extended the work of Barney (1991) but contradict the work of Dierickx and Cool (1989) in asserting that strategic advantage in an inter-organisational context can be accumulated outside the individual organisation. The research on organisations as complex systems continues, see for instance, Stacey (2010), Shaw (2001) and Streatfield (2002) are interesting examples, but their specific areas of research are beyond the scope of this thesis.
20 | P a g e
Thus far dimensions of material, information, data, structures and behaviours have been described as being key to a succinct definition of supply chain management. Before a research specific definition can be attempted, there appear to be three further aspects to consider. Firstly. Dooley (1997), referring to the work of Ackoff and Emery (1972) and Hayles (1991), asserts the management paradigm of any given era can be aligned with the prevailing era’s scientific lead paradigm; a model that suggests, for instance, that structural aspects of the organisation are contingent on research on organisation structures. Similarly, Emmett and Crocker (2006) relate changes in the supply chain management paradigm to the parallel changes in technology and business approaches. It follows that cognisance of current research trends and topics will add a further dimension to any definition. Secondly, an organisation ecology view - where the attributes of the organisation are tested in a Darwinian paradigm, with the 'fittest' surviving - has been suggested by Hannan (Hannan & Freeman, 2004). Importantly, this view captures the life cycle of the organisation and attributes therein, i.e. the simple need for ongoing innovation in, and transformation of, a business in order to sustain a competitive market position. Any definition should recognise this need for continuous evolution of an organisation’s attributes.
21 | P a g e
simply, individuals are only boundedly rational and only able to view things from their own cognitive perspective.
From all the above a revised definition of supply chain management is offered:
Based on the individuals’ perceptions, research and understandings, the complex interplay between inter and intra organisation structures that systemically move material, information, data and funds between entities may be called a supply chain.
Interestingly, a level of complexity, interpreted by actors using only boundedly rational logic, is not a new issue. As far back as 1974 Galbraith discussed the manner and methods adopted by organisations coping with complex or uncertain environments. Specifically, reducing the need for information, increasing the capacity for information acquisition, storage and retrieval. There is a need to be certain on the concepts raised by Galbraith; complexity is a wide and variously studied subject; equally, risk and uncertainty are intertwined as concepts that have different meanings. Coase (1937) referring to Knight (1933), suggested risk to be something that a decision maker can assign a mathematical probability to; whereas uncertainty cannot be expressed in such terms. Keynes (1937) reiterated the same sentiment; hence a measure of complexity related to the measureable components necessary to manage uncertainty would be useful when considering supply chain structures.
2.2
Complexity
22 | P a g e
and behaviour (North & Macal, 2007), and business dynamics (Sterman 2000). Stacey (2010) asserts there to be no single science of complexity, but all complexity sciences contain the problem of non-linear interactions which, in turn, leads to the problem that the models for such systems cannot be solved. The removal of the direct cause and effect relationship resonates in organisations where human interaction and interpretation create a nonlinear element to the organisations capability (Prigogine 1997.) From a supply chain perspective, complexity has been considered from a number of views.
23 | P a g e
metaphor in the input deterministic sense; that is, this is a complex non-linear system. The inputs may be known, but the outputs are indeterminate and probable.
A further field of research has been the application of complex adaptive systems theory to the supply chain domain. Choi, Dooley and Rungtusanatham (2001) conceptualised supply networks as complex adaptive systems, proposing ten propositions for understanding the complex perspective. From the supply chain management perspective Sivadasan et al. (2002) suggest the interacting network of a supply chain can be inherently complex. Their definition of complexity synthesises the work of Frizelle's (1998) two class complexity construct with the entropic view of Calinescu et al., (2000), which states that a systems entropy represents the amount of information required to describe the state of the system. The combination of the two perspectives suggests that operational complexity can be quantified as the amount of information required to monitor the state of the system.
24 | P a g e
re-order points will be a function of complicatedness in the organisation and process structure. In this research we intend to recognise operational complexity as having a given amount of variation necessary for the smooth operation of the business; therefore operational complexity is defined as the dispersion of information and data across the structure of the business. Frizelle and Woodcock (1995) argued that structure comes before operations, for an organisation to remain in control. This is obviously correct. The organisation governance structure, functions, processes and parameters need to be in place before an operation embarks on throughput; otherwise the operation is simply not in control. If operation were to reach this point they would become analogous to the subjective component described above. Complexity then refers to a determinist component found within the structure of the supply chain, the complexity of the functions, processes and parameters necessary to keep the operational element in control.
25 | P a g e Figure 3: Structural and Operational Complexity
26 | P a g e
to manage and control the information that ensures the operational flow through a multi enterprise supply chain solution.
27 | P a g e
The Range of Processes required to discharge the scope of the defined Operation x T h e S c a le o f P ro c e s s e s r e q u ir e d t o d is c h a rg e t h e s c o p e o f th e d e fi n e d O p e ra ti o n y
P (x1;y1)
[image:40.595.104.535.77.308.2]P (xn;yn)
Figure 4: Diagrammatic representation of the range and scales of supply chain processes necessary to operate the business.
Where 𝑥𝑛 𝑋 are the processes from the set of processes 𝑋 necessary for the controlled operation of the defined business, and 𝑦𝑛 𝑌 are the parameters from the set of parameters Y necessary to limit the range of allowable values in the processes 𝑥𝑛 such that all the allowable business scenarios and data elements can be managed. As such, the structure of the business equates to the range and scale of the defined processes:
∑(𝑥1𝑦1. . . 𝑥𝑛𝑦𝑛) Equation 1
28 | P a g e
𝑃(𝑋; 𝑌) = (𝑝[𝑥1; 𝑦1] … . 𝑝[𝑥𝑛; 𝑦𝑛]) = 1 Equation 2
This type of process structure and probability resonates with the entropy measures used by previous authors; using derivations of entropy from the physical sciences or from information theory. For the purposes of this research entropy and information theory will, initially, be considered separately. The reason for this being that ultimately, the intention is to use the most appropriate application of the two when dealing with the structural and operational components of uncertainty discussed above.
2.3
Entropy
The origins of entropy can be found in statistical physics. Clausius formulated the second law of thermodynamics in circa 1865 via a statement that heat always flows from hot bodies to cold bodies; never the reverse. For this to happen matter must have an a priori state which he labelled entropy. The usual assertion is that entropy, from an information theory perspective, is a derivative of the physical approach. While the correlation between the two concepts almost holds, the correlation was discovered after the development of the information theory approach through the work of Hartley (1927) and then Shannon (1948), (Gliek, 2011).
29 | P a g e
was no entropy in the information process, then no information passed between source and recipient; an argument that aligns well with the point made by Williamson (1975) that business value is reliant on exchange over asymmetric states. Entropy then is the degree of uncertainty associated with the transition of information through the communication process. A simpler definition is proposed by Gliek (2011): ‘Entropy is the number of questions needed to arrive at the information required’.
Descriptions of entropy change with respect to the application. In information theory entropy is described as a numerical measure of the uncertainty of an outcome. In physics… a thermodynamic quantity representing the amount of energy in a system that is no longer available for doing mechanical work, entropy increases as matter and energy in the universe transitions to a state uniformity. In thermodynamics, entropy is commonly associated with the amount of order, disorder, and/or chaos in a thermodynamic system. In computing, entropy is the randomness collected by an operating system or application for use in cryptography or other uses that require random data. In this research the definition of entropy will be aligned with the information theory understanding; the origins of which – according to Gliek (2011) - seem to emanate from Hartley (1927) and Shannon (1948) at Bell laboratories where Hartley began to build the mathematical formula; beginning with:
𝐻 = 𝑛 log 𝑠
.
Equation 330 | P a g e
must be transmitted to get across a given amount of information (Gleik, 2011). Examples of this type of redundancy are easy to find, the police phonetic language is a good example.
The history of entropy as a measure in information theory, from its origins in the work of Hartley (1927) and Shannon (1948), would seem to be straight forward; this is not the case. Hartley’s 1927 paper does not refer to entropy, neither does the formula in Equation 3 align with the popular perception of entropy as
𝑠 = ∑ −𝑝 𝑙𝑜𝑔𝑝
𝑛
1
Equation 4
Furthermore, entropy in information theory has been questioned from a metaphorical and construction sense. There is considerable research already in place that uses Shannon entropy as a basis; however, because of the metaphorical and form construction issues, which will be detailed later, one of the intention in this research is to justify the use of entropy as a measure; this will include a review and critique of the work of Hartley and Shannon later in this chapter.
31 | P a g e
denominations seems to be helpful’. Ben Naim (2009) continues with reference to Tribus’s (1971) story on Shannon’s naming:
‘What’s in a name? In the case of Shannon’s measure the naming was not accidental. In 1961 Tribus asked Shannon what he had thought about when he had finally confirmed his famous measure. Shannon replied, ‘My greatest concern was what to call it. I thought of calling it information, but the word was overly used, so I decided to call it uncertainty. When I discussed this with John von Neumann, he had a better idea. Von Neumann told me: you should call it entropy, for two reasons. In the first place your uncertainty function has been used in statistical mechanics under that name. In the second place, and more important, no one knows what entropy really is, so in the debate you will always have the advantage’. Tsallis, on the first page of the preface to his 2009 book ‘Introduction to non-extensive statistical mechanics’ quotes the majority of the same text, this time referencing back to Tribus and McIrvine (1971) (readers interested in the further debate on this anecdote should refer to http://www.eoht.info/page/Neumann-Shannon+anecdote). Ben-Naim (2009) goes on to quote Denbigh (1981): ‘In my view von Neumann did science a disservice. There are, of course, good mathematical reasons why information theory and statistical mechanics both require functions having the same formal structure. They have a common origin in probability theory, and they also need to satisfy certain common requirements such as additivity. Yet, this formal similarity does not imply that the functions necessarily signify or represent the same concept. The term ‘entropy’ had already been given a well-established physical meaning in thermodynamics, and it remains to be seen under what conditions, if any, thermodynamic entropy and information are mutually inconvertible’.
32 | P a g e
already some confusion as to what entropy actually is. In addition, previous research on the use of entropy in operations and supply chain management has largely chosen to assume Shannon to be correct in using the term, and form, entropy; thus, these arguments have been developed from the Shannon assumption forward. This research intends to go beneath this assumption, to understand more of the function of the form in order to understand it’s applicability in the business context used herein.
A second point is this, as we will discover later, entropy has been variously linked with degrees of information, uncertainty, mixed up ness etc. However, from an information theoretic perspective a simple description developed by both Gliek (2011) and Ben-Naim (2008) is this: It is the number of additional binary question needed to understand the state of the system. This is easily understood by example. Take 32 identical boxes and into one place an arbitrary object, mix the boxes up. It will take five binary questions to identify the box in which the arbitrary object resides (keep dividing the boxes in half). Another way of describing this is that it will take 𝑙𝑜𝑔232 = 5 binary question. In addition, entropy is a function of volume; as volume increases so too does entropy, the thermodynamic term ‘extensive’ will explain this phenomena later in this section. Later, the text will demonstrate how this assertion misses a point on information structure, which calls for an additional dimension to be added to the assertion for it to remain valid; however, for now, the combination of these two points is the starting point for this research.
33 | P a g e
equals zero in the eyes of the experimenter and observers; however, to those who are unaware of the outcome – the information available from the experiment – the entropy - remains at one. This is further demonstrated in the classic thought experiment by Erwin Schrödinger: Outside the box the observer perceives a maximum entropy of one until the box is opened and the state of the cat known. Inside the box, the cat is pretty sure of its state throughout the experiment. The point is that to the observer not directly connected with the experimental activity, there is some form of hidden information that increases entropy. The concept of hidden information will be developed later.
34 | P a g e
It is important to clarify meanings applied through the rest of this thesis. Entropy will refer to the classic version of the form developed by Boltzmann (thermodynamics) and Shannon (Information theory). Other terms will be used throughout this thesis; for instance, ‘missing information’ or ‘hidden information’. Where these other terms are used, the relationship between the other term and entropy will be explained. Also, from a notation perspective, generally 𝑆 is used to denote thermodynamic entropy and 𝐻 for the information theory variant. Both of these notations will be used in this thesis to distinguish the type of entropy being discussed; however, practically, for the purposes of this research the two notations can be considered interchangeable. In some sections reference will be made to different forms of entropy, Renyi entropy, for instance; in these cases the form will be clearly stated.
The term entropy has been attached to the concept of diffusion or complexity as explained by Shannon. The metaphor has been attached because the formula for this diffusion or complexity closely follows the formula for entropy in the thermodynamics environment. This may be appropriate; that is, it is correct to attach the metaphor to the information theoretic formulation because the derivation of the formula in the information theory environment follows a similar logic to that in the thermodynamics environment, they are both based on probability theory. The purpose of the next section is to test this assumption and agree or disagree with the attachment of the metaphor to the common formula. The section is intended to explain the concept from an understanding perspective rather than a perspective of testing the proof for the formulaic development.
35 | P a g e
system, and the issue of the allocation of units of measure to the transition between the statistical version developed by Boltzmann, and the macro version developed by Clausius. This will be followed with a section to review the basic underpinning assumptions for the second law of thermodynamic that are required for entropy to be valid in this field.
2.3.2.1 Statistical Mechanics
36 | P a g e
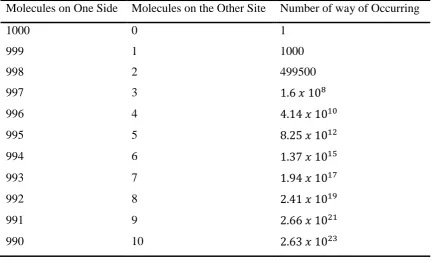
[image:49.595.96.531.474.737.2]Let us now consider a different - but classic in the field of entropy - thought experiment that will enhance the journey towards our understanding of entropy. Consider a box, sealed off from its surroundings such that is nothing can permeate the sides of the box. The box is divided into two sections by a partition and in the partition is a very small hole. In one side of the box there are 1000 molecules of gas moving around freely and bouncing off each other and the sides of the box. Let’s say that 99.9% of the time this bouncing around continues; but, 0.1% of the time one of the molecules passes through the hole into the opposite side of the box. Let’s say that this happens every second so after one second there is one molecule, after two seconds two, three seconds three and so forth. If we take the state of the box after two seconds, with two molecules on one side of the box and 998 on the other. How many different ways are there for this to occur; that is, we cannot be sure which of the molecule have transitioned to the opposite side of the box, it can be any of the 1000. All we know is that 2 of the molecules have transitioned. Table 1shows how the number ways the probability of 1, 2, 3, etc. molecules increases for the first 10 occurrences.
Table 1: Table of molecule distributions.
Molecules on One Side Molecules on the Other Site Number of way of Occurring
1000 0 1
999 1 1000
998 2 499500
997 3 1.6 𝑥 108
996 4 4.14 𝑥 1010
995 5 8.25 𝑥 1012
994 6 1.37 𝑥 1015
993 7 1.94 𝑥 1017
992 8 2.41 𝑥 1019
991 9 2.66 𝑥 1021
37 | P a g e
To put these numbers in perspective. At the point where there are 974 molecules one side of the box and 26 on the other, the number of ways in which this scenario can occur is
1.79 𝑥 1051
Equation 5
By comparison the estimated number of atoms in the whole of the world is suggested to be:
1.33 𝑥 1050 Equation 6
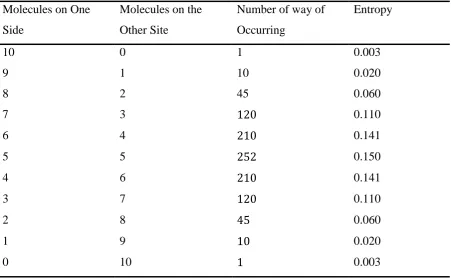
[image:50.595.88.540.421.699.2]Considering only the first few combinations the numbers become vast; so let’s now repeat the thought experiment, but this time with a much smaller number of molecules; this time we will only consider 10 molecules. The same table, for only 10 molecules, is given in Table 2, and this time entropy has been included.
Table 2: Additional molecule distributions.
Molecules on One Side
Molecules on the Other Site
Number of way of Occurring
Entropy
10 0 1 0.003
9 1 10 0.020
8 2 45 0.060
7 3 120 0.110
6 4 210 0.141
5 5 252 0.150
4 6 210 0.141
3 7 120 0.110
2 8 45 0.060
1 9 10 0.020
38 | P a g e
We can see here that there is a distribution of probabilities. As the number of molecules on either side of the box moves towards equilibrium (5 on each side), the number of ways the scenario can occur increases to 252; that is, there are an increasing number of ways a particular scenario can occur as the probability of there being an equal number of molecules on each side of the box reaches equilibrium. So in this example there are 252/1024 ways of achieving equilibrium and only 1 in 10 ways of having 9 molecules on one side, and one on the other. Equilibrium, or near to states of equilibrium are therefore more probable. Of course, both Table 1 and Table 2 are representation of (𝑛
𝑘) binomial distributions where there are 𝑘 successes in 𝑛
trials and
(𝑛
𝑘) =
𝑛!
𝑘! (𝑛 − 𝑘)! Equation 7
39 | P a g e
marbles in a similarly constructed box, or elephants wandering around in two holding pens. In 1983 Jaynes (from Ben-Naim, 2008, Chapter 1, loc. 685. ) stated:
‘The function H is called entropy, or better, information entropy of the distribution 𝑝𝑖. This is an unfortunate terminology which now seems impossible to correct. We must warn at the outset that the major occupational disease of this field is a persistent failure to distinguish between information entropy, which is a property of any probability distribution, and experimental entropy of thermodynamics, which is instead a property of a thermodynamic state as defined, for example, by such observed quantities as pressure, volume, temperature or magnetism of some physical system. They should never have been called the same name: the experimental entropy makes no reference to any probability distribution, and the information entropy makes no reference to thermodynamics. Many textbooks are fatally flawed by the author’s failure to distinguish between these entirely different things, and in consequence proving nonsense theorems’.
It seems the logic used for the application of the term ‘entropy’ needs not to be re-defined, but to be recalibrated: If we identified a particular business scenario that could be explained by, say standard deviation; following which a second, completely different business scenario was identified where standard deviation could again be used; we would not argue over the term standard deviation as applied to the two scenarios, instead we would seek to define the scenarios in which standard deviation can be applied. This seems to be the case with entropy: the formula − ∑ 𝑝𝑙𝑜𝑔𝑝 can be applied to any probability distribution and should therefore be referred to as a statistical concept rather than an applied concept.
40 | P a g e
had units of Joules/Temperature, heat energy over temperature. Boltzmann’s definition
− ∑ 𝑝𝑙𝑜𝑔𝑝 is unit agnostics until Boltzmann’s constant 𝑘 is added, at which point the unit of
measure becomes Joules/Temperature and the value of the constant aligns the values of this form with those of the Clausius form. Without Boltzmann’s constant the measure is free of units. The purpose of Boltzmann’s constant is to correlate the outcome of the Boltzmann calculation with the Clausius calculation for the material being considered. Logically then, if we label only Clausius’s version as entropy, − ∑ 𝑝𝑙𝑜𝑔𝑝 only becomes entropy after the application of Boltzmann’s constant. Prior to this application − ∑ 𝑝𝑙𝑜𝑔𝑝 is unit less, nameless and a function of probability analysis.
2.3.2.2 The Second Law
The second law of thermodynamic was first stated by Clausius (c1850):
‘It is impossible to construct a system operating in a cycle which transfers heat from a cooler body to a hotter body without work being done on the system by the surroundings.’
Further attempts were made by Caratheodory (1909) and Plank (1927) to better clarify the second law and Li and Vitanyi (2008) more recently stated the second law as ‘No process is possible that has as its only results the transformation of heat into work’. It is important to recognise the second law – like the first - cannot be proven. It is only because the prediction of the second law are followed and the consequences of the law make sense, that the law itself is generally accepted; thus a corollary of the second law is that there exists a property of state, entropy S, defined as:
𝑑𝑆 ≥ 𝑑𝑄𝑟𝑒𝑣
41 | P a g e
Where 𝑑𝑄𝑟𝑒𝑣 is the reversible heat energy transfer to the system (Joules); 𝑇 is the temperature in degrees Kelvin, with the equals sign indicating a reversible process and the greater than sign indicating an irreversible process. It is worth recalling the definitions of a system: Universe is totality and consists of a system in surroundings. Equation 9 refers to a system that does not reside isolated from surroundings or universe; thus, for a system to be reversible the entropy change of the system and that of the universe are zero:
𝑑𝑠(𝑠𝑦𝑠𝑡𝑒𝑚) + 𝑑𝑠 (𝑠𝑢𝑟𝑟𝑜𝑢𝑛𝑑𝑖𝑛𝑔𝑠)
= 𝑑𝑠 (𝑢𝑛𝑖𝑣𝑒𝑟𝑠𝑒) = 0 Equation 9
For an irreversible process the total entropy change of the universe is greater than zero:
𝑑𝑠(𝑠𝑦𝑠𝑡𝑒𝑚) + 𝑑𝑠 (𝑠𝑢𝑟𝑟𝑜𝑢𝑛𝑑𝑖𝑛𝑔𝑠)
= 𝑑𝑠 (𝑢𝑛𝑖𝑣𝑒𝑟𝑠𝑒) ≤ 0 Equation 10
The classic view of entropy is further developed by the statistical formulation developed by Boltzmann and Gibbs. The basis of the statistical argument is that, at the macro level defined by the classic view, the state of the systems averages out at a given state or temperature or pressure. However, at the micro level, there remain differences in pressure, temperature, phase state etc. but this energy un-useable (Remember the mixed sand where the average colour is green). The classic explanation of statistical entropy is to consider – as was explained above - a finite number of molecules in a sealed box. In the centre of the box is a divider with a hole in it to let molecules pass from one side of the box to the other. The chances of finding a molecule in one side of the box or the other is 1
42 | P a g e
or the other is (1
2)
𝑛 where 𝑛 is the number of molecules. Boltzmann’s argument was that there are statistically more probabilities of disordered states in a systems than there are of ordered states; thus, the macro state with the greatest number of accessible microstates is more likely; conversely, the macro state where all microstates are dynamically aligned, is the ‘most improbable case conceivable’.
In statistical thermodynamics entropy 𝑠 is defined as the natural logarithm of the number of distinct microstates 𝑤 available, given the constraints of the macro system. Alternatively, entropy is a measure of the probabilities of the system distributed over the possible microstates.
𝑠 = 𝑘𝑙𝑜𝑔𝑒𝑤 Equation 11
Where 𝑘 is a constant of proportionality making the statistical form equal to classic version.
𝑘𝑙𝑜𝑔𝑒𝑤 =
𝑑𝑄𝑟𝑒𝑣
𝑇 Equation 12
The assumed universality of Boltzmann – Gibbs classic definition of entropy has occasionally been brought into question. Tsallis (2009) quoted from Gibb’s original research and suggested two assumptions for the applicability of the classic Boltzmann –Gibbs form:
1. The partition function 𝑍 must exist.
2. The form must be excluded from cases where gravity exists as an effect.
43 | P a g e
𝑝𝑖 =
1
𝑁 Equation 13
For all 𝑤 in cases where 𝑝𝑖 is not equiprobable, the equation takes the form
𝑠 = 𝑘 ∑ 𝑝𝑖 𝑙𝑜𝑔𝑝𝑖
𝑛
1
Equation 14
This being the weighted sum of the probabilities. In this form 𝑝𝑖 is the Gibbs distribution necessary for the above equation to function where:
𝑝𝑖 = 𝑒
−𝐸/𝑘𝑇
𝑍 (𝑇) Equation 15
And the partition function 𝑍 (𝑇) equals:
𝑍 (𝑇) = ∑ 𝑒−𝐸/𝑘𝑇
𝑛
1
Equation 16
44 | P a g e
over universality. Given this question over universality it is reasonable to offer modifications to the form and approach for applications, as has been the case with, for instance, the application of other entropy methods: Renyi, Kolmogorov, Kullbeck – Liebler etc.
This section has provided an overview of entropy in the thermodynamic sense. It has shown the Clausius, macrostate version of entropy, the Boltzmann-Gibbs microstate version of entropy, and the relation between the two. It has also explained the issues with the use of the term and how this impacts on, for instance, assumptions about the units of measure, the universal applicability and the prerequisites to the use of the Boltzmann - Gibbs form. It has already been stated that entropy has forms in thermodynamics and information theory, among others. We will now look at entropy from an information theory perspective and develop further an argument for a different approach to the use of the form.
2.4
Information Theory
As with entropy, and to hold to the research paradigm and method, this section will begin with an overview of the basics of information theory, before reviewing in detail the seminal works on the subject by Shannon (1948) and Hartley (1927). The section will then go on to review the existing research on the application of information theory in supply chain management, which includes the application of information theoretic entropy. Finally the section will look at the implications of the use of information theory in this research and propose a set of terminologies to be used moving forward.
45 | P a g e
that information theory could say something to the management of information within the supply chain. Take two binary strings of 30 digits:
101010101010101010101010101010 011011001011100110010001110110
Shannon (1948) questions the amount of information contained in each string. The more a string is compressible, the less information; in which case, the first string: print 10, repeat 15 times, stop, is a shorter definition than B and therefore carries less information. Kolmogorov complexity takes an algorithmic view of the same notion, asserting the complexity of an object to be proportional to its shortest description. Random, in this sense, refers to the degree of absence of regularity. The Kolmorgorov complexity of a system is defined as the computational resources required to specify the object (Li & Vitanyi, 2008). For instance, take to following string: abcabcabcabcabcabcabcabcabcabcabcabcabcabcabc; which could be described, using English language, as print 'abc' 15 times, stop; or, 15'abc', stop.
Or, take the following string: 1101001100; which has the property that position z is a 1 if the binary expansion of position z contains an odd number of 1's; that is:
Table 3: Binary expansion of position z.
Position 1 2 3 4 5 6 7 8 9 10
B
inar
y
Expa
nsion
1 1 1
1 1 1 1 0 0 0
1 1 0 0 1 1 0 0 1
1 0 1 0 1 0 1 0 1 0
Total 1 1 2 1 2 2 3 1 2 2
46 | P a g e
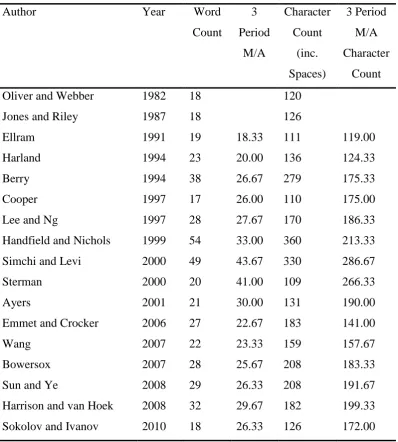
47 | P a g e Table 4: Data count from supply chain management definitions.
Author Year Word
Count
3 Period
M/A
Character Count
(inc. Spaces)
3 Period M/A Character
Count
Oliver and Webber 1982 18 120
Jones and Riley 1987 18 126
Ellram 1991 19 18.33 111 119.00
Harland 1994 23 20.00 136 124.33
Berry 1994 38 26.67 279 175.33
Cooper 1997 17 26.00 110 175.00
Lee and Ng 1997 28 27.67 170 186.33
Handfield and Nichols 1999 54 33.00 360 213.33
Simchi and Levi 2000 49 43.67 330 286.67
Sterman 2000 20 41.00 109 266.33
Ayers 2001 21 30.00 131 190.00
Emmet and Crocker 2006 27 22.67 183 141.00
Wang 2007 22 23.33 159 157.67
Bowersox 2007 28 25.67 208 183.33
Sun and Ye 2008 29 26.33 208 191.67
Harrison and van Hoek 2008 32 29.67 182 199.33