Reproducibility of soundscape dimensions
Davies, WJ and Murphy, J
Title Reproducibility of soundscape dimensions Authors Davies, WJ and Murphy, J
Type Conference or Workshop Item
URL This version is available at: http://usir.salford.ac.uk/23157/ Published Date 2012
USIR is a digital collection of the research output of the University of Salford. Where copyright permits, full text material held in the repository is made freely available online and can be read, downloaded and copied for noncommercial private study or research purposes. Please check the manuscript for any further copyright restrictions.
Reproducibility of soundscape dimensions
William J. Daviesa) Jesse Edward Murphy
Acoustics Research Centre, University of Salford Newton Building, The Crescent, Salford M5 4WT, UK
The aim of this work was to investigate the validity of laboratory soundscape reproduction and the robustness of soundscape dimensional analysis. The soundscapes in four urban locations in Manchester (UK) were recorded with a soundfield microphone. The soundscapes were reproduced through an ambisonic 3D loudspeaker system in a semi-anechoic chamber. Fifteen listeners rated the reproduced soundscapes on nineteen eleven-point semantic differential scales. Factor analysis revealed that four dimensions explained 65% of the variance in the judgements. The dimensions were: relaxation/calmness (41%), dynamics/vibrancy (10%), communication (7%) and spatiality (7%). This experiment can be compared with that of Kang (2007), who used very similar rating scales on outdoor soundwalks in two locations in Sheffield (UK). Kang found dimensions of relaxation (26%), communication (12%), spatiality (8%) and dynamics (7%). The dimensions from the two experiments load onto the semantic scales in a similar way. These results indicate that ambisonic reproduction of soundscapes gives similar results to field experiments, though with more variance explained. They also show that dimensional analysis of soundscape response is robust enough to produce similar results for different locations in different cities. It is suggested that the dimensions that result from this kind of experiment depend somewhat on the rating scales and questions used. Nevertheless, soundscapes and their perceptual dimensions both seem to be reproducible to a meaningful extent.
1 INTRODUCTION
There are several ways to approach the task of characterising the structure of soundscape perception and cognition. The most popular approaches1 seem to be: sound and soundscape classification,2, 3 cognitive models,4, 5 dimensional analysis and interviews or focus groups.6, 7 This paper reports a new dimensional analysis.
a)
Decomposing soundscape perception into its constituent dimensions is an attractive analysis technique because it has worked so well in auditorium acoustics. It is generally accepted that the sound of a concert hall has four subjective dimensions: loudness, reverberance, clarity and spaciousness.8 These can all be predicted to a useful extent by acoustic measurements. Dimensional analysis of the more difficult problem of outdoor soundscapes has been attempted by a small number of research groups. Kang9 used eighteen semantic differential scales with 223 subjects in two urban squares. He extracted four principal factors. All the factors have significant relationships with many of the eighteen scales, so attempting to summarise the factors in one word leads to some generalisation. Nevertheless, Kang’s perceptual factors can be described as: relaxation, communication, spatiality and dynamics. Three other soundscape dimensional results exist in the literature, due to Axelsson et al.,10 Guillén and López Barrio,11 and Cain et al.12 These research groups found similar but not identical dimensions to Kang (their results are discussed in more detail later in this paper). This raises the question of how robust a dimensional model of soundscape perception is. Are the dimensions specific to a location, or a country, or do they depend on the scales used in the data collection? Does it matter if the soundscapes were experienced in situ (Kang) or if they were reproduced by an audio system in a laboratory (Cain et al.)?
This paper reports an experiment which directly addresses the two questions of whether a spatial audio system can correctly reproduce soundscape dimensions and how reproducible those dimensions are between locations, listeners and experimenters. We sought to reproduce Kang’s experiment in a different city, some years later, and to use loudspeakers rather than in-situ exposure.
2 METHOD
Recordings were made of the soundscape in four urban locations in Manchester city centre (in the UK). A soundfield microphone was used to make first-order ambisonic recordings. Two of the locations were at opposite ends of St Ann’s Square, a pedestrianised shopping area bounded on one side by a cobbled road. The first recording (A) was near the cobbled road, and the second (B) was near a busking musician. (St Ann’s Square was much studied by the Positive Soundscape Project.13) The third location was a pedestrianised underpass, and the fourth was on a busy road with a railway bridge going over it. Figure 1 shows snapshots of the four locations. The recordings were reproduced using an eight-loudspeaker ambisonic system in a semi-anechoic chamber at Salford University. Sound levels at the listener’s position were the same as at the point of recording (LAeq). One 30-second recording was used for each of the four locations.
Fifteen participants, all students or lecturers in acoustics, completed the experiment. The participants were allowed to replay each recording as many times as they wished. No visual stimulus was supplied.
3 RESULTS AND DISCUSSION
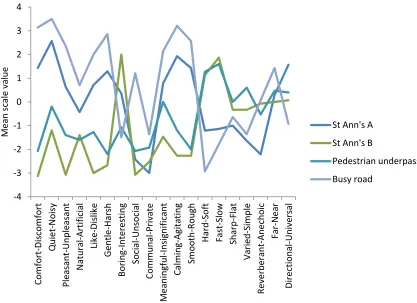
The completed experiment resulted in nineteen scale values for each of four soundscapes, for each of fifteen participants. Figure 2 shows scale values averaged across participant for each soundscape. As expected, the soundscapes produce different ratings on most scales. For example, it is not surprising to find that St Ann’s Square (B) is more comfortable than the busy road. More interestingly, there seem to be two pairs of soundscapes: The pedestrian underpass and St Ann’s Square (B) have similar values on several scales and are more liked than the busy road and St Ann’s Square (A). This may be explained by the presence of foreground traffic sounds in the latter two soundscapes.
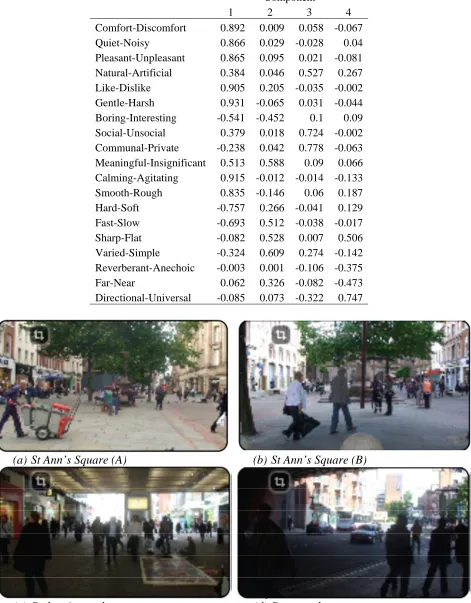
SPSS was used to conduct a principal component analysis (PCA) on this data. The analysis was first partitioned into the four soundscapes, and then combined for an overall view. For the partitioned PCA, similar results were found for each soundscape. For each location, four dimensions explain 71 to 74% of the variance in the scale values, and these dimensions load onto the eighteen scales in similar proportions. It thus seems reasonable to assume that these four soundscapes are being judged by the participants with the same perceptual framework. The whole set of data was therefore combined for one overall PCA across the four soundscapes. This resulted in four dimensions that explain 65% of the variance in the scale values. The dimensions load onto the scales with the factors shown in Table 2. Factor 1 is here named relaxation/calmness and explains 41% of the variance; factor 2, named dynamics/vibrancy (10%); factor 3, communication (7%) and factor 4, spatiality (7%). These loadings are not identical to those found by Kang,9 but they are strikingly similar. Kang’s names for the dimensions have therefore been used here. Kang found dimensions of relaxation (26%), communication (12%), spatiality (8%) and dynamics (7%). The main difference between our results and Kang’s is the increased variance explained by the first factor. The most likely explanation for this is that the controlled laboratory conditions, especially the exposure of participants to identical stimuli, have reduced the influence of extraneous factors. In our experiments, the four soundscapes produced similar but not identical dimensions when analysed individually. This effect is perhaps due to a different mix of sound sources in each soundscape and this will account for some of the small remaining differences between our results and Kang’s.
The dimensions found in three other studies in the literature are not much more different. In a large project, Axelsson et al. used 116 semantic scales to characterise the response of 100 listeners to fifty soundscapes.10 They produced a three-dimensional space with factors pleasantness (50%), eventfulness (18%) and familiarity (6%). Guillén and López Barrio11 reported three dimensions, named emotional evaluation and strength (42%), activity (14%), and clarity (10%). Finally, Cain et al. found two principal dimensions: calmness (60%) and vibrancy (20%); with visual stimulus having little effect on the dimensions in this binaural reproduction.12
The first dimension in all the studies seems to be very similar: calmness/pleasantness. All the studies except Kang’s have the same second dimension: activity/eventfulness. (Kang also has this dimension, but places ‘dynamics’ as dimension 4.) These two dimensions also seem similar to the two-dimensional affective space of valence (pleasure) and arousal found by Bradley and Lang14 for stimuli of single sounds or still pictures.
reproduction also seems to be faithful for the perceptual dimensions. One corollary of this result is to confirm the finding of Cain et al. that visual stimulus has little effect on the dimensions found. It is interesting to speculate why this might be the case. It has been previously reported that the attention mechanism has a significant role to play in soundscape perception.15 Top-down attention can be focused on different sensory attributes at a range of different scales: on the overall impression of a place (sights, sounds, smells), on the soundscape, or on a particular sound or sound source. If participants are asked to listen to the soundscape, then this is what they do. This then determines their attentional set and probably reduces the importance of other senses.
4 CONCLUSIONS
The attempt to replicate a soundscape dimensional experiment has been successful. Using similar semantic differential scales in different soundscape locations has resulted in similar psychological spaces. It is suggested that the weight of evidence in the literature is now sufficient for the first two dimensions of calmness/pleasantness and activity/eventfulness to be regarded as a ‘standard model’ for the perceptual dimensions of soundscapes.
The main effect of conducting a soundscape listening experiment with laboratory ambisonic reproduction seems to be to increase the variance explained (that is, to reduce the error). We therefore conclude that this form of reproduction is ecologically valid for dimensional as well as semantic aspects of the soundscape experience.
5 REFERENCES
1. S.R. Payne, W.J. Davies, and M.D. Adams Research into the Practical and Policy Applications of Soundscape Concepts and Techniques in Urban Areas. Department for Environment, Food and Rural Affairs: London, 2009
2. A.V. Maffiolo, M. Castellengo, and D. Dubois, "Qualitative judgements of urban soundscapes." Inter-Noise 99 (Fort Lauderdale, Florida, USA, 6–8 December 1999).
3. S. Kuwano, N. S., T. Kato, and J. Hellbrueck, "Memory of the loudness of sounds and its relation to overall impression." Forum Acusticum (Seville, Spain, 16–20 September 2002).
4. R. Cain, P. Jennings, M. Adams, N. Bruce, A. Carlyle, P. Cusack, W. Davies, K. Hume, and C. Plack, "SOUND-SCAPE: A framework for characterising positive urban soundscapes",
Acoustics 08 (Paris, 29 June – 4 July 2008).
5. B. Schulte-Fortkamp and A. Fiebig, "Soundscape analysis in a residential area: An evaluation of noise and people’s mind", Acta Acustica united with Acustica92, 875-880 (2006).
6. C. Guastavino, B.F.G. Katz, J.D. Polack, D.J. Levitin, and D. Dubois, "Ecological validity of soundscape reproduction", Acta Acustica United with Acustica91, 333-341 (2005). 7. N.S. Bruce, W. Davies, and M.D. Adams, "Expectation as a factor in the perception of
8. Y. Ando, "Calculation of subjective preference at each seat in a concert hall", J. Acoust. Soc. Am.74, 873-887 (1983).
9. J. Kang, Urban Sound Environment, Taylor and Francis, (2007).
10. O. Axelsson, M.E. Nilsson, and B. Berglund, "A principal components model of soundscape perception", Journal of the Acoustical Society of America128, 2836-2846 (2010).
11. J.D. Guillen and I. Lopez-Barrio, "The soundscape experience", 19th International Congress on Acoustics (Madrid, 2007).
12. R. Cain, P. Jennings, J. Poxon, and A. Scott, "Emotional dimensions of a soundscape",
Internoise 2009 (Ottawa, Canada, 23-26 August 2009).
13. W.J. Davies, M.D. Adams, N.S. Bruce, M. Marselle, R. Cain, P. Jennings, J. Poxon, A. Carlyle, P. Cusack, D.A. Hall, A. Irwin, K.I. Hume, and C.J. Plack, "The positive
soundscape project: A synthesis of results from many disciplines", Internoise 2009 (Ottawa, Canada, 23-26 August 2009).
14. M.M. Bradley and P.J. Lang, "Affective reactions to acoustic stimuli", Psychophysiology37, 204-215 (2000).
[image:6.612.142.465.438.734.2]15. D. Botteldooren and B. De Coensel, A model for long-term environmental sound detection, in 2008 Ieee International Joint Conference on Neural Networks, Vols 1-8. 2008, Ieee: New York. p. 2017-2023.
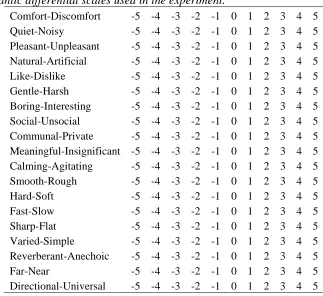
Table 1 – Semantic differential scales used in the experiment.
Comfort-Discomfort -5 -4 -3 -2 -1 0 1 2 3 4 5
Quiet-Noisy -5 -4 -3 -2 -1 0 1 2 3 4 5
Pleasant-Unpleasant -5 -4 -3 -2 -1 0 1 2 3 4 5
Natural-Artificial -5 -4 -3 -2 -1 0 1 2 3 4 5
Like-Dislike -5 -4 -3 -2 -1 0 1 2 3 4 5
Gentle-Harsh -5 -4 -3 -2 -1 0 1 2 3 4 5
Boring-Interesting -5 -4 -3 -2 -1 0 1 2 3 4 5
Social-Unsocial -5 -4 -3 -2 -1 0 1 2 3 4 5
Communal-Private -5 -4 -3 -2 -1 0 1 2 3 4 5
Meaningful-Insignificant -5 -4 -3 -2 -1 0 1 2 3 4 5
Calming-Agitating -5 -4 -3 -2 -1 0 1 2 3 4 5
Smooth-Rough -5 -4 -3 -2 -1 0 1 2 3 4 5
Hard-Soft -5 -4 -3 -2 -1 0 1 2 3 4 5
Fast-Slow -5 -4 -3 -2 -1 0 1 2 3 4 5
Sharp-Flat -5 -4 -3 -2 -1 0 1 2 3 4 5
Varied-Simple -5 -4 -3 -2 -1 0 1 2 3 4 5
Reverberant-Anechoic -5 -4 -3 -2 -1 0 1 2 3 4 5
Far-Near -5 -4 -3 -2 -1 0 1 2 3 4 5
Table 2 – Pattern matrix (Rotation Method Oblimin with Kaiser Normalization).
Component
1 2 3 4
Comfort-D scomfo i rt 0.892 0.009 0.058 -0.067
Quiet-Noisy 0.866 0.029 -0.028 0.04
Ple nt 0.865 0.095 0.021 -0.081
Nat t 0.384 0.046 0.527 0.267
Like-Dislike 0.905 0.205 -0.035 -0.002
Gen rs 0.931 -0.065 0.031 -0.044
Boring-Interesting -0.541 -0.452 0.1 0.09
Social-Unsocial 0.379 0.018 0.724 -0.002
Communal-Private -0.238 0.042 0.778 -0.063
Me l ifica 0.513 0.588 0.09 0.066
Cal g 0.915 -0.012 -0.014 -0.133
Sm u 0.835 -0.146 0.06 0.187
Hard-Soft -0.757 0.266 -0.041 0.129
Fast-Slow -0.693 0.512 -0.038 -0.017
Sharp-Flat -0.082 0.528 0.007 0.506
Varied-Sim 0.609 0.274 -0.142
Reverberant-Anechoic -0.003 0.001 -0.106 -0.375
Far-Near 0.062 0.326 -0.082 -0.473
Directional-Universal -0.085 0.073 -0.322 0.747
asant-Unpleasa ural-Ar ificial
tle-Ha h
aningfu -Insign nt
ming-A itating
ooth-Ro gh
ple -0.324
(a) St Ann’s Square
Fig. 1 – Snapshots of the four soundscape locations.
(A) (b) St Ann’s Square (B)
[image:7.612.77.548.104.707.2]Fig. 2 – Mean scale values for the four soundscapes. ‐4 ‐3 ‐2 ‐1 0 1 2 3 4 Comfort ‐ Discomfort Quiet ‐ Noisy Pleasant ‐ Unpleasant Natural ‐ Artificial Like ‐ Dislike Gentle ‐ Harsh Boring ‐ Interesting Social ‐ Unsocial Communal ‐ Private Meaningful ‐ Insignifica nt Calming ‐ Agitating Smooth ‐ Rough Hard ‐ Soft Fast ‐ Slow Sharp ‐ Flat Varied ‐ Simple Reverberant ‐ Anecho ic Far ‐ Near Directional ‐ Universal Mean scale value
St Ann's A
St Ann's B
Pedestrian underpass