International Journal of Emerging Technology and Advanced Engineering
Website: www.ijetae.com (ISSN 2250-2459, ISO 9001:2008 Certified Journal, Volume 4, Issue 11, November 2014)
502
Design and Implementation of Multichannel Data Acquisition
and Controlling System Using LabVIEW
Gundu Srinath
1, Dhruva R Rinku
2 1Research Scholar, Embedded Systems, CVR college of Engg, TG, India
2Assoc. Professor, Dept. of ECE, CVR College of Engg, TG, India Abstract— The data acquisition and processing
architecture covers the most demanding applications of continuous monitoring in industrial field. The Multichannel data acquisition is essential for acquiring and monitoring the various signals from industrial sensors. The data obtained in real-time is processed at runtime and stored in an external storage for future reference. The method of implementing the proposed design is by combined using of LabVIEW and ARM Cortex M-3 Processor. This processor attains high resolution and real-time processing of data acquisition and signal processing. In this project an eight channel data acquisition processing (DAQP) and Controlling was designed, developed using the LabVIEW graphical programming. The module was designed in order to provide high accuracy, storage, portability and to reduce the hardware size and cost. The system designed is not specific for any sensor acquisition, so any sensor having signal-conditioning circuit built can be connected to the DAQ (Data Acquisition System). ARM controller is used as heart of the DAQ.
Keywords-- Cortex M-3, DAQP, data storage, LabVIEW, Real- time, Multichannel, Data storage.
I. INTRODUCTION
The purpose of a Data Acquisition System (DAQ) system is to measure a physical phenomenon such as light, temperature, pressure, sound etc. A DAQ system includes the transducer, signal conditioning, DAQ device, driver level and application level software’s. With these building blocks we can bring the physical phenomenon measurement into the computer for analysis and presentation.
Data acquisition systems (DAQ) are devices and software components used to collect information in order to monitoring and analyzing phenomenon. As electronic technology advances, the data acquisition process has become accurate, versatile and reliable. Typically, data acquisition devices interface to various sensors that specify the phenomenon under consideration. Most data acquisition systems obtain data from different kinds of transducers that produce analog signals. Many applications require digital signal processing. Therefore, analog signals are converted to a digital form via an analog to digital converter (ADC). Simultaneous multi-channel DAQs are employed in numerous applications such as environmental measurements and medical diagnosis.
Multi-channel data acquisition (DAQ) is a crucial component in digital instrumentation and control. It typically involves the sampling of multiple analog signals and converting them into digital formats so that they can be processed either on-board or externally. In either case, DAQ systems also involve microprocessors, microcontrollers, digital signal processing, and storage devices. Multi-channel DAQs which utilize some sort of processing for simultaneous input channels. So this system is designed using real time operating system for provision of simultaneous signals occurrence on real time basis.
The multi-channel analog signal acquisition and processing (ASAP) system is used to acquire multi-channel analog signals and then processed and controlled by the microcontroller. In industrial data acquisition storage is limited and power consumption need to be minimum. Therefore, fixed sampling rate is not the optimal solution for multi-channel data acquisition. Hence, heterogeneous sampling rates are identified for each channel, and optimized for best data quality with minimal storage requirement and power consumption.
Using reconfigurable chip technology, where flexibility, concurrency and reconfiguration can be achieved in hardware, which increases the fidelity of the ASAP system. This in turn decreases the size, the power consumption and the cost of the system. Implementation of the design in Cortex M-3 brings the system energy efficient, reduction of size and low cost.
II. LITERATURE SURVEY
The ARM Cortex M-3 attains a high resolution allowing the integration of multiple components on a single chip. In addition, it can have all the acquiring, processing, controlling, input–output capabilities that are needed by a DAQ system.
International Journal of Emerging Technology and Advanced Engineering
Website: www.ijetae.com (ISSN 2250-2459, ISO 9001:2008 Certified Journal, Volume 4, Issue 11, November 2014)
503
Low power consumption and high reliability are among the main criteria that must be given priority when designing such wirelessly powered Microsystems. Even though this system is highly wireless based it is an advanced application in industrial and biomedical field. The system is designed in a modular manner. Each hardware module can operate as an independent gain programmable, level shift adjustable channel data acquisition system specific to a sensor type. Up to eight such data acquisition modules are connected to the host PC to realize the whole system hardware. The control of data acquisition and the subsequent management of data are performed by the system’s software which is coded in LabVIEW. In the case of input signals with different bandwidths, the hardware real-time adaptive sampling is the best way to optimize the ADC sampling rate. Meanwhile, it also reduces the overall sampling rate that is required, which leads to the reduction of the cost of the required ADC with a large number of channels, particularly in high-frequency inputs.
III. DATA ACQUISITION &PROCESSING (DAQP) MODULE
A. Multichannel inputs
The sensors or transducers used to measure the non-electrical signals as non-electrical signals. Generally in industrial applications the sensors are used in various types to measure heterogeneous parameters such as pressure, temperature, humidity, gas, velocity, viscosity, friction and vibrations etc., In medical applications by measuring the electrical signals produced by the human body such as ECG, EEG, EMG and etc., since they are the signals which are in analog they should be converted into digital.
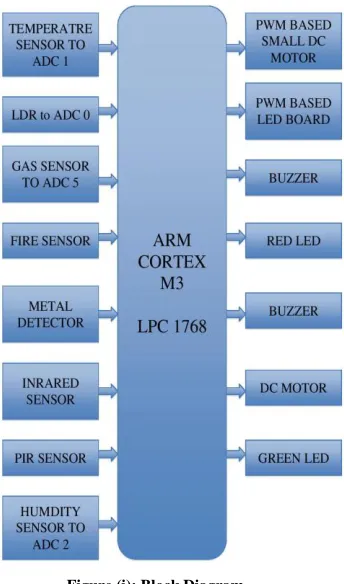
Figure (i): Block Diagram
These signals are typically waveforms as sine wave or saw tooth wave or cosine wave. Wireless data acquisition system consists of two parts, the part of the data acquisition and the part of the data processing in the host computer. The data acquisition part of the sensor circuit is responsible for receiving the external multi channel signals. The block diagram of it is shown in figure (i).
[image:2.595.354.526.143.435.2]International Journal of Emerging Technology and Advanced Engineering
Website: www.ijetae.com (ISSN 2250-2459, ISO 9001:2008 Certified Journal, Volume 4, Issue 11, November 2014)
504
B. Host Interface Module
Generally DAQ Function is to acquire the data and convert it to the usable format and this uses ARM Cortex series processor for the acquisition and conversion tasks. The signal will undergo a process of AD conversion through the peripherals of the microprocessor LPC1768, which have a 12-bit high-resolution ADC.
Signal conditioning of the sensor signals are to be carried out before it could be connected to the system. Computer manipulates the data as well as stores values in a Microsoft Excel file, thus it also does function of data logging.
C. ARM Cortex M-3
Cortex M-3 processor is a low-power processor that features low gate count, low interrupt latency, and low-cost debug. It is useful for deeply embedded applications that require fast interrupt response, including microcontrollers and automotive and industrial control systems. In the industrial field, the user requires a faster speed interrupt, so Cortex-M3 is best suited.
Embedded control forms a large part of the market for microprocessors. The embedded controller market has traditionally focused on 8-bit microprocessors, but the growing complexity of many control requirements in sophisticated products indicates a need to move to more powerful processors. The ARM offers the opportunity to move directly to 32-bit controllers at low cost and with a great deal of flexibility for designing custom controllers.
The ARM processor is always differed from other commercially available RISC processors in that it is intended to meet a price/performance ratio rather than to be the most powerful processor available. ARM processors offer an extremely good price/performance ratio compared to other processors.
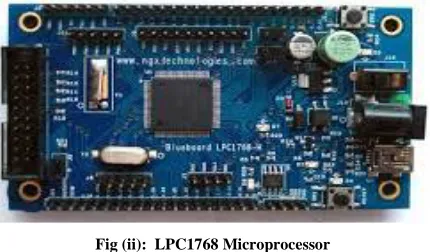
Fig (ii): LPC1768 Microprocessor
The Cortex-M3 processor design has some innovative and much improved features and capabilities as compared to the ARM7TDMI processor.
Since the Cortex-M3 processor can finish a task quicker, the architecture uses a Thumb-2 technology, which uses 31% less memory, which reduces system overhead in comparison with the pure 32-bit code. At the same time it provides 38% higher performance than the existing technology solutions based on Thumb.
The ADC collects sample data by using a programmable sequence-based approach. ADC acquisition supports single-ended and differential-input configurations.
The start of the conversion can be controlled by various triggering’s such as Controller (software), Timers, Analog Comparators, PWM and GPIO. The GPIO module supports 5-42 programmable input/output pins.
D. Data Storage and Processing Unit
In the data storage and processing unit the digital data that obtained from ADC through the multichannel input signals are stored in a data storage unit that is in flash memory. Data storage plays an increasingly essential role in data monitoring, control, and safety protection. Analog data storage is subject to deformation with time and poor privacy protection. On the other hand, digital instrumentation technologies are known for high processing capabilities, which allow them to perform intelligent onboard computing that supports functionality such as universal data storage. In addition, they also provide improved accuracy, flexibility, and easier data protection. This is because the conversion from various analog signal types to a digital format simplifies universal data archiving and unifies data protection and communication schemes.
Main purpose of designing the data storage block is to provide continuous data acquisition capability along with random access to selected blocks of acquired data. The solution chosen consists of building a large block of memory, addressed circularly, where acquired data are directly saved under the responsibility of control logic contained in the data storage block. This control logic also answers the host requests by fetching the required blocks of data. The only other intervention of the host processor in the process is the initial programming of the desired mode of operation of the data storage block.
E. User interface module (Display unit)
[image:3.595.58.273.545.671.2]International Journal of Emerging Technology and Advanced Engineering
Website: www.ijetae.com (ISSN 2250-2459, ISO 9001:2008 Certified Journal, Volume 4, Issue 11, November 2014)
505
This module has controls and indicators for controlling and monitoring, which is developed using LabVIEW platform. The data log module is designed to record measured data into data files for further use.
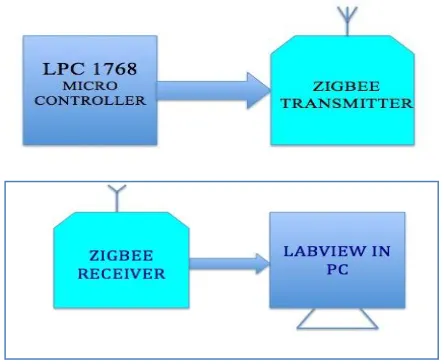
Figure (iii): Zigbee Transmitter and Receiver
IV. DESIGN IMPLEMENTATION
The experimental setup of this system was designed under LabVIEW National instruments (NI) and DAQ board as shown in figures (iv). The design consists of Cortex M-3 board, which acts as the DAQ card for interfacing the sensors for acquiring the signals and NI SD memory storage module used for storing the acquired signal values.
The NI Educational Laboratory Virtual Instrumentation Suite (NI ELVIS) is a hands-on design and prototyping platform that integrates eight industrial sensors in this project. Based on NI graphical system design software, NI ELVIS, with USB plug-and-play capabilities, offers the flexibility of virtual instrumentation and allows for quick and easy measurement acquisition and display. This NI ELVIS II has analog input channels of 8 differential or 16 single ended, ADC of 16-bit resolution and input frequency up to 50 to 60 Hz.
In this work. We used the LPC1768 Microprocessor as the host controller, which has 144 pins. The processor has a FSMC (Flexible Static Memory Controller), whose data and address lines are separated. The FSMC controller can easily read and write the NAND FLASH.
Figure (iv): Data Acquisition System
Designed DAQ consists of total eight sensors as shown in the block diagram. Whenever there is a limit crosses in particular predetermined sensor values then they will be controlled automatically.
MicroVision, the popular IDE from Keil Software, combines Project Management, SourceCode Editing, Program Debugging, and Flash Programming in a single, powerful environment.
V. EXPERIMENTAL RESULTS
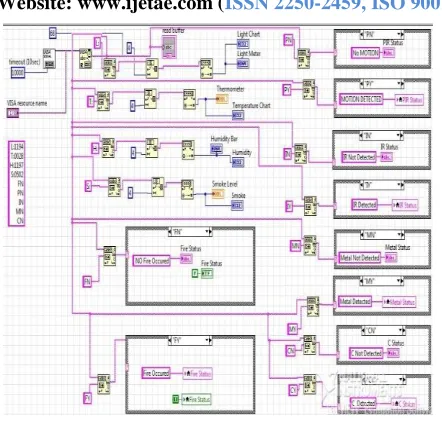
This section explains the out end results of the multichannel data from industrial sensors. The code design for the Monitoring section is developed using LabVIEW block diagram panel window and the results are monitored in LabVIEW front panel window. The figure (v) shows the LabVIEW program code screenshot in the block panel design of LabVIEW for multichannel data acquisition, processing and retrieval. First the signals are acquired from sensors using DAQ with necessary time limits and clock frequency and the task was created for continuous data acquisition. After the end of this task the data is stored and retrieved using TDMS file viewer where this function will store the individual signal performance values with respect to time and they are stored in an excel sheet. Then the data can be stored in a removable SD memory module. The system will run continuously until the user stops the process.
[image:4.595.327.539.113.279.2] [image:4.595.57.279.187.369.2]International Journal of Emerging Technology and Advanced Engineering
Website: www.ijetae.com (ISSN 2250-2459, ISO 9001:2008 Certified Journal, Volume 4, Issue 11, November 2014)
506
Figure (v): LabVIEW Design for Multichannel DAQ
The Acquired data is represented instantaneously as graphical representation in LabVIEW software on computer. The below Figure vi (a) shows the result of temperature graph using LM35 sensor. The change of temperature values is monitored in a front panel window of Lab VIEW.
Figure vi (a): Output Waveform of Temperature Sensor
The Second signal obtained is gas or smoke level obtained by using the MQ-6 Gas senor which provides the indication level with respect to time as shown in the Figure vi (b).
Figure vi (b): Output Waveform of Smoke sensor
The third signal is the Humidity rate measurement shown in figure vi(c), obtained by using the humidity sensor which provides the information about the percentage relative humidity present in the environment.
Figure vi (c): Output Waveform of Humidity Sensor
The Fourth signal is the light intensity measurement shown in figure vi(d) obtained by using photoconductor or photocell which is a variable resistor whose value decreases with increasing incident light intensity. This can be used as a application of street lighting.
[image:5.595.56.277.124.338.2] [image:5.595.327.537.138.269.2] [image:5.595.323.537.339.446.2] [image:5.595.57.270.428.556.2]International Journal of Emerging Technology and Advanced Engineering
Website: www.ijetae.com (ISSN 2250-2459, ISO 9001:2008 Certified Journal, Volume 4, Issue 11, November 2014)
507
The fifth signal is the status of detection of the motion using PIR sensor used to detect whether a human has moved in or out of the sensors range shown in fig vi (e).
Figure vi (e): PIR Status
The sixth signal is Fire status indicator as shown in figure vi (f).
Figure vi (f): Fire Status
The next signals obtained are the Metal detection and Infrared (IR) status as shown in below figures vi (g) and figure vi (h). Metal detectors are used as protection equipment.
Figure vi (g): Metal Status
Figure vi (h): Infrared Status
VI. CONCLUSION
In this work, we have developed a technique of multichannel DAQP system to monitor and control industrial parameters such as Gas, temperature, Fire, light, motion, Humidity and metal detection etc,. The novel aspect of the design is to bring the system into small size, reduced cost, low power consumption, portability, and data storage. This entire system was designed and tested successfully using the LabVIEW tool and Cortex M-3 processor.
The combination of these two proves very beneficial in solutions related to the automation, acquisition and networking fields. Each of the above has unique peculiarities, which is utilized together to give best performance required.
The low cost MCU based design makes system affordable to the industries. The networking capability enables highly efficient data analysis process and for future references, sensor values are saved in an Excel File as database.
VII. FUTURE WORK
The design of network control module for transmitting and monitoring the real time data acquired from the DAQP device through Internet is the future work to be progressed
Acknowledgement
I would like to express my sincere gratitude to Professor C.Venkat Rao sir and co-coordinator Mrs. Sailaja madam of CVR College of Engineering for their continuous support, encouragement and guidance in implementation and publishing of this project work.
REFERENCES
[1] http://www.ni.com National instruments. [2] http://www.lava.com Lab VIEW development.
[3] Book “Lab VIEW for everyone” written by Jeffrey Travis and Jim Mohammed Abdallah, Member, Omar Elkeelany, and Ali T. Alouani, “A Low-Cost Stand-Alone Multichannel Data Acquisition, Monitoring, and Archival System With On-Chip Signal Preprocessing” IEEE transactions on instrumentation and measurement, vol. 60, no. 8, august 2011 2813.
[4] LPC1768 Microcontroller datasheet http://www.ti.com/
BIOGRAPHIES
Mrs. Dhruva R.Rinku working as Associate Professor in Department of ECE of CVR college of Engineering.
[image:6.595.114.217.177.248.2] [image:6.595.57.272.283.392.2] [image:6.595.83.247.457.587.2]