simulator to determine the relationship
between sound objects and soundscape
Sudarsono, AS, Lam, YW and Davies, WJ
http://dx.doi.org/10.3813/AAA.919094
Title The validation of acoustic environment simulator to determine the relationship between sound objects and soundscape
Authors Sudarsono, AS, Lam, YW and Davies, WJ
Type Article
URL This version is available at: http://usir.salford.ac.uk/42428/
Published Date 2017
USIR is a digital collection of the research output of the University of Salford. Where copyright permits, full text material held in the repository is made freely available online and can be read, downloaded and copied for noncommercial private study or research purposes. Please check the manuscript for any further copyright restrictions.
Soundscape
Anugrah S Sudarsono1,2, Yiu W Lam1, William J Davies1
1: Acoustics Research Centre, University of Salford, Salford M5 4WT, United Kingdom.
2: Engineering Physics Department, Institut Teknologi Bandung, JL. Ganesha 10, Bandung
40132, Indonesia. [email protected]
Summary
An acoustic environment simulator is a system that facilitates acoustic environment composition by controlling the parameters of sound objects (both background and sound events), allowing the user to compose and compare soundscapes against their expectations. By using the acoustic environment simulator, data regarding parameters of sound objects, such as their sound level and selection, can be obtained. Furthermore, these data can be used to understand the relationship between the sound objects and the soundscapes.
This paper describes the development and validation of an acoustic environment simulator, which can be used to design a complex acoustic environment in the laboratory according to the expectations of the user. Validation of the simulated soundscape, whether the composed acoustic environment has the same soundscape dimension characteristics as previous in-situ and other laboratory experiments, was conducted by reproducing acoustic environment compositions using a two-dimensional ambisonic system in the laboratory. Listener responses on semantic differential scales were reduced to three reliable soundscape dimensions by principal component analysis: Calmness/Relaxation (40%), Dynamics/Vibrancy (12%), and Communication (11%). These three soundscape dimensions are consistent with a previous study conducted in situ. The results reported here indicate that acoustic environment composition can successfully imitate the soundscape dimensions of an actual acoustic environment.
PACS no. 43.38.Md, 43.66.Lj, 43.50.Rq
1
Introduction
Several studies have been conducted in an effort to understand soundscapes based on in-situ experiments [1–6] and laboratory experiments using acoustic environment recordings [7–10]. Although in-situ and laboratory experiments have been widely used, they do not generally provide an opportunity to measure the parameters of each sound object, nor to control the sound objects that occur in the acoustic environment. A sound object is taken as a sound source in the acoustic environment, including its spatial properties (movement
and position in space), temporal properties (sound events or background sound), sound level, and interactions with the environment.
was developed to imitate the sounds of road and railway traffic [11] and was able to imitate the sounds of moving vehicles and trains in the laboratory. Despite these early attempts, these simulators have not been reported to design or compose a complex acoustic environment. In the present study, an acoustic environment simulator for composing complex acoustic environments was developed.
Aletta et al. state that soundscape study can be done using three methods: in-situ experiments, laboratory experiments, and interviews [12]. Laboratory experiments can be carried out with acoustic environment recordings or a simulated acoustic environment. Experiments using acoustic environment reproduction have been validated [8] [13], but not the simulated acoustic environment.
A method to validate an acoustic environment has been developed using semantic scales, which has been implemented for experiments in different conditions: in situ [13,14], in the laboratory using binaural reproduction [7,9], in the laboratory with a three-dimensional ambisonic system [8,15], and in the laboratory with a two-dimensional ambisonic system [13].
In the in-situ experiment using semantic scales, four soundscape dimensions (Relaxation, Communication, Spatiality, and Dynamics) were distinguished [14]. Later, our previous study has shown that the dimension of Spatiality is not reliable[13]. The laboratory experiments were conducted using different reproduction systems. In the experiment using a binaural system two soundscape dimensions were distinguished (Calmness and Vibrancy) [9]. In the reproduction using a three-dimensional ambisonic system four soundscape dimensions were classified (Relaxation/Calmness, Dynamics/ Vibrancy, Communication, and Spatiality) [8] and in the experiment using a two-dimensional ambisonic system three soundscape dimensions were established (Relaxation/Calmness,
Dynamics/Vibrancy, and Communication) [13].
In this study, an acoustic environment simulator was designed to simulates complex acoustic environments. The validity of the simulated acoustic environments (whether the composed acoustic environments have the same soundscape dimensions as previous in-situ and laboratory experiments). The preliminary results were presented at INTERNOISE 2016 [16].
2
Development of the Acoustic
Environment Simulator
An acoustic environment simulator was developed in this study for the purpose of
composing complex acoustic
environments. A complex acoustic environment is an acoustic environment that consists of both background sound objects and event sound objects, and that can stand in for an actual acoustic environment. Furthermore, the temporal and spatial properties of each of the sound objects should be imitated in the simulator. The simulator was developed using three concepts: (i) the structured perspective in acoustic environment composition, (ii) sound objects, and (iii) separation of background sounds and event sounds.
sound object that represents an event sequence.
In this study, the background sound object is defined as a general sound object, which occurs throughout the acoustic environment, for example, the sound of traffic noise, construction noise and hubbub. Also, the event sound object is defined as a specific sound event that may occur once in the acoustic environment, for example, the sound of a passing tram, a trolley bag being pulled, or footsteps.
The structured perspective in acoustic environment composition was introduced by Truax [20]. It includes three perspectives that should be implemented in order to compose an acoustic environment: the fixed spatial perspective, the moving spatial perspective, and the variable spatial perspective. The fixed spatial perspective implies that an acoustic environment is formed by sound objects in time; the moving spatial perspective relates to the imitation of moving sound objects in the composition; and the variable spatial perspective relates to the simultaneous presence of several sound objects. The fixed spatial perspective was implemented in the present acoustic environment simulator by using a long recording of background sound (not a short repeated sample) because listeners need to perceive the flow of the sound objects in time. The spatial movement of the sound objects was imitated using an automated ambisonic panner. The presence of simultaneous sound objects was implemented using multi-track playback in the simulator.
The object-oriented concept was implemented in this simulator by considering three parameters: the position of a sound object (for static sound objects), the sound level of a sound object, and the movement of a sound object. The position of the sound object was imitated using an ambisonic panner by controlling the azimuth parameter; the sound level of the sound object was controlled by adjusting the sound level parameter; and its movement was imitated by automating the
azimuth parameter in the ambisonic panner.
The acoustic environment simulator was designed using Digital Audio Workstation (DAW) software because DAW software has suitable functionality for the task of building such a simulator: a multi-track system, implementation of the Virtual Studio Technology (VST) plugins on every track, implementation of multi-channel output, parameter automation, multi-channel routing on every track, real-time signal processing, and MIDI controller input.
The multi-track system allows several sound objects to be played at the same time and can be used to expand the system to include more sound objects. The implementation of the VST plugins on every track allows different effects to be implemented on each sound object. The implementation of multi-channel output offers flexibility in reproducing the output, permitting the use not only of stereo systems but also of multi-channel ambisonic or surround systems. Parameter automation is used to imitate the movement of sound objects. The multi-channel routing is very useful, since we apply B-format signals (four channels) in the simulator. Real-time signal processing allows the user to compose and listen to the acoustic environment composition in real time. The MIDI controller input allows the DAW software to be controlled by a MIDI controller or a custom interface.
decoded into systems as varied as stereo, two-dimensional ambisonic, three-dimensional ambisonic or surround systems. Fourth, it reproduces in real time, so the user can listen to their acoustic environment composition while manipulating its constituent sound object parameters. Fifth, it enables the result of the composition to be recorded for later reproduction.
The context in a soundscape indicates the interaction in space and time between individuals, their activities, and the location [22]. The context affects the soundscape via the following factors: auditory sensation, the interpretation of the auditory sensation, and the response of the soundscape. The auditory sensation represents the hearing process that starts with the sound coming through the ear, leading to the neurological response. The interpretation of the auditory sensation represents the process of interpreting the audio signal, which creates the understanding of the soundscape. The response of the soundscape represents the effect of the soundscape and the feeling that arises from the acoustic environment. The proposed simulator was designed by considering factors that are related to the soundscape context. The ambisonic reproduction system (to reproduce movement and positioning of sound objects) is implemented to imitate the auditory sensation from an actual sound environment. In addition, the sound objects are recorded in outdoor space, which includes the reflection of sounds, so auralization is not needed.
The interpretation of auditory sensations is considered by including sound object recordings that are isolated from other sounds and by allowing the user to adjust the level of the sound objects.
Although in the development of the acoustic environment simulator, the context of the soundscape was emphasized, the simulator still has some limitations.The simulator can only be used to compose one minute of an acoustic
environment, after which the composition is looped. The system can only be used to understand general perceptions but not specific perceptions, such as the recognition of a certain space. The recording of sound objects in the simulator includes reverberation since all recordings are made outdoors or in a normal room. Although the recordings may be suitable to represent sound objects in an open area, they cannot represent sound objects in semi-open spaces or closed spaces. In these cases, the simulator fails to simulate the interaction between the sound objects and the environment correctly.
2.1 System Setup
5
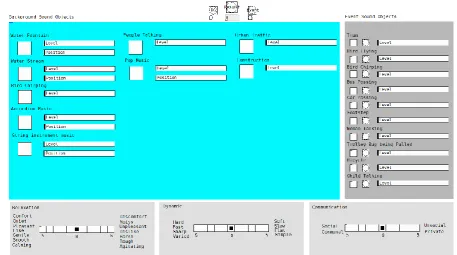
Figure 1 Acoustic environment simulator interface.
Figure 2 Signal processing of sound objects in acoustic environment simulator.
The interface for the acoustic environment simulator was developed using PureData. This is basically a custom Digital Audio Workstation (DAW) controller that controls selected parameters in the DAW software. There are three areas in the simulator, as shown in Figure1: the rating area (light grey background), the background sound objects (blue
background), and the event sound objects (dark grey background).
2.1.1 Implementation of Digital Audio Workstation Software to Imitate Spatial and Temporal Properties of Sound Objects
[image:6.595.129.462.365.584.2]6
using the WigWare VST plugin developed by Bruce Wiggins [23]. Two WigWare VST plugins are implemented in the simulator: firstly, WigWare AmbiPan three-dimensional ambisonic panner, and secondly, WigWare Regular Shape 1st order ambisonic decoder. The signal processing of the sound objects is shown in Figure 2.
All recordings used in the simulator were recorded in mono. Positioning and movement of the sound objects were performed using the ambisonic panner VST plugin. The output of the plugin is a four-channel B-format output.
The ambisonic panner is able to manipulate several parameters, such as azimuth, elevation, X, Y, Z, distance, and compensation distance. The position of the sound objects is controlled by changing the azimuth parameter while keeping the other parameters constant.
The movement of sound objects is also replicated in the proposed simulator. There are two kinds of movement in the results reported here: the movement of people talking in the background, and the movement of sound objects in one direction (left to right, right to left, front to back, or back to front).
The implementation of the ambisonic panner enables the output of each sound object into a B-format output. The outputs of all the sound objects are mixed together and sent to the ambisonic decoder. Using the Regular Shape 1st order decoder from WigWare, the B-format signals are decoded into an eight-channel signal, which is sent to the audio interface and speakers. The acoustic environment simulator was designed using a two-dimensional ambisonic system with eight speakers. The same decoder was used to reproduce acoustic environments in the
previous experiment examining acoustic environment reproduction [13].
All of the sound objects in the simulator are encoded as a B-format recording consisting of four channels (W, X, Y, and Z). Next, the B-format signals are decoded, using the Regular Shape 1st order decoder,
into an eight-channel signal that is sent to the audio interface and speakers, set up as shown in Figure 2.
2.1.2 Recording Sound Objects and Calibration of the Acoustic Environment Simulator
The sound components were mono recorded using an Audio-Technica AT-815A unidirectional microphone and a Zoom H6 sound recorder. The unidirectional microphone was selected to reduce surrounding noise.
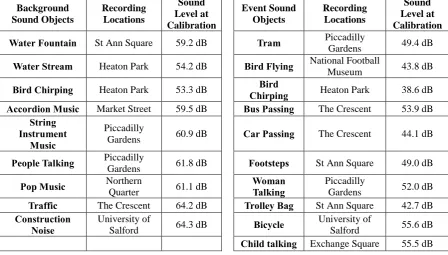
Nineteen sound objects were recorded at several different locations, as shown in Table 1. The acoustic environment simulator was developed using nine background sound objects and ten event sound objects.
Two types of calibration were applied in the acoustic environment simulator: first, calibration of the output of each speaker, and second, calibration of the overall sound level. The calibration of the speaker output was done by reproducing omnidirectional white noise. This signal was sent to each of the speakers and each of the speakers was set to have the same output.
The overall sound level was calibrated by measuring the sound level of each sound object as reproduced by the speaker system using a measurement microphone. The relative sound level of each sound object was set to 0 dB and each was played and measured individually by a measurement
microphone. The sound level
7
Table I Sound objects used in the acoustic environment simulator, their recording locations around Manchester (UK), and the sound level (LAeq in dB) of sound objects during calibration
Background Sound Objects
Recording Locations
Sound Level at Calibration
Event Sound Objects
Recording Locations
Sound Level at Calibration
Water Fountain St Ann Square 59.2 dB Tram Piccadilly
Gardens 49.4 dB
Water Stream Heaton Park 54.2 dB Bird Flying National Football
Museum 43.8 dB
Bird Chirping Heaton Park 53.3 dB Bird
Chirping Heaton Park 38.6 dB
Accordion Music Market Street 59.5 dB Bus Passing The Crescent 53.9 dB
String Instrument
Music
Piccadilly
Gardens 60.9 dB Car Passing The Crescent 44.1 dB
People Talking Piccadilly
Gardens 61.8 dB Footsteps St Ann Square 49.0 dB
Pop Music Northern Quarter 61.1 dB Woman
Talking
Piccadilly
Gardens 52.0 dB
Traffic The Crescent 64.2 dB Trolley Bag St Ann Square 42.7 dB
Construction Noise
University of
Salford 64.3 dB Bicycle
University of
Salford 55.6 dB Child talking Exchange Square 55.5 dB
3
Validity of the Acoustic
Environment Simulator
The validity of the acoustic environment simulator was tested by reproducing the urban acoustic environment compositions (composed using the acoustic environment simulator) for participants and asking them to rate the acoustic environment using the same semantic scales used in the in-situ soundwalk and in the laboratory experiment with acoustic environment recording in [13]. Principal component analysis (PCA) was applied to the data, after which the components from the PCA were compared with the in-situ experiment.
3.1 Method
Two experiments were conducted to validate the acoustic environment simulator: first, an acoustic environment composition experiment, and second, rating of the acoustic environments created in the composition experiment. In the acoustic environment composition experiment, the participants were asked to create four compositions that represented the dimensions of Relaxation and
Dynamics in an urban area:
comfortable-simple, comfortable-varied,
uncomfortable-simple, and
uncomfortable-varied.
The second experiment was conducted to analyse the validity of the acoustic environments composed in the acoustic environment simulator using semantic differential analysis. In this experiment, the signals of the composed acoustic environments were reproduced using a two-dimensional ambisonic system and the participants were requested to rate the acoustic environment according to the nineteen semantic scales used in the Davies study [8], which are based on those of Kang [14].
3.2 Experiments
[image:8.595.73.522.104.359.2]8
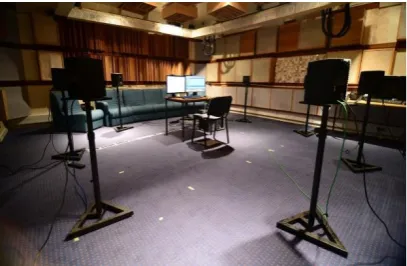
Figure 3 Acoustic environment simulator setup
Twenty-five volunteers (17 males and 8 females) participated in the experiment. Most of the participants were students (22-48 years old, M = 31.6, SD = 7.(22-48) from various academic backgrounds (acoustics, engineering, and social sciences) and ethnicities (Indonesian, Chinese, Italian, British, Iraqi, Indian, Pakistani, and French). The experiment was conducted with each participant individually.
There were two sessions in this experiment. In the first, the acoustic environment simulator was explained to the participants and they were asked to try it out. After they had become familiar with the controls, they were asked to compose four acoustic environments. As they finished each composition, the data were saved, after which they went on to compose the next acoustic environment, and so on.
The entire compositions were recorded in B-format signals, resulting in 100 acoustic environment composition samples.
The second experiment was conducted using the recorded acoustic environment composition samples. Twenty-five different volunteers (25-42 years old, M = 32.1, SD = 8.32) from the first experiment were asked to listen to and evaluate the compositions from the first experiment. The volunteers (19 males and 6 females) in the second experiment were from various backgrounds (acoustics, engineering, and social sciences) and ethnicities (Indonesian, Chinese, Italian, British, Iraqi, Indian, Pakistani, Germany, and
French) and participated in the experiment individually.
The second experiment was also conducted using B-format recording samples from the acoustic environment composition experiment. The recordings were reproduced using a two-dimensional ambisonic reproduction system with eight speakers.
The experiment used an interface developed using PureData to play the audio samples, as shown in Figure 4. The participants could select an acoustic environment sample by clicking the number button. The time was indicated in the simulator to show the length of the sample, because the participants were directed to listen to each acoustic environment composition sample in its entirety. Two acoustic environment composition samples from each of the four perception categories
(comfortable-simple, comfortable-varied,
uncomfortable-simple, and
uncomfortable-varied) were selected randomly from the acoustic environment composition database and presented in a random order in the simulator. Eight acoustic environment composition samples were reproduced for each participant – meaning that each of the acoustic environment composition samples was rated by two different participants – resulting in 200 responses to be analysed.
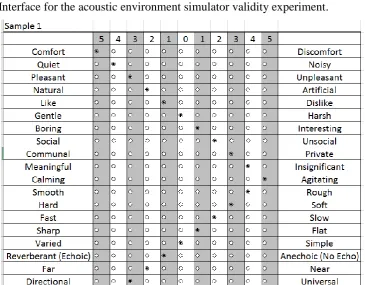
As the participants listened to each sample in the interface, they filled in a questionnaire made in Microsoft Excel, as shown in Figure 5. In addition, Davies’s scales were also implemented to compare the perception of an acoustic environment reproduced in a laboratory with an in-situ acoustic environment [13].
[image:9.595.73.277.71.204.2]9
[image:10.595.188.408.111.216.2]the experiment if they did not feel comfortable with the experiment.
Figure 4 Interface for the acoustic environment simulator validity experiment.
Figure 5 Questionnaire for the acoustic environment simulator validity experiment.
3.3 Results and Discussion
The data from the experiment were analysed in two ways: using the sound levels of the acoustic environment compositions (Experiment I) and using principal component analysis (Experiment II).
The sound levels of the acoustic environment compositions were compared with respect to the soundscape dimensions of Relaxation and Dynamics. A test of normality, using the Kolmogorov-Smirnov test, was conducted to assess the normality of the data. The test of normality showed that both the Relaxation and Dynamic
datasets were normally distributed (p = 0.200 for the Relaxation dataset and p = 0.201 for the Dynamic dataset). Since the data were normally distributed, two-way analysis of variance (ANOVA) with interaction was selected for the next analysis. The result is shown in Table II. The main effect of sound level on Relaxation (p = 0.000 and F = 170.832), and a tendency for Dynamic (p = 0.051 and F = 3.390) were observed. No other effects were observed.
[image:10.595.117.483.227.512.2]10
sound level difference between the comfortable and the uncomfortable compositions (Relaxation dimension) was
significant. In other words, the participants tended to make uncomfortable soundscapes louder than comfortable ones.
Table II Two-Way ANOVA with interaction result
Source of Variation SS df F MS p Dynamic 76.363 1 3.930 76.363 0.051
Relaxation 3319.225 1 170.832 3,319.225 0.000
Dynamic*Relaxation 12.774 1 0.657 12.774 0.419
Error 1865.255 96 3.930 19.430
[image:11.595.71.521.150.688.2]Total 5273.617 99
[image:11.595.71.515.487.729.2]Figure 6 Overall sound level of acoustic environment (N = 100).
Figure 7 Comparison of overall sound levels between comfortable acoustic environment, uncomfortable acoustic environment, and in-situ measurement.
(M=56.5, N=25, SD=5.45)
(M=58.8, N=25, SD=4.72)
(M=67.6, N=25, SD=5.29)
(M=69.8, N=25, SD=2.88)
50.0 55.0 60.0 65.0 70.0 75.0
Comfortable-Simple Comfortable-Varied Uncomfortable-Simple Uncomfortable-Varied
d
B
A
Overall Sound Level of Soundscape Composition N=100
(M=57.7, N=50, SD=5.29)
(M=69.2, N=50, SD=5.37)
(M=66.1, N=10, SD=4.69)
50.0 55.0 60.0 65.0 70.0 75.0
Comfortable Soundscape Uncomfortable Soundscape In-Situ Measurement
dB
A
11
Further analysis was done by comparing the overall sound levels of the acoustic environments with the sound levels measured in situ at selected urban locations. The in-situ measurements were taken between the hours of 12.00-15.00 at several locations in Manchester’s city center: Piccadilly Gardens, Exchange Square, New Cathedral Street, St Ann’s Square, the National Football Museum, Deansgate, and Market Street. A sound-level comparison between comfortable acoustic environments, uncomfortable acoustic environments and in-situ measurements is shown in Figure 7.
The uncomfortable acoustic
environments were 11.5 dB louder on average than the comfortable acoustic environments. Some of the uncomfortable acoustic environments were also louder than the sound levels measured at actual locations. When participants were asked to compose an uncomfortable soundscape, they tended to make the uncomfortable sound objects as loud as possible, resulting in a loud acoustic environment.
Another interesting finding is the sound level of comfortable acoustic environments. The participants composed comfortable soundscapes that were 8.4 dB lower on average than the in-situ measurements. This seems consistent with the results from the in-situ study, which indicated that soundscape recordings should be reproduced 9.5 dB lower than the actual sound level in order to imitate the feeling of being at the actual location [13].
Further analysis was done using principal component analysis (PCA) from the data from Experiment II with Varimax rotation to understand the soundscape dimensions of the composed soundscapes and compare the results with the dimensions obtained from the in-situ experiment [13]. The significant components from the PCA were determined based on their eigenvalues (eigenvalue > 1) and further analysis was done to test for reliability.
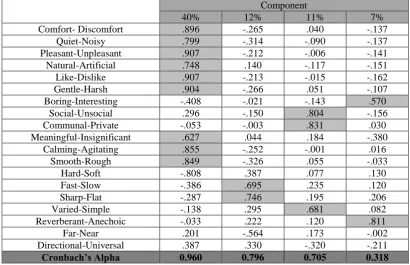
Principal component analysis of the overall data collected was done by combining the results of the semantic scales from the comfortable and uncomfortable acoustic environments. The PCA of the overall data, as shown in Table III and Figure 8a, shows that three reliable (Cronbach’s Alpha > 0.7) components were responsible for 63% of the variance in the responses:
Component 1 (40%):
Calmness/Relaxation. The scales of Comfort-Discomfort, Quiet-Noisy, Pleasant-Unpleasant, Natural-Artificial, Like-Dislike, Gentle-Harsh, Meaningful-Insignificant, Calming-Agitating, and Smooth-Rough loaded highly on this component. The Cronbach’s Alpha of this component was 0.960.
Component 2 (12%):
Dynamics/Vibrancy. The scales of Hard-Soft and Sharp-Flat loaded highly on this component. The Cronbach’s Alpha of this component was 0.796.
Component 3 (11%): Communication. The scales of Social-Unsocial, Communal-Private, and Varied-Simple loaded highly on this component. The Cronbach’s Alpha of this component was 0.705.
The overall data, therefore, show the same reliable soundscape dimensions as in
the in-situ experiment:
Calmness/Relaxation (24%),
Dynamics/Vibrancy (14%), and
Communication (11%) [13]. Moreover, the
dimensions of Dynamics and
Communication in this experiment seem to display a similar amount of variance as in the in-situ experiment.
12
Kang’s study. Furthermore, the dimension of Communication in this study had similar variance as in Kang’s study (11% in this study, 12% in Kang’s).
Using acoustic environment composition, this study also revealed dimensions similar to a field study in France, which suggests three soundscape dimensions: Assessment and Strength (67%), Sound Dynamic (15%), and Spatial Dimension and Clarity (8%) [24]. The dimension of Calmness/Relaxation in our experiment is similar to the dimension of Assessment and Strength and the dimension of Sound Dynamic is also similar to the dimension of Dynamics/Vibrancy.
The present results are also similar to the laboratory study conducted by Davies et al. [8]. This laboratory study sought to
validate an ambisonic soundscape reproduction and showed four soundscape dimensions: Calmness/Relaxation (41%),
Dynamics/Vibrancy (10%),
Communication (7%), and Spatiality (7%). The first three dimensions also appear in this study and displayed similar variance.
[image:13.595.92.503.377.642.2]Further investigation was conducted by analysing the PCA results of the comfortable and the uncomfortable acoustic environments. According to our previous study [13], the sound level of soundscape reproductions could affect participants’ perceptions of them and there were significant sound level differences between the comfortable and the uncomfortable acoustic environments in this experiment.
Table III PCA of overall acoustic environments (N = 200, Kaiser-Mayer-Olkin index 0.931, Bartlett’s test of sphericity sig. 0.000)
Component
40% 12% 11% 7%
Comfort- Discomfort .896 -.265 .040 -.137
Quiet-Noisy .799 -.314 -.090 -.137
Pleasant-Unpleasant .907 -.212 -.006 -.141
Natural-Artificial .748 .140 -.117 -.151
Like-Dislike .907 -.213 -.015 -.162
Gentle-Harsh .904 -.266 .051 -.107
Boring-Interesting -.408 -.021 -.143 .570
Social-Unsocial .296 -.150 .804 -.156
Communal-Private -.053 -.003 .831 .030
Meaningful-Insignificant .627 .044 .184 -.380
Calming-Agitating .855 -.252 -.001 .016
Smooth-Rough .849 -.326 .055 -.033
Hard-Soft -.808 .387 .077 .130
Fast-Slow -.386 .695 .235 .120
Sharp-Flat -.287 .746 .195 .206
Varied-Simple -.138 .295 .681 .082
Reverberant-Anechoic -.033 .222 .120 .811
Far-Near .201 -.564 .173 -.002
Directional-Universal .387 .330 -.320 -.211
Cronbach’s Alpha 0.960 0.796 0.705 0.318
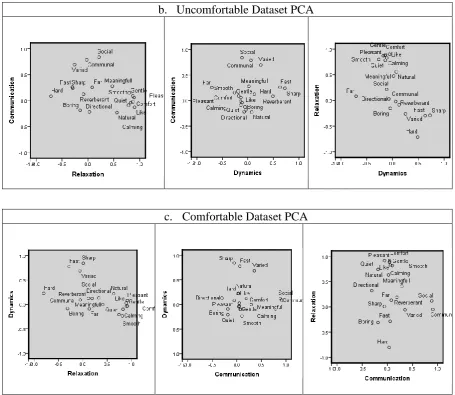
Additional Principal Component Analysis (PCA) was done using the data from the uncomfortable and comfortable acoustic environment samples separately. The PCA of the uncomfortable soundscape data is shown in Table IV and Figure 8b and the PCA of the comfortable soundscape data is shown in Table V and
13
Component 1 (34% in the uncomfortable soundscape datasets and 35% in the comfortable datasets): Calmness/ Relaxation. The scales of Comfort-Discomfort, Quiet-Noisy, Pleasant-Unpleasant, Natural-Artificial, Like-Dislike, Gentle-Harsh, Calming-Agitating, and Smooth-Rough loaded highly on this component. The Cronbach’s Alpha of this component was 0.928 for the uncomfortable soundscape dataset and 0.966 for the comfortable soundscape dataset.
Component 2 (12% in the uncomfortable soundscape datasets and 11% in the comfortable datasets): Communication. The scales of Social-Unsocial, Communal-Private, Varied-Simple loaded highly on this component for the uncomfortable dataset. The component for the comfortable dataset consisted of the scales of Social-Unsocial and Communal-Private. The Cronbach’s Alpha of this component was 0.732 for the
uncomfortable soundscape dataset and 0.767 for the comfortable soundscape dataset.
Component 3 (10% in the uncomfortable soundscape datasets and 11% in the
comfortable datasets):
Dynamics/Vibrancy. The scales of Fast-Slow and Sharp-Flat loaded highly on this component for the uncomfortable dataset. The component for the comfortable dataset consisted of the scales of Fast-Slow, Sharp-Flat and Varied-Simple. The Cronbach’s Alpha of this component was 0.735 for the uncomfortable soundscape dataset and 0.722 for the comfortable soundscape dataset.
[image:14.595.94.499.445.709.2]The PCA data from the uncomfortable and comfortable acoustic environment samples therefore indicate results that are similar to the overall data, and the same reliable dimensions (Calmness/Relaxation, Dynamics/Vibrancy, and Communication) emerge from this set of data.
Table IV PCA of uncomfortable acoustic environments compositions (N = 100, Kaiser-Mayer-Olkin index 0.867, Bartlett’s test of sphericity sig. 0.000).
Component
34% 12% 10% 8% 7%
Comfort-Discomfort .892 .060 -.136 .071 -.152
Quiet-Noisy .783 -.090 -.138 -.069 -.119
Pleasant-Unpleasant .871 -.019 -.142 .066 -.114
Natural-Artificial .559 -.230 .075 .452 .048
Like-Dislike .901 -.125 -.058 .164 -.095
Gentle-Harsh .869 .086 -.180 .112 -.090
Boring-Interesting -.152 -.185 -.042 -.482 .637
Social-Unsocial .214 .838 -.115 .004 -.109
Communal-Private -.022 .784 .059 -.115 .092
Meaningful-Insignificant .473 .279 .022 .338 -.371
Calming-Agitating .829 -.040 -.114 -.091 .052
Smooth-Rough .800 .150 -.266 .099 -.021
Hard-Soft -.712 .081 .489 -.082 .192
Fast-Slow -.298 .260 .633 .123 .258
Sharp-Flat -.291 .239 .728 .073 .169
Varied-Simple -.260 .697 .253 -.129 .029
Reverberant-Anechoic -.086 .124 .128 .135 .743
Far-Near .082 .254 -.707 .205 .211
Directional-Universal .029 -.218 -.070 .830 .017
Cronbach’s Alpha 0.928 0.732 0.735 - 0.279
Table V PCA of Comfortable Acoustic environments (N = 100, Kaiser-Mayer-Olkin index 0.839, Bartlett’s test of sphericity sig. 0.000).
Component
14
Comfort-Discomfort .891 -.041 .040 .008 .044
Quiet-Noisy .742 -.207 -.185 -.103 -.146
Pleasant-Unpleasant .913 .078 -.052 .072 -.071
Natural-Artificial .633 .223 .022 .341 -.132
Like-Dislike .887 .026 .048 .001 -.139
Gentle-Harsh .914 -.029 .044 -.072 -.013
Boring-Interesting -.312 -.089 -.185 .211 .599
Social-Unsocial .119 .122 .880 .007 .015
Communal-Private -.051 .092 .908 .021 .025
Meaningful-Insignificant .406 .001 .292 .499 -.235
Calming-Agitating .825 -.101 .064 .093 .136
Smooth-Rough .814 -.236 .102 -.046 .065
Hard-Soft -.800 .229 .033 .032 -.009
Fast-Slow -.284 .777 .059 .194 -.059
Sharp-Flat .008 .843 -.053 .127 .067
Varied-Simple -.059 .687 .355 -.219 .041
Reverberant-Anechoic .187 .121 .192 -.142 .753
Far-Near .132 -.094 .077 -.849 -.092
Directional-Universal .324 .134 -.305 .256 -.017
Cronbach’s Alpha 0.966 0.722 0.767 - 0.318
15
b. Uncomfortable Dataset PCA
[image:16.595.70.526.70.465.2]c. Comfortable Dataset PCA
Figure 8 Principal component analysis plots
The PCA analysis of the comfortable and the uncomfortable acoustic environments shows the same reliable soundscape dimensions as the overall acoustic environments (Calmness/Relaxation,
Dynamics/Vibrancy, and
Communication), similar to the in-situ study [13]. This result indicates that the simulator is able to imitate the perception of actual soundscapes.
The study conducted by Brown et al. showed that the preference of acoustic environments may have had different due to the different context or locations [25]. A standardization of the soundscape assessment method should be developed, especially to determine the type of outcome to assess a soundscape.
Aletta et al. suggested three methods to assess acoustic environments: in-situ
experiments, laboratory experiments (using recorded or simulated soundscape), and narrative interviews [12].
This study used semantic scales to validate and understand the outcome. Our previous study [13] indicated that three soundscape dimensions appear in both in situ and in laboratory experiments using a
reproduced soundscape:
Calmness/Relaxation,
Dynamics/Vibrancy, and Communication. The present study confirms that the same soundscape dimensions also appear when the laboratory experiment is conducted using simulated acoustic environments. According to our result, the assessment of an urban soundscape can be done according to the dimensions of Calmness/Relaxation,
16
4
Conclusion
An acoustic environment simulator was developed and its validity was analysed in this study. The simulator was developed using three concepts: (i) the structured perspective in the acoustic environment, (ii) sound objects, and (iii) separation of background sounds and event sounds.
The validity of the acoustic environment simulator was analysed by reproducing the soundscapes composed in the simulator by new participants. Principal component analysis showed the same reliable soundscape dimensions as the previous experiment, conducted in situ: Calmness/Relaxation,
Dynamics/Vibrancy, and Communication. This result indicates that the acoustic environmental simulator can simulate an acoustic environment resulting in the same general perception as an actual soundscape. This study also showed that a simulated soundscape is valid for analyzing a soundscape and the result of a simulated acoustic simulator can represent an actual in-situ soundscape.
This study suggested three soundscape dimensions that consistently appear from the in-situ experiment and the laboratory experiments (using reproduced or simulated acoustic environments). Furthermore, it appears that urban soundscapes may be suitable to be rated according to the dimensions of Calmness/Relaxation,
Dynamics/Vibrancy, and Communication
Acknowledgement
This work is part of a study sponsored by the Indonesia Endowment Fund for Education, Ministry of Finance (LPDP), Indonesia
References
[1] Liu, Kang, Behm, Luo, Effects of landscape on soundscape
perception: Soundwalks in city parks, Landsc. Urban Plan. 123
(2014) 30–40.
doi:10.1016/j.landurbplan.2013.12. 003.
[2] C. Semidor, Listening to a city with soundwalk method, Acta Acoust. United with Acoust. 92 (2006) 959–964.
[3] J.Y. Jeon, J.Y. Hong, P.J. Lee, Soundwalk approach to identify urban soundscapes individually., J. Acoust. Soc. Am. 134 (2013) 803– 12. doi:10.1121/1.4807801.
[4] Adams, Bruce, Davies, Cain, Jennings, Carlyle, Cusack, Hume, Plack, Soundwalking s
Methodology for Understanding Soundscapes, in: Inst. Acoust. Spring Conf. 2008, the Institute of Acoustics, Reading, 2008.
http://usir.salford.ac.uk/2461/.
[5] J.Y. Jeon, P.J. Lee, J. You, J. Kang, Perceptual assessment of quality of urban soundscapes with combined noise sources and water sounds., J. Acoust. Soc. Am. 127 (2010) 1357–66. doi:10.1121/1.3298437.
[6] J.Y. Jeon, P.J. Lee, J.Y. Hong, D. Cabrera, Non-auditory factors affecting urban soundscape evaluation., J. Acoust. Soc. Am. 130 (2011) 3761–70.
doi:10.1121/1.3652902.
[7] Ö. Axelsson, M.E. Nilsson, B. Berglund, A principal components model of soundscape perception., J. Acoust. Soc. Am. 128 (2010) 2836–46. doi:10.1121/1.3493436.
[8] W.J. Davies, N.S. Bruce, J.E. Murphy, Soundscape Reproduction and Synthesis, Acta Acust. United with Acust. 100 (2014) 285–292. doi:10.3813/AAA.918708.
17
emotional dimensions of a soundscape, Appl. Acoust. 74 (2013) 232–239.
doi:10.1016/j.apacoust.2011.11.006 .
[10] D.A. Hall, A. Irwin, M. Edmondson-Jones, S. Phillips, J.E.W. Poxon, An exploratory evaluation of perceptual, psychoacoustic and acoustical properties of urban soundscapes, Appl. Acoust. 74 (2013) 248–254. doi:10.1016/j.apacoust.2011.03.006 .
[11] P. Lundén, M. Gustin, M.E. Nilsson, J. Forssén, B. Hellström, Psychoacoustic evaluation as a tool for optimization in the
development of an urban soundscape simulator, Proc. 5th Audio Most. Conf. A Conf. Interact. with Sound. (2010) 1–6. doi:10.1145/1859799.1859802.
[12] F. Aletta, J. Kang, Ö. Axelsson, Landscape and Urban Planning Soundscape descriptors and a conceptual framework for
developing predictive soundscape models, Landsc. Urban Plan. 149 (2016) 65–74.
doi:10.1016/j.landurbplan.2016.02. 001.
[13] A.S. Sudarsono, Y.W. Lam, W.J. Davies, The effect of sound level on perception of reproduced soundscapes, Appl. Acoust. 110 (2016) 53–60.
doi:10.1016/j.apacoust.2016.03.011 .
[14] J. Kang, M. Zhang, Semantic differential analysis of the soundscape in urban open public spaces, Build. Environ. 45 (2010) 150–157.
doi:10.1016/j.buildenv.2009.05.014 .
[15] W.J. Davies, J.E. Murphy, Reproducibility of soundscape dimensions, in: Inter-Noise 2012, New York, 2012.
http://usir.salford.ac.uk/23157/.
[16] A.S. Sudarsono, Y.W. Lam, W.J. Davies, Soundscape Perception Analysis Using Soundscape Simulator, in: Inter Noise 2016, Hamburg, 2016: pp. 6868–6875.
[17] D. Dubois, Categories as Acts of Meaning : The Case of Categories in Olfaction and Audition 1, Cogn. Sci. Q. 1 (2000) 35–68.
[18] D. Dubois, C. Guastavino, M. Raimbault, A Cognitive Approach to Urban Soundscapes: Using Verbal Data to Access Everyday Life Auditory Categories, Acta Acust. United with Acust. 92 (2006) 865–874.
[19] C. Guastavino, D. Dubois, From language and concepts to acoustics: How do people cognitively process soundscapes?, Inter-Noise. (2006) 7.
[20] B. Truax, Genres and techniques of soundscape composition as
developed at Simon Fraser University, Organised Sound. 7 (2002) 5–14.
doi:10.1017/S1355771802001024.
[21] N.S. Bruce, W.J. Davies, M.D. Adams, Development of a soundscape simulator tool, in: Inter-Noise 2009, Ottawa, 2009. http://usir.salford.ac.uk/2467/.
[22] International Organization for Standarization, Draft BS ISO 12913-1 Acoustics - Soundscape. Part 1: Definition and conceptual framework, 44 (2013).
18
http://www.brucewiggins.co.uk/?pa ge_id=78.
[24] M. Raimbault, C. Lavandier, M. Bérengier, Ambient sound
assessment of urban environments: field studies in two French cities, Appl. Acoust. 64 (2003) 1241– 1256. doi:10.1016/S0003-682X(03)00061-6.
[25] A.L. Brown, J. Kang, T. Gjestland, Towards standardization in