Analysis of gene expression in a developmental context emphasizes
distinct biological leitmotifs in human cancers
Kamila Naxerova
*
, Carol J Bult
†
, Anne Peaston
†
, Karen Fancher
†
,
Barbara B Knowles
†
, Simon Kasif
*‡
and Isaac S Kohane
*
Addresses: *Children's Hospital Informatics Program, Harvard-MIT Division of Health Sciences and Technology, Longwood Avenue, Boston, MA 02115, USA. †The Jackson Laboratory, Main Street, Bar Harbor, ME 04609, USA. ‡Department of Biomedical Engineering, Boston University, Cummington Street, Boston, MA 02215, USA.
Correspondence: Isaac S Kohane. Email: [email protected]
© 2008 Naxerova et al.; licensee BioMed Central Ltd.
This is an open access article distributed under the terms of the Creative Commons Attribution License (http://creativecommons.org/licenses/by/2.0), which permits unrestricted use, distribution, and reproduction in any medium, provided the original work is properly cited.
Development and cancer signatures
<p>A systematic analysis of the relationship between the neoplastic and developmental transcriptome provides an outline of global trends in cancer gene expression.</p>
Abstract
Background: In recent years, the molecular underpinnings of the long-observed resemblance between neoplastic and immature tissue have begun to emerge. Genome-wide transcriptional profiling has revealed similar gene expression signatures in several tumor types and early developmental stages of their tissue of origin. However, it remains unclear whether such a relationship is a universal feature of malignancy, whether heterogeneities exist in the developmental component of different tumor types and to which degree the resemblance between cancer and development is a tissue-specific phenomenon.
Results: We defined a developmental landscape by summarizing the main features of ten developmental time courses and projected gene expression from a variety of human tumor types onto this landscape. This comparison demonstrates a clear imprint of developmental gene expression in a wide range of tumors and with respect to different, even non-cognate developmental backgrounds. Our analysis reveals three classes of cancers with developmentally distinct transcriptional patterns. We characterize the biological processes dominating these classes and validate the class distinction with respect to a new time series of murine embryonic lung development. Finally, we identify a set of genes that are upregulated in most cancers and we show that this signature is active in early development.
Conclusion: This systematic and quantitative overview of the relationship between the neoplastic and developmental transcriptome spanning dozens of tissues provides a reliable outline of global trends in cancer gene expression, reveals potentially clinically relevant differences in the gene expression of different cancer types and represents a reference framework for interpretation of smaller-scale functional studies.
Published: 8 July 2008
Genome Biology 2008, 9:R108 (doi:10.1186/gb-2008-9-7-r108)
Received: 4 March 2008 Revised: 31 May 2008 Accepted: 8 July 2008 The electronic version of this article is the complete one and can be
Background
The historical roots of our understanding of the intimate con-nection between tumorigenesis and developmental processes reach back to 1858, when Rudolf Virchow first suggested that neoplasms arise "in accordance with the same law, which reg-ulates embryonic development" [1]. Since then, his idea has profoundly influenced medicine and still remains highly rele-vant today. The similarities between cancer and development are evident on many levels of observation: microscopically, cancerous tissues appear as undifferentiated masses, with some tumor types even exhibiting embryonic tissue organiza-tion. The increased mobility of malignant cells, leading to invasion of the local environment with the potential for sub-sequent travel to distant organs (representing one of the most problematic clinical aspects of cancer), is reminiscent of migratory behavior during development. On the molecular level, the shared characteristics between certain malignant tumors and developing tissues with respect to transcription factor activity [2], regulation of chromatin structure [3] and signaling [4] have been documented. In particular, several studies have suggested that part of the cancer transcriptome represents a 'developmental signature', that is, it contains a set of genes that are collectively active during development. For lung cancer [5,6], liver cancer [7], Wilms' tumor [8], colon cancer [9,10] and medulloblastoma [11], gene expres-sion patterns resembling early developmental stages of the corresponding organ have been identified in the tumor pro-file. The results of these transcriptome-scale analyses are important because they offer a glimpse into fundamental bio-logical processes underlying tumorigenesis and provide a nat-ural framework for understanding complex cancer gene expression signatures that are difficult to interpret otherwise. Moreover, developmental signatures harbor a clinical rele-vance that we are only beginning to discover. For example, lung cancers can be risk-stratified by their similarity to lung development and pluripotency gene signatures can be used to predict outcome in breast cancer [6,12].
In the present study, we paint a novel picture of the oncolog-ical landscape by comparing a variety of human cancers based on their developmental signature. Our analysis was inspired by the following questions: to which extent can the transcrip-tome of a tumor, which is oftentimes perceived as an aberra-tion, be 'explained' by developmental gene expression? Does the developmental signature represent a feature of most, and possibly all, human cancers or does gene expression in differ-ent tumors fall into distinct groups with respect to develop-ment? Is recapitulation of developmental gene expression programs a tissue-specific phenomenon or is the develop-mental signature largely composed of general transcriptional modules that play a ubiquitous role in developmental proc-esses? The answers to these open questions have therapeutic implications [13]. If a broad range of tumors employs primi-tive developmental mechanisms that are shared across tis-sues to sustain their growth and survival, a certain drug or class of drugs could be capable of affecting them all. If, on the
other hand, highly lineage-specific mechanisms govern malignant growth and behavior, focus has to be put on iden-tifying and targeting tissue-specific regulators.
The results from the integrative analysis of gene expression in cancer and development presented here suggest that the developmental information content of most human cancers indeed is significant. The developmental signature of cancers originating from various tissues exhibits low tissue-specifi-city, indicating that a large portion of the cancer transcrip-tome is composed of general developmental modules. Furthermore, we describe three developmentally distinct groups of cancer, validate the class distinction on a new time series of embryonic development in the mouse and show that the behavior of genes in lung development is predictable by their expression across the three groups. We explore the bio-logical themes dominating the expression profiles of these classes and demonstrate that one group recapitulates early developmental gene expression patterns and is characterized by an 'individualistic' signature with upregulation of pluripo-tency genes and suppression of genes involved in cell-cell communication and signal transduction. A second group exhibits a 'communicative' gene expression signature that is active in late development, is enriched in genes involved in immune response, cell-cell and cell-matrix interactions and resembles a wound healing signature. A third group connects the previous two with a transition phenotype. While social and anti-social aspects of cancer have been widely popular-ized, this study points out the possibility of a more subtle clas-sification of different cancers that tend to evoke different types of 'survival mechanisms'. Finally, we identify a core pro-gram of genes that are upregulated in most cancers and show that these genes are coexpressed in early development.
Results
Placing human cancers on a developmental landscape
Our analysis is based on a large-scale comparison of gene expression in 10 developmental processes and 32 cancer data sets. To paint an unbiased picture of the association between gene expression in development and oncogenesis, we selected data from a wide biological range. Our development database encompasses gene expression time series characterizing processes as diverse as heart development in the mouse,
human T cell development and in vitro differentiation of
murine embryonic stem cells (see Additional data file 6 for a list of all data sets). Cancer gene expression data include tumors from most commonly affected anatomical locations and corresponding normal tissue as a reference.
properties of gene expression dynamics during a continuous developmental process: starting at the earliest (least differen-tiated) instance of a series of conditions, genes that are char-acteristic of an immature state will be active. As development progresses, the expression of these genes will gradually abate. Concomitantly, the expression of genes that are specific for the mature state will continuously intensify until it reaches its peak at the latest (most differentiated) point in time. On aver-age, about 30% of the measured genes will follow this pattern. The construction of the DT takes advantage of this behavior, ordering the genes in a linear array based on their temporal pattern of expression. Early genes are localized on the left end of the DT, genes with no bias towards early or late expression center in the middle and late genes occupy the right end. Thus, the unique order of genes on the DT represents a sum-mary of early and late states for each developmental process.
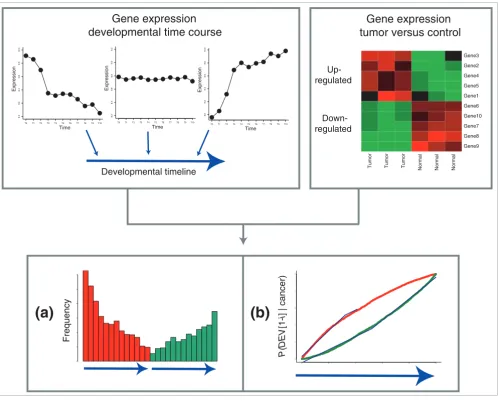
In the next step, we determined the relationship of gene expression in cancer to each of the ten DTs. We identified the genes that were up- and downregulated in a cancer relative to its corresponding normal tissue and tracked their position (or the position of their mouse ortholog for murine developmen-tal processes) on the DTs [11]. In the following, we will use two kinds of plots to summarize the resulting distribution: a frequency plot (Figure 1a) for an intuitive overview of where deregulated cancer genes fall on the DT and a probability den-sity plot (Figure 1b) that allows a more accurate quantifica-tion of the cancer-development relaquantifica-tionship. The frequency plot is divided into two panels: on the left side, the frequency of upregulated genes on the DT is shown; on the right side, the DT is depicted again with the distribution of downregu-lated genes (Figure 1).
The probability density plot shows how likely genes in differ-ent segmdiffer-ents of the DT are to be expressed/suppressed in cancer (see the Figure 1 legend for details). If there was no correlation between gene expression in cancer and develop-ment, the probability distributions would follow a straight line with slope 1. However, if certain parts of the DT contain genes that are up- or downregulated in cancer with a higher frequency than expected by chance, the slope of the probabil-ity densprobabil-ity increases. Conversely, if cancer genes are depleted in a particular segment of the DT, the slope becomes flatter. For the deregulated genes in Figure 1b, this results in an 'open eye' shape of the probability density (the legend to Figure 1 details the quantification of this shape).
A variety of cancers have activated a predominantly tissue-independent developmental signature
We will discuss some general principles emerging from the comparison of all our data sets to the ten DTs on a subset of instances and progress to a global overview thereafter. Figure 2 shows the frequency plots and probability distributions for lung adenocarcinoma, Wilms' tumor, glioblastoma, ovarian cancer and liver cirrhosis with respect to the DTs of lung development, atrial chamber development, embryonic stem
(ES) cell differentiation and T cell development. The distribu-tion of lung adenocarcinoma genes on the lung development DT represents a good starting point for discussion, given that the recapitulation of embryonal pulmonary gene expression in lung cancer has been reported repeatedly [4,5]. The fre-quency plot shows an early peak for upregulated genes, fol-lowed by a gradual decline towards the late end of the DT, implying that genes that are active in lung adenocarcinoma are preferentially expressed in early lung development. The pattern is inversed for downregulated genes, meaning that genes that are characteristic for the mature, differentiated state of the lung are suppressed in lung cancer. The probabil-ity densprobabil-ity confirms this observation with a sharp rise of
P(DEV[1-i] | cancer) for low values of i (early development)
for upregulated genes and high values of i (late development)
for downregulated genes.
Perhaps unexpectedly, the specificity of upregulated lung cancer genes for early development (and downregulated genes for late development) can be reproduced on DTs derived from atrial chamber development, ES cell differenti-ation and T cell development (more examples can be found in Additional data file 1). Apparently, gene expression programs that are exploited during lung tumorigenesis play a ubiqui-tous role in processes involving differentiation and morpho-genesis. This result is in contrast to the prevailing notion that recapitulation of developmental gene expression in cancer is a tissue-specific phenomenon [9,11].
Examination of the developmental distribution of Wilms' tumor genes suggests that this property is not unique to lung cancers. The segregation of up- and downregulated genes in Wilms' tumor on lung development occurs even more con-vincingly than the separation of lung cancer genes. A similar result for many other tumor types (Additional data file 1) sug-gests that this is unlikely to be solely attributable to the embryonal nature of Wilms' tumor. Instead, a general devel-opmental signature that shows very little evidence of tissue-specificity seems to be a hallmark of many cancers. However, there are several notable exceptions.
divergent developmental patterns are unlikely to be random fluctuations. First, their recurrence with respect to changing developmental backgrounds suggests a robust association. Second, up- and downregulated genes have complementary patterns; where upregulated genes are abundant on the DT, downregulated genes are infrequent and vice versa. The expression of certain sets of genes seems to be mutually exclu-sive; if one set is active, the other set is invariably turned off.
Third, a limited number of patterns consistently recurs in dif-ferent data sets.
[image:4.612.57.555.85.486.2]Finally, Figure 2e shows the developmental profile of a dis-ease that does not directly belong to the cancer family: liver cirrhosis. The developmental timing of deregulated genes in cirrhosis is strikingly different from most cancers. Upregu-lated genes have a preference for late development, downreg-Approach to data analysis
Figure 1
Approach to data analysis. A developmental timeline (DT), which is a linear number ray on which each of 5,166 genes has a definite position, is constructed from a time course of gene expression during development (top left panel), positioning genes that are expressed in early development on the left end, genes that are upregulated in late development on the right end and neutral genes in the middle. The DT is integrated with genes that are deregulated in a population of tumors versus corresponding normal tissues (top right panel). (a) Frequency plot showing a histogram-like representation of the frequency of upregulated (red) and downregulated (green) cancer genes in different portions of the DT. The height of each bar indicates how many deregulated genes map to one of 13 equally sized segments of the DT. Each segment corresponds to approximately 400 genes. Up- and downregulated genes are depicted on separate DTs, that is, the first red bar refers to the same DT segment as the first green bar. Stated differently, the height of the first red bar signifies the number of upregulated cancer genes that map to the first 400 developmental genes and the height of the first green bar signifies the number of downregulated cancer genes that map to the same set of 400 developmental genes. (b) Probability density plot showing P(DEV[1,2,3...i] | cancer) for i = 2,3...5,166 for upregulated and downregulated cancer genes. The probability of being among the first i genes on the DT (genes are numbered 1-5,166 from left/early to right/late) if deregulated in cancer directly reflects the preference of cancer genes for different segments of the DT. The shape of each probability distribution is summarized by two linear functions that are fitted to its early and late portions (blue lines). The slopes of these functions are subsequently used as a quantification of the developmental profile of a cancer.
9.0
9.2
9
.4
9.6
9
.8
10.0
Time
Expression
T0 T1 T2 T3 T4 T5 T6 T7 T8 T9 T10
8.2
8.4
8
.6
8.8
9
.0
9.2
Time
Expression
T0 T1 T2 T3 T4 T5 T6 T7 T8 T9 T10
9.0
9.2
9.4
9.6
9.8
10.0
Time
Expression
T0 T1 T2 T3 T4 T5 T6 T7 T8 T9 T10
Developmental timeline
Gene expression
developmental time course
Gene expression
tumor versus control
Up- regulated
Down-regulated
Tumor Tumor Tumor Normal Normal Normal
Gene9 Gene8 Gene7 Gene10 Gene6 Gene1 Gene5 Gene4 Gene2 Gene3
P
(
DEV
[1-i
] | cancer)
6.0
5.0
4.0
3.0
2.0
1.0
0.0
Frequency
(a)
(b)
0.1
8.0
6.0
4.0
2.0
0 .0
0.1
8.0
6.0
4.0
2.0
ulated genes tend to be enriched on the early end of the DTs. This example illustrates that the distribution of deregulated genes in development indeed is a pathophysiology-specific phenomenon.
Three distinct groups of tumors emerge from the developmental landscape
The cases discussed in Figure 2 are a collection of represent-ative examples highlighting some fundamental properties of the association between cancer and development. By visual inspection it is already clear that the developmental profiles of lung adenocarcinoma and Wilms' tumor are more similar to each other than to ovarian cancer, for example. However, if we want to extend this assessment of similarity to a larger number of tumors, a quantitative description of the 'shape' of the developmental profile is required. We realized this quan-tification by fitting two linear curves to each probability dis-tribution, one curve representing its slope in the early part of the DT and the other one approximating the late slope (Figure 1b). Thus, each combination of cancer and developmental process is summarized by a unique set of four values,
consist-ing of two slopes for upregulated and two slopes for downreg-ulated genes.
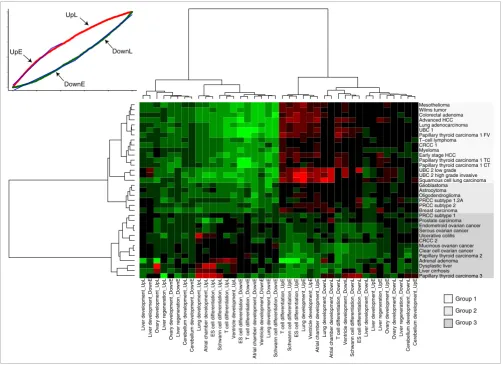
We next used this set of values to establish a high-level over-view of the developmental information in all our datasets. Clustering by the probability distribution slope values (Figure 3) reveals at least three distinct groups of tumors that exhibit disparate developmental patterns. Group 1 contains tumors with 'early' developmental profiles comparable to lung aden-ocarcinoma and Wilms' tumor (Figure 2). This group repre-sents 46% of all datasets and contains tumors from a diversity of anatomical locations, including lung carcinomas, bladder cancers, hepatocellular carcinomas and the hematological malignancy T-cell lymphoma. Clearly, early developmental gene expression is a widespread feature in cancer. An impor-tant observation is that the early developmental signature in all these tumors is only minimally tissue-specific. Many can-cers have approximately equal slope values across diverse developmental backgrounds, meaning that deregulated genes map with the same specificity to the early and late segments of many DTs.
Frequency plots and probability distributions for (a) lung adenocarcinoma, (b) Wilms' tumor, (c) glioblastoma, (d) clear cell ovarian cancer and (e) liver
cirrhosis
Figure 2
Frequency plots and probability distributions for (a) lung adenocarcinoma, (b) Wilms' tumor, (c) glioblastoma, (d) clear cell ovarian cancer and (e) liver cirrhosis. These cases were selected because they are representative of most tumors in our database.
• Lung adenocarcinoma • Wilms tumor • Glioblastoma • Clear cell ovarian cancer • Liver cirrhosis • Lung development 6.0 5.0 4.0 3.0 2.0 1.0 0.0 7.0 6.0 5.0 4.0 3.0 2.0 1.0 0.0 6.0 5.0 4.0 3.0 2.0 1.0 0.0 4.0 3.0 2.0 1.0 0.0 52.0 02.0 51.0 01.0 50.0 00.0 • Atrial chamber development 5.0 4.0 3.0 2.0 1.0 0.0 6.0 4.0 2.0 0.0 6.0 5.0 4.0 3.0 2.0 1.0 0.0 4.0 3.0 2.0 1.0 0.0 02.0 51.0 01.0 50.0 00.0 • ES cell differentiation 5.0 4.0 3.0 2.0 1.0 0.0 6.0 5.0 4.0 3.0 2.0 1.0 0.0 6.0 5.0 4.0 3.0 2.0 1.0 0.0 4.0 3.0 2.0 1.0 0.0 02.0 51.0 01.0 50.0 00.0 • T cell development 6.0 5.0 4.0 3.0 2.0 1.0 0.0 7.0 6.0 5.0 4.0 3.0 2.0 1.0 0.0 6.0 5.0 4.0 3.0 2.0 1.0 0.0 4.0 3.0 2.0 1.0 0.0 51.0 01.0 50.0 00.0 (a) (c) (b) (d) (e) Lung
development Atrial chamber development ES cell differentiation T cell development Lungdevelopment Atrial chamber development ES cell differentiation T cell development
Group 2 contains several tumors with an ambiguous correla-tion with developmental gene expression. Glioblastoma is part of this group, next to several other central nervous system tumors, breast cancer, and the more aggressive forms of papillary renal cell carcinoma (subtypes 1.2A and 2). Exam-ination of the frequency plots and probability distributions for these cancers (Additional data file 1) shows that two types of tumors are found in this group: those that do recapitulate early developmental gene expression, but also exhibit addi-tional transcripaddi-tional programs that are not consistent with the developmental gradient (for example, glioblastoma); and tumors that are consistent with the gradient, but whose deregulated genes show a less dramatic preference for the extremes of the DTs (for example, breast carcinoma).
Group 3, featuring several subtypes of ovarian cancer, pros-tate cancer, two independent data sets of papillary thyroid carcinoma (PTC) and two independent instances of renal cell carcinoma, displays a transcriptional phenotype that is com-pletely distinct from groups 1 and 2. Upregulated genes have no clear preference for early development. In fact, in some instances they accumulate on the late end of the DTs, co-clus-tering with liver cirrhosis, dysplastic liver and ulcerative coli-tis. The behavior of downregulated genes varies considerably. In some cases - most notably the ovarian cancers - they com-plement upregulated genes, but in PTC 3 for example, up- and downregulated genes peak in similar DT segments, hinting at active regulatory mechanisms that are not found in normal developmental processes. It is apparent that group 3 is a much more heterogeneous collection of diseases than groups 1 or 2.
[image:6.612.54.557.86.450.2]Heatmap of probability distribution slopes
Figure 3
Heatmap of probability distribution slopes. Thirty-two expression data sets of neoplasia versus corresponding normal tissue (and liver cirrhosis versus normal liver, dysplastic liver versus normal liver and ulcerative colitis versus non-inflamed colon) are compared against all 10 DTs. Each comparison is characterized by a four-dimensional vector of slopes derived from the probability distributions (example in top left corner). Two slope values stem from the distribution of upregulated genes on the DT, two are derived from the distribution of downregulated genes (Figure 1). UpE = slope for upregulated genes in the early part of the DT; UpL = slope for upregulated genes in the late part of the DT; DownE = slope for downregulated genes in the early part of the DT; DownL = slope for downregulated genes in the late part of the DT. Red indicates a steep slope (high specificity of up- or downregulated genes for that segment of the DT), green indicates a flat slope (depletion of up- or downregulated genes in that segment).
Group 1
Group 2
Group 3
Liver development_UpL
Liver development_DownE Ovary development_UpL
Liver regeneration_UpL
Ovary development_DownE Liver regeneration_DownE
Cerebellum development_UpL
Cerebellum development_DownE
Lung development_UpL
Atrial chamber development_UpL
ES cell differentiation_UpL
Schwann cell differentiation_UpL
T cell differentiation_UpL
Ventricle development_UpL
ES cell differentiation_DownE T cell differentiation_DownE
Atrial chamber development_DownE
Ventricle development_DownE
Lung development_DownE
Schwann cell differentiation_DownE
T cell differentiation_UpE
Schwann cell differentiation_UpE
ES cell differentiation_UpE
Lung development_UpE
Ventricle development_UpE
Atrial chamber development_UpE
Lung development_DownL
Atrial chamber development_DownL
T cell differentiation_DownL
Ventricle development_DownL
Schwann cell differentiation_DownL
ES cell differentiation_DownL
Liver development_DownL
Liver development_UpE Liver regeneration_UpE Ovary development_UpE
Ovary development_DownL Liver regeneration_DownL
Cerebellum development_DownL
Cerebellum development_UpE
Papillary thyroid carcinoma 3 Liver cirrhosis Dysplastic liver Adrenal adenoma Papillary thyroid carcinoma 2 Clear cell ovarian cancer Mucinous ovarian cancer CRCC 2
Ulcerative colitis Serous ovarian cancer Endometroid ovarian cancer Prostate carcinoma PRCC subtype 1 Breast carcinoma PRCC subtype 2 PRCC subtype 1.2A Oligodendroglioma Astrocytoma Glioblastoma
Squamous cell lung carcinoma UBC 2 high grade invasive UBC 2 low grade
Papillary thyroid carcinoma 1 CT Papillary thyroid carcinoma 1 TC Early stage HCC
Myeloma CRCC 1 T−cell lymphoma Papillary thyroid carcinoma 1 FV UBC 1
Lung adenocarcinoma Advanced HCC Colorectal adenoma Wilms tumor Mesothelioma
0.1
8 .0
6.0
4 .0
2.0
0.0
0.1
8.0
6.0
4.0
2.0
0.0
UpL
UpE DownL
Of note, two data sets in group 3 have counterparts of histo-logically similar tumors located in group 1. PTC is represented with three, and clear cell renal cell carcinoma (CRCC) with two independent data sets in our database. Two of the PTC data sets belong to group 3; a third data set, which is divided in three histological subtypes of PTC (follicular, tall cell and conventional variant) is part of group 1. Possibly, the lacking histological subclassification of PTCs belonging to group 3 emphasizes a different transcriptional theme in those tumors. Even more likely, the paired experimental design of the two group 3 PTC data sets - in both cases, tissue from the same patient served as a normal control - influences the gene expression signature. We will address this issue in more detail in the discussion.
The CRCC data sets are concordant as far as the top third of differentially expressed genes is concerned. Considering only the 450 most differentially expressed genes reveals a pro-nounced preference of upregulated genes for the late part of DTs in both data sets (Additional data file 3), making CRCC more similar to diseases like liver cirrhosis and ulcerative col-itis and implying that the early peak that places CRCC 1 among the 'early developmental' tumors is a less significant addition to a prominent 'late' transcriptional program.
While groups 1 and 3 are clearly distinct, it is debatable whether group 2 should be treated as its own entity. It is apparent that there is a spectrum of developmental signa-tures, with most cancer types clustering at its early or late end and a few intermediate cases that cannot be classified unam-biguously. Examining the distribution of probability distribu-tion slope values for upregulated genes in the early segment of the DTs (the most distinguishing feature) exemplifies this point (Additional data file 8). The distribution is bimodal, with most cancers falling into the early or late peak and group 2 tumors occupying the middle. To achieve a clear biological separation in subsequent analyses, we decided to treat these intermediate cases as a distinct class; it remains to be deter-mined in more comprehensive studies whether this group can be identified reproducibly.
The contribution of proliferation-related genes to the developmental pattern in cancer
Since early stages of most developmental processes involve massive proliferation, part of the similarity between early development and cancer can most certainly be attributed to cell cycle (CC)-related genes. Also, the clinical behavior of the cancers constituting the three groups raises the question whether a proliferation signature could be driving their devel-opmental profile. Group 1 mostly consists of aggressive tumors with low doubling times (for example, urinary bladder cancer, lung cancer, Wilms' tumor), while group 3 contains more indolent forms. Tumors like ovarian and renal cancer are associated with poor outcome because they metastasize frequently and do not respond well to chemotherapy, but their growth rate tends to be relatively low [14-16]. Also,
pros-tate and thyroid cancers are well-known for their slow growth [17,18].
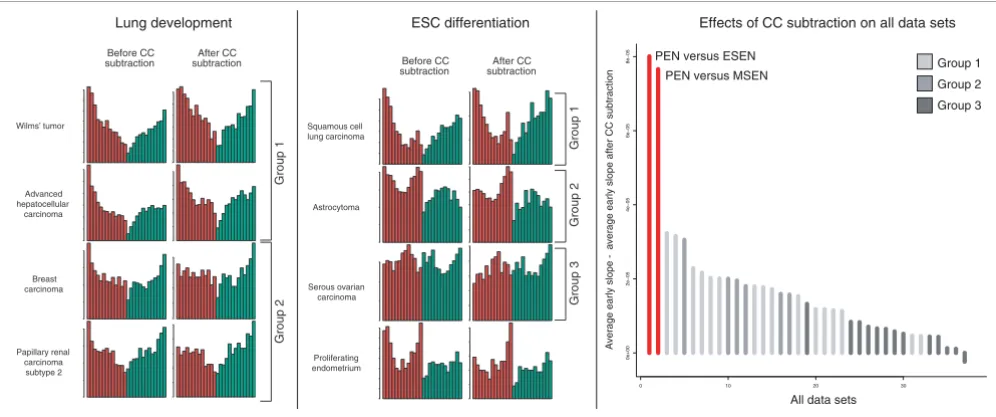
In order to determine whether the developmental component in cancer is more than a proliferation signature, we rigorously eliminated genes that are correlated with progression through the CC in HeLa cells [19] from the deregulated genes of all cancers (see Materials and methods), discounting approximately 50% of differentially expressed genes in many data sets. Figure 4 shows selected developmental profiles before and after this CC subtraction. Group 1 tumors are largely unaffected. Their profiles become noisier due to the reduction of the number of differentially expressed genes, but the shape remains qualitatively unchanged. In group 2, how-ever, the early peaks in the frequency distribution disappear, suggesting that the CC is a dominant factor in the upregulated genes mapping to early development here, which does not seem to be the case in group 1. The profiles of group 3 tumors also remain constant. To see whether this surprising robust-ness to CC subtraction is a cancer-specific phenomenon, we constructed a developmental profile for proliferating endometrium (PEN) versus early secretory endometrium (ESEN) as a model for a proliferating, but non-malignant tis-sue. Similarly to tumors in group 1, most genes upregulated in PEN map to early development. In contrast to cancer, how-ever, the effects of CC subtraction are much more pro-nounced. Figure 4c shows a quantitative assessment of these effects, defined as the difference of the probability density slope for early upregulated genes before and after CC subtrac-tion. Clearly, the developmental component in cancer is less CC dominated than in the PEN. This becomes particularly vis-ible on the background of ES cell differentiation (Figure 4b). Discounting CC-regulated genes completely eliminates the early peak in the frequency distribution for PEN, while the profile for squamous cell lung carcinoma and other group 1 tumors (Additional data file 2) does not change. This demonstrates that cancer shares a common gene expression signature with stem cells that cannot be found in normal PEN tissue. Finally, clustering all data sets by their probability dis-tribution slope values after CC subtraction results in the same distinction between groups 1, 2 and 3 as the one shown in Fig-ure 3 (Additional data file 4). We therefore conclude that the CC is not the main determinant of the disparate gene expres-sion programs in these tumors.
Gene expression in groups 1, 2 and 3 is dominated by different biological processes
repair genes are active in pre-implantation and late gesta-tional development and have been shown to be essential for embryonic viability and development of extra-embryonic tissues [20]. Downregulated genes in group 1 belong to proc-esses that are underrepresented in eDEV500 and enriched in lDEV500. These include cell communication, signal trans-duction and system development, processes that are required for the establishment and maintenance of a structured tissue organization. It is noteworthy that downregulated genes in group 2 diverge from this theme. The prominent observation here is that genes required for aerobic respiration are reduced; this could either point at hypoxic conditions or the Warburg effect (a shift towards lactate production in cancer cells even under normal oxygen supply). From a developmen-tal perspective, upregulated genes in group 3 represent a mir-ror image of group 1. They map to similar terms as lDEV500, namely immune response, cell adhesion and multicellular organismal process. While the latter two processes clearly gain importance in the course of organogenesis, immune response is less obviously associated with late developmental stages. The role of cytokine signaling in hematopoiesis is well-established, but its function in the development of other tis-sues is incompletely understood. However, it is becoming clear that chemokines do not only function as chemoattract-ants for immune cells during inflammation, but also fulfill essential roles in embryogenesis and tissue homeostasis [21]. For example, inhibition of signaling through the chemokine receptor CXCR4 leads to defects in migration and differentia-tion in the developing chick limb [22]. In cancer, chemokine signaling can also affect migratory behavior. For instance, mesenchymal stem cells in the tumor stroma are able to
increase breast cancer cell motility through paracrine CCL5 signaling [23]. The expression of inflammation-related genes in cancer tissue is frequently interpreted as a consequence of an immune response against the tumor. Interestingly, the developmental perspective suggests that a similar gene expression signature exists during the normal development of several tissues without the involvement of an inflammatory reaction.
The difference between early and late developmental genes, and consequently genes activated in group 1 versus group 3, is also evident when comparing the cellular localization of their gene products. Proteins that are produced in early devel-opment and group 1 are predominantly located in the nucleus. Similarly, upregulated genes in group 2 have prod-ucts with nuclear localization and specific involvement in the CC. Gene products of lDEV500 and group 3, however, are chiefly membrane-associated or secreted into the extracellu-lar space.
[image:8.612.55.553.87.295.2]Finally, we compared the PEN to development and cancer. As expected, upregulated genes were mostly CC-related. How-ever, they were not depleted for cell communication or signal transduction genes like eDEV500 and cancers in groups 1 and 2, suggesting that proliferating cells of the endometrium retain a higher level of communication with their surround-ings than those in cancer or early development. Downregu-lated genes were associated with lipid metabolism and showed no enrichment for organogenesis or multicellular processes like lDEV500 and downregulated genes in group 1. Effects of CC subtraction
Figure 4
Effects of CC subtraction. Frequency plots of selected cancer types on the backdrop of lung development (left panel) and ES cell differentiation (middle panel) are depicted before and after the dismissal of hundreds of CC regulated genes. The corresponding probability distributions can be viewed in Additional data files 9 and 10. The right panel shows the effects of this CC subtraction on all data sets, quantified as the difference of the early probability distribution slope value (UpE) before and after elimination of CC regulated genes. PEN versus ESEN = proliferating endometrium versus early secretory endometrium; PEN versus MSEN = proliferating endometrium versus mid secretory endometrium.
• • • • • • Lung develo pment 7.0 6.0 5.0 4.0 3.0 2.0 1.0 0.0 6.0 5.0 4.0 3.0 2.0 1.0 0.0 4.0 3.0 2.0 1.0 0.0 4.0 3.0 2.0 1.0 0.0 • • • • • • Lung dev elo pment 03.0 52.0 02.0 51.0 01.0 50.0 00.0 52.0 02.0 51.0 01.0 50.0 00.0 02.0 51.0 01.0 50.0 00.0 52.0 02.0 51.0 01.0 50.0 00.0 Wilms’ tumor Advanced hepatocellular carcinoma Breast carcinoma Papillary renal carcinoma subtype 2 Before CC subtraction After CC subtraction Group 1 Group 2 Squamous cell lung carcinoma Astrocytoma Serous ovarian carcinoma Proliferating endometrium Group 1 Group 2 Group 3 • • • • • • Lung dev elopme nt 51.0 01.0 50.0 00.0 03.0 52.0 02.0 51.0 01.0 50.0 00.0 52.0 02.0 51.0 01.0 50.0 00.0 01.0 80.0 60.0 40.0 20.0 00.0 • • • • • • Lung development 03.0 52.0 02.0 51.0 01.0 50.0 00.0 4.0 3.0 2.0 1.0 0.0 3.0 2.0 1.0 0.0 41.0 21.0 01.0 80.0 60.0 40.0 20.0 00.0 After CC subtraction Before CC subtraction
Lung development ESC differentiation Effects of CC subtraction on all data sets
0 3 0 2 0 1 0 e 2 0 0 + e 0− e 4 5 0−e 6 5 0−e 8 5 0− 0 5 A v
erage early slope -
a
v
erage early slope after CC subtraction
All data sets PEN versus ESEN
PEN versus MSEN
Group 1
Group 2
Taken together, these results suggest a unique relationship between malignancy and development that is not fully
[image:9.612.51.552.110.678.2]reca-pitulated in normal proliferating tissues.
Table 1
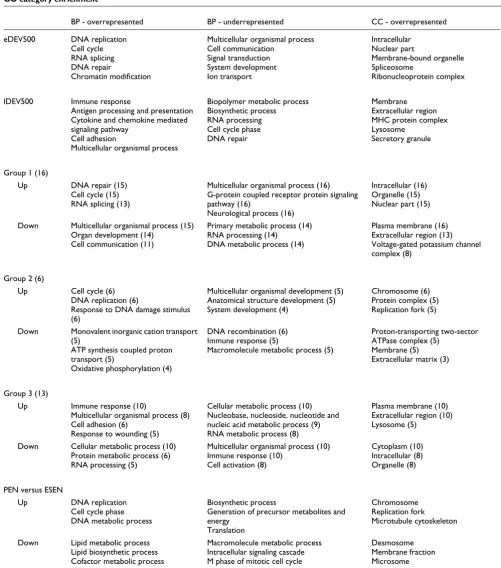
GO category enrichment
BP - overrepresented BP - underrepresented CC - overrepresented
eDEV500 DNA replication
Cell cycle RNA splicing DNA repair
Chromatin modification
Multicellular organismal process Cell communication
Signal transduction System development Ion transport
Intracellular Nuclear part
Membrane-bound organelle Spliceosome
Ribonucleoprotein complex
lDEV500 Immune response
Antigen processing and presentation Cytokine and chemokine mediated signaling pathway
Cell adhesion
Multicellular organismal process
Biopolymer metabolic process Biosynthetic process RNA processing Cell cycle phase DNA repair
Membrane Extracellular region MHC protein complex Lysosome
Secretory granule
Group 1 (16)
Up DNA repair (15)
Cell cycle (15) RNA splicing (13)
Multicellular organismal process (16) G-protein coupled receptor protein signaling pathway (16)
Neurological process (16)
Intracellular (16) Organelle (15) Nuclear part (15)
Down Multicellular organismal process (15)
Organ development (14) Cell communication (11)
Primary metabolic process (14) RNA processing (14)
DNA metabolic process (14)
Plasma membrane (16) Extracellular region (13) Voltage-gated potassium channel complex (8)
Group 2 (6)
Up Cell cycle (6)
DNA replication (6)
Response to DNA damage stimulus (6)
Multicellular organismal development (5) Anatomical structure development (5) System development (4)
Chromosome (6) Protein complex (5) Replication fork (5)
Down Monovalent inorganic cation transport
(5)
ATP synthesis coupled proton transport (5)
Oxidative phosphorylation (4)
DNA recombination (6) Immune response (5)
Macromolecule metabolic process (5)
Proton-transporting two-sector ATPase complex (5)
Membrane (5) Extracellular matrix (3)
Group 3 (13)
Up Immune response (10)
Multicellular organismal process (8) Cell adhesion (6)
Response to wounding (5)
Cellular metabolic process (10) Nucleobase, nucleoside, nucleotide and nucleic acid metabolic process (9) RNA metabolic process (8)
Plasma membrane (10) Extracellular region (10) Lysosome (5)
Down Cellular metabolic process (10)
Protein metabolic process (6) RNA processing (5)
Multicellular organismal process (10) Immune response (10)
Cell activation (8)
Cytoplasm (10) Intracellular (8) Organelle (8)
PEN versus ESEN
Up DNA replication
Cell cycle phase DNA metabolic process
Biosynthetic process
Generation of precursor metabolites and energy
Translation
Chromosome Replication fork Microtubule cytoskeleton
Down Lipid metabolic process
Lipid biosynthetic process Cofactor metabolic process
Macromolecule metabolic process Intracellular signaling cascade M phase of mitotic cell cycle
Desmosome Membrane fraction Microsome
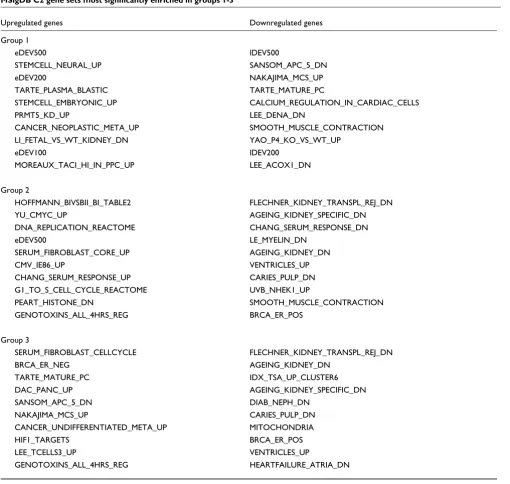
Among hundreds of curated gene sets, the developmental signature is the best descriptor of approximately 50% of interrogated tumor types
We next wanted to determine how well our developmental signatures describe the difference between cancer and nor-mal tissue in a direct comparison with other gene sets. We downloaded the C2 database from MSigDB [24], a collection of gene sets derived from gene expression studies and known pathways, and tested the enrichment of approximately 1,000 gene sets in the up- and downregulated genes of our data sets. Subsequently, we compared the results with the performance of eDEV500, lDEV500 and four smaller gene sets that were defined analogously, eDEV200/lDEV200 and eDEV100/ lDEV100.
Table 2 shows the gene sets that were most significantly enriched in the up- and downregulated genes of the three groups. Upregulated genes in group 1 are best represented by eDEV500, which is a remarkable result because no cancer gene expression data were used in deriving this gene set, but solely time courses of mouse development (all DTs except for T cell development are murine). Many data sets in MSigDB, on the other hand, are directly derived from gene expression profiles of human cancers. Of course, the groups were defined by the distribution of deregulated genes in development, but group 1 is not a specialized subset, but comprises almost 50% of our data sets. Two of the top ranks next to eDEV500 and eDEV200 are occupied by sets of genes that are upregulated in stem cells, implying a close connection between early development and pluripotency that is also evident in the can-cer gene expression profile. CC gene sets are not among the most enriched signatures, but the imprint of 'stemness' can clearly be distinguished in group 1 tumors, even though our data sets represent heterogeneous tissues containing a variety of cell types. Conversely, lDEV500 is the most significant gene set in the downregulated genes of group 1, next to genes that are downregulated in various tumor models (SANSO M_APC_5_DN, LEE_DENA_DN, LEE_ACOX1_DN) and signatures found in activated mast cells (NAKAJIMA_M CS_UP), confirming the aforementioned association of late developmental genes and downregulated genes in group 1 cancers with the immune response.
eDEV500 is less significant in group 2 than in group 1. This is consistent with previous results showing a less pronounced clustering of upregulated genes in early development for group 2. Instead, two independent serum response signatures are enriched in the upregulated genes (SERUM_FIBRO BLAST_CORE_UP, CHANG_SERUM_RESPONSE_UP). Besides stimulating proliferation, serum exposure induces a wound healing response in fibroblasts, involving the activa-tion of genes that play a role in intercellular signaling and remodeling of the extracellular matrix [25]. These are both processes that map to late development in our analysis. Indeed, group 2 tumors tend to have both an early and a late
peak in the frequency distribution of upregulated genes (Fig-ure 2).
As already noted in the context of GO classification, gene sets enriched in group 3 are a counterpart of group 1. eDEV500 does not rank among the top gene sets, nor do any of the stem cell signatures. Instead, three signatures that are enriched in group 1 downregulated genes are overrepresented in the upregulated genes of group 3 (TARTE_MATURE_PC, SAN SOM_APC_5_DN, NAKAJIMA_MCS_UP). The combina-tion of serum-induced cell division (SERUM_FIBRO BLAST_CELLCYCLE) and immune response gene sets again suggests an association with wound healing, but the early developmental component that is so prominent in group 1 and also present in group 2 is lacking in group 3.
To visualize how well the tumors inside of a group agree on the significance of a gene set, we clustered all data sets by the
p-values for the top 20 signatures in the upregulated genes of
the three groups (Figure 5). Group 1 presents very homogene-ously with only few exceptions such as the thyroid carcinomas and renal carcinoma. Both of these cancers have counterparts in group 3 and have already been mentioned as ambiguous cases. The variation in group 2 is also low. Its position as a transition state between groups 1 and 3 is clearly visible in the heatmap as a general agreement with group 1, but simultane-ous activation of a cluster of gene sets (hypoxia response, immune response, cell adhesion receptor activity) that are enriched in group 3 and insignificant in group 1. Group 3 clearly represents a distinct entity, but intra-group variation is substantial, confirming a greater heterogeneity among these tumors. Notwithstanding, they are all characterized by the lack of a pronounced developmental/stemness compo-nent and activation of inflammatory signatures. An analo-gous heatmap for gene sets enriched in downregulated genes (Additional data file 5) shows that the distinction of groups 1-3 is also present in genes that are suppressed in these cancers.
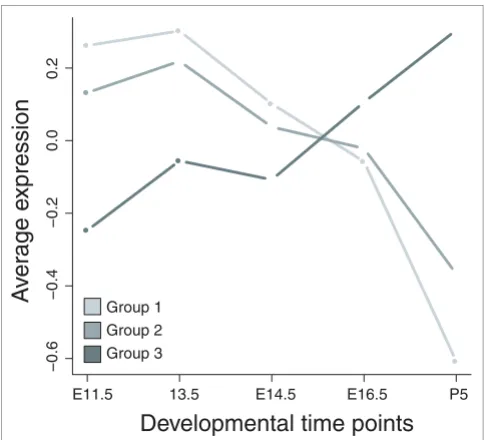
The class distinction is reproducible on an independent time series
genes to have a more ambiguous expression pattern and genes activated in group 3 to be expressed late. We defined three consensus signatures by selecting those genes that are expressed in at least 60% of the data sets in each group (80% for group 2 to account for smaller group size). Figure 7 shows the average expression value for the three consensus gene sets at each time point in our lung developmental time series. Indeed, consensus genes for groups 1 and 2 are upregulated in early development (with a more pronounced decline of group 1 genes in late development), while group 3 genes are active late. Remarkably, the fact that a set of genes is expressed in a particular group of tumors is enough to predict the average
temporal expression pattern of these genes during embryonic development in a different species, further highlighting the deep-rooted connection between development and tumorige-nesis.
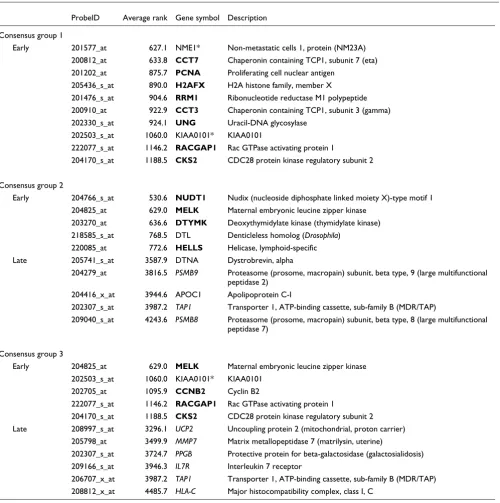
Table 3 shows some examples of the consensus genes, sorted by their average rank across all DTs. Consensus genes in group 1 are almost exclusively expressed very early on
(aver-age rank <1,500) and include molecular chaperones (CCT3,
CCT7), proliferation-related genes (RACGAP1, PCNA and its
associated factor KIA1001 [26]) and DNA repair genes (UNG,
[image:11.612.54.564.109.593.2]H2AFX). The consensus set of group 2 includes genes that are
Table 2
MSigDB C2 gene sets most significantly enriched in groups 1-3
Upregulated genes Downregulated genes
Group 1
eDEV500 lDEV500
STEMCELL_NEURAL_UP SANSOM_APC_5_DN
eDEV200 NAKAJIMA_MCS_UP
TARTE_PLASMA_BLASTIC TARTE_MATURE_PC
STEMCELL_EMBRYONIC_UP CALCIUM_REGULATION_IN_CARDIAC_CELLS
PRMT5_KD_UP LEE_DENA_DN
CANCER_NEOPLASTIC_META_UP SMOOTH_MUSCLE_CONTRACTION
LI_FETAL_VS_WT_KIDNEY_DN YAO_P4_KO_VS_WT_UP
eDEV100 lDEV200
MOREAUX_TACI_HI_IN_PPC_UP LEE_ACOX1_DN
Group 2
HOFFMANN_BIVSBII_BI_TABLE2 FLECHNER_KIDNEY_TRANSPL_REJ_DN
YU_CMYC_UP AGEING_KIDNEY_SPECIFIC_DN
DNA_REPLICATION_REACTOME CHANG_SERUM_RESPONSE_DN
eDEV500 LE_MYELIN_DN
SERUM_FIBROBLAST_CORE_UP AGEING_KIDNEY_DN
CMV_IE86_UP VENTRICLES_UP
CHANG_SERUM_RESPONSE_UP CARIES_PULP_DN
G1_TO_S_CELL_CYCLE_REACTOME UVB_NHEK1_UP
PEART_HISTONE_DN SMOOTH_MUSCLE_CONTRACTION
GENOTOXINS_ALL_4HRS_REG BRCA_ER_POS
Group 3
SERUM_FIBROBLAST_CELLCYCLE FLECHNER_KIDNEY_TRANSPL_REJ_DN
BRCA_ER_NEG AGEING_KIDNEY_DN
TARTE_MATURE_PC IDX_TSA_UP_CLUSTER6
DAC_PANC_UP AGEING_KIDNEY_SPECIFIC_DN
SANSOM_APC_5_DN DIAB_NEPH_DN
NAKAJIMA_MCS_UP CARIES_PULP_DN
CANCER_UNDIFFERENTIATED_META_UP MITOCHONDRIA
HIF1_TARGETS BRCA_ER_POS
LEE_TCELLS3_UP VENTRICLES_UP
expressed early and late. Early genes fall into similar categories as the group 1 consensus, that is, DNA repair (NUDT1, DTL), proliferation (DTMYK, MELK) and DNA
methylation (HELLS). Late genes are involved in signal
trans-duction (DTNA) and antigen processing (TAP1). PSMB8 and
PSMB9 are part of the immunoproteasome, a special form of the proteasome that is active after stimulation of cells with
interferon-γ and is constitutively expressed in dendritic cells.
The immunoproteasome exhibits modified cleavage proper-ties that have been shown to affect tumor antigen processing and consequently cytotoxic T cell responses [27]. Consensus genes in group 3 mainly map to late development and are
involved in antigen processing (HLA-C, TAP1), extracellular
matrix remodeling (MMP7), proteolysis (PPGB), and
cytokine signaling (IL7R). However, the group 3 consensus
also contains a fraction of early genes that overlap with early
consensus genes in groups 1 and 2 (CKS2, MELK, KIAA0101*,
RACGAP1). Considering the small size of the consensus gene sets - 20, 58 and 29 genes for groups 1-3, respectively - this level of unanimity is striking and suggests the existence of a
'core program' that is active in all cancers, regardless of large-scale differences in the global gene expression program.
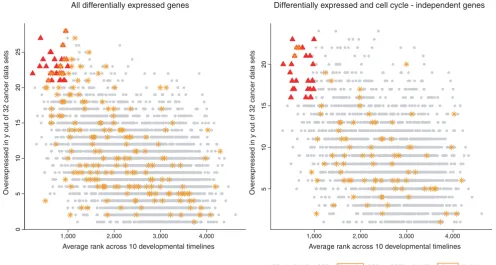
A core program of genes expressed in most cancers is active in early development
To further explore the notion of a tissue-independent core program in cancer, we scored each gene by how many times it is upregulated in all cancer data sets (here, we excluded liver cirrhosis, dysplastic liver and ulcerative colitis) and com-pared this score to the average rank of the gene across all DTs. Figure 8 shows a highly significant inverse relationship between the developmental rank of a gene and its
overexpres-sion frequency (p < 2.2e-16). The top-scoring genes in this
comparison are related to proliferation and DNA repair and also include transcripts coding for chromatin remodeling
proteins (EZH2), a histone variant that has recently been
linked with stem cell proliferation [28] (H2AFX) and
RNA-interacting proteins (ELAVL1, SNRPA). To see whether the
relationship between developmental rank and overexpres-sion in cancer is robust towards CC subtraction, we excluded
[image:12.612.57.555.84.456.2]Heatmap of enrichment p-values
Figure 5
Heatmap of enrichment p-values. The p-values for gene sets that ranked among the 20 most enriched in the upregulated genes of either group 1, 2 or 3 are shown for all data sets. Red indicates low p-values, green high p-values.
Group 1
Group 2
Group 3
HIF1_TARGETS
WIELAND_HEPATITIS_B_INDUCED
ICHIBA_GVHD
NEMETH_TNF_UP
CELL_ADHESION_RECEPTOR_ACTIVITY
GH_EXOGENOUS_ANY_UP
DAC_PANC_UP
TARTE_MATURE_PC NAKAJIMA_MCS_UP SANSOM_APC_5_DN
CHANG_SERUM_RESPONSE_UP SERUM_FIBROBLAST_CORE_UP
LEE_TCELLS2_UP
LE_MYELIN_UP
TARTE_PLASMA_BLASTIC
LI_FETAL_VS_WT_KIDNEY_DN
CANCER_NEOPLASTIC_META_UP
CELL_CYCLE_KEGG
CELL_CYCLE
LEI_MYB_REGULATED_GENES
CIS_XPC_UP
GOLDRATH_CELLCYCLE
POD1_KO_UP
PEART_HISTONE_DN ADIP_DIFF_CLUSTER5
CANCER_UNDIFFERENTIATED_META_UP
YU_CMYC_UP
HOFFMANN_BIVSBII_BI_TABLE2
IDX_TSA_UP_CLUSTER3
SERUM_FIBROBLAST_CELLCYCLE
BRCA_ER_NEG
GREENBAUM_E2A_UP
GENOTOXINS_ALL_4HRS_REG
LEE_TCELLS3_UP
DNA_REPLICATION_REACTOME
VERNELL_PRB_CLSTR1
G1_TO_S_CELL_CYCLE_REACTOME
CMV_IE86_UP
REN_E2F1_TARGETS
HDACI_COLON_BUT16HRS_DN
DEV50 DEV500 DEV200 DEV100
ET743_SARCOMA_DN
STEMCELL_NEURAL_UP
STEMCELL_EMBRYONIC_UP
PENG_GLUTAMINE_DN
PENG_LEUCINE_DN
RCC_NL_UP
PRMT5_KD_UP
MOREAUX_TACI_HI_IN_PPC_UP MOREAUX_TACI_HI_VS_LOW_DN
PRCC subtype 2 Astrocytoma Glioblastoma CRCC 1 Early stage HCC Breast carcinoma T−cell lymphoma Oligodendroglioma
Papillary thyroid carcinoma 1 CT Papillary thyroid carcinoma 1 TC Papillary thyroid carcinoma 1 FV Myeloma
Prostate carcinoma Advanced HCC Wilms tumor UBC 2 low grade Colorectal adenoma UBC 2 high grade invasive Squamous cell lung carcinoma Mesothelioma
Lung adenocarcinoma UBC 1
Ulcerative colitis Serous ovarian cancer Endometroid ovarian cancer PRCC subtype 1 CRCC 2 PRCC subtype 1.2A Adrenal adenoma Dysplastic liver
Papillary thyroid carcinoma 3 Papillary thyroid carcinoma 2 Liver cirrhosis
all CC-regulated genes as previously described. The
associa-tion remains highly significant (p < 2.2e-16). Top-scoring
genes are mainly involved in RNA processing (CSTF2,
SNRPA, SNRPA1, SNRPE, USP39, HNRPAB), which could either be a secondary effect of proliferation or reflect the increased metabolic activity of cancer cells, and chromatin
remodeling (ACTL6A, SMARCC1), indicating that epigenetic
mechanisms may be involved in the maintenance of an embryonic phenotype in many cancers.
Discussion
We have presented a comprehensive, tissue-spanning com-parison of gene expression in normal development and human cancer. Main conclusions emerging from this analysis are that a large percentage of tumors recapitulate early devel-opmental gene expression and that the develdevel-opmental signa-ture in these cancers exhibits low tissue-specificity. Furthermore, we have identified three groups of cancers dis-tinguished by disparate developmental signatures. One group has an early developmental phenotype and expresses genes that are characteristic of stem cells. From a developmental perspective, this group presents very homogeneously. This is
all the more surprising as it contains cancer types with com-plex karyotypes, which are currently thought to lead to more 'chaotic' gene expression. A second, more heterogeneous group tends to be more similar to late development and is characterized by an inflammatory signature. A small group of cancers presents as a transition phenotype between these two extremes and displays both characteristics. This group dis-tinction is reproducible with respect to a new time series of embryonic lung development in the mouse. Finally, we have identified a core program of genes that are expressed in most cancers and mapped the activity of this transcriptional pro-gram to early development.
An unexpected result is the low tissue-specificity of the devel-opmental signature, contrasting with previous reports [9,11]. We cannot exclude the possibility that cancer types that were not included in our database recapitulate more tissue-specific developmental patterns. However, our findings suggest that comprehensive comparisons against a diverse set of develop-mental backgrounds are required before a specific association between a cancer and the development of its cognate tissue can be established on the gene expression level. It is likely that a lineage-specific aspect does exist in cancer gene expres-Heatmap of probability distribution slopes for all data sets with respect to the lung development validation time series
Figure 6
Heatmap of probability distribution slopes for all data sets with respect to the lung development validation time series. Abbreviations and colors are the same as in Figure 3.
LungDev_val_DownE
LungDev_val_UpL LungDev_val_UpE
LungDev_val_DownL
Papillary thyroid carcinoma 3 Endometroid ovarian cancer Serous ovarian cancer Ulcerative colitis CRCC 2 Adrenal adenoma Liver cirrhosis Dysplastic liver
Papillary thyroid carcinoma 2 Mucinous ovarian cancer Clear cell ovarian cancer Prostate carcinoma PRCC subtype 1 PRCC subtype 1.2A CRCC 1 Glioblastoma Astrocytoma Breast carcinoma Oligodendroglioma Early stage HCC PRCC subtype 2 T−cell lymphoma
Papillary thyroid carcinoma 1 CT Myeloma
Lung adenocarcinoma Papillary thyroid carcinoma 1 TC Squamous cell lung carcinoma UBC 1
Colorectal adenoma UBC 2 high grade invasive Wilms tumor
Advanced HCC
Papillary thyroid carcinoma 1 FV UBC 2 low grade
Mesothelioma
Group 1
Group 2
sion [13], but its magnitude seems to be small in comparison with more generic developmental modules. Possibly, micro-RNA profiles might be better suited for detection of such sub-tle signals because they reflect more specific processes than mRNA profiles [29].
Given the type of analysis conducted here, intended to reveal broad brush strokes rather than subtleties, the clear segrega-tion of tumors into three groups with distinct expression pat-terns is surprising. Clearly, the developmental trajectory provides a meaningful background for capturing large-scale differences in gene expression across diverse conditions. That said, we can only speculate as to what the biological determi-nants of the observed segregation might be as they are poten-tially as broad as the contexts in which a proliferative response is 'normal' and physiological.
The capability to divide in response to certain conditions is an inherent property of most cells. Epithelia can augment the production of new cells in response to mechanical irritation [30], fibroblasts divide to reconstitute injured tissue [31], the microvasculature of the female reproductive system periodi-cally expands [32], hepatocytes reconstitute liver tissue after hepatectomy [33] and, of course, cells divide to form a new organism during embryogenesis. The transcriptional programs driving these processes might be as diverse as the contexts that trigger proliferation. Cancers likely exploit endogenous cellular mechanisms to sustain their growth, but our understanding of which of the available paths towards proliferation is chosen in different types of cancers is
rudi-mentary. Our analysis suggests that tumors in group 1 recapitulate an embryonic phenotype: they express early developmental and stem cell genes, suppress genes character-istic of mature tissues and they have downregulated messages required for intercellular communication and signaling. Cell cycle in these tumors might be fueled through the same mech-anisms that are employed in rapidly proliferating blastemal cells. Group 3, on the other hand, presents a different picture. Differentially expressed genes imply that proliferation here could occur in the context of wound healing, which is associ-ated with all the processes that are relevant in group 3 (inflammatory reaction, proliferation, tissue remodeling). The conception of cancer as a 'wound that does not heal' has often been cited [34]. Our analysis suggests that it might be more applicable to some tumors than to others. Indeed, the clinical behavior of tumors in group 3 seems to exhibit some special features. Even though ovarian cancer is known as a malignancy with poor prognosis, its growth rate often is slow and patients can live with metastases for years [14]. Renal cell carcinoma also has a poor prognosis when metastatic; how-ever, most renal cell carcinomas have an indolent growth rate [15]. Finally, thyroid cancers are also recognized for their slow growth [17]. It is not clear whether the inflammatory gene expression signature we observe in these tumors is a cause or consequence of this particular behavior, but further investi-gation of this question has profound clinical implications. If tumors truly rely on distinct programs for proliferation and survival, a classification system that takes these differences into consideration could provide valuable guidelines for ther-apeutic decisions. Based on our study, for example, we would predict that a drug interfering with the wound healing pro-gram might be effective against both ovarian and renal carci-noma, but not against Wilms' tumor or lung adenocarcinoma. Interestingly, a recent paper that examined gene expression in mouse models of colon carcinoma in a developmental
con-text revealed a distinction between Smad3-/- and Tgfb1-/-;
Rag2-/- models (both exhibiting a strong inflammatory com-ponent and showing similarity to late colon development) and ApcMin/+ and AOM models, which recapitulated early colon development [10]. This result implies that different genetic alterations might underlie the distinct gene expres-sion signatures in group 1 and 3 cancers.
To refine the distinction between the developmental groups of cancers emerging from our analysis, more data - ideally acquired under standardized conditions - are necessary. While the embryonic cancers in group 1 seem to represent a fairly homogeneous population with respect to their develop-mental component, diseases in group 3 are far more heterog-eneous and more reliable data would probably lead to further sub-classification of these cancers. Standardized data would also likely help to resolve the group affiliation of ambiguous cases like thyroid carcinoma. Both PTC data sets mapping to group 3 are paired experiments, with tumor and normal tis-sue coming from the same patient, while the PTC data set in group 1 is unpaired. Such differences seem to have a larger Average expression level of consensus gene sets in the lung development
[image:14.612.54.297.85.305.2]validation time series
Figure 7
Average expression level of consensus gene sets in the lung development validation time series. Consensus group 1 = genes overexpressed in 11/16 data sets belonging to group 1; consensus group 2 = genes overexpressed in 5/6 data sets belonging to group 2; consensus group 3 = genes overexpressed in 8/13 data sets belonging to group 3.
•
•
•
•
•
−0.6
−0.4
−0.2
Developmental time points
A
v
er
age e
xpression
E11.5 13.5 E14.5 E16.5 P5
•
•
•
•
• •
•
•
•
•
Group 1 Group 2 Group 3
0.0
impact on the genes that are identified as differentially expressed than commonly assumed. A recent study elegantly proves this point by showing an altered gene expression sig-nature in 'normal' tissue adjacent to lung tumors [35]. Other possibly confounding factors like the degree of lymphocyte
[image:15.612.56.556.114.617.2]infiltration in different samples and the already mentioned specification of histological subtype might play important roles in determining the developmental profile of a tumor and should be accounted for in future studies.
Table 3
Example genes from the consensus sets of groups 1-3 ordered by their average rank across all DTs
ProbeID Average rank Gene symbol Description
Consensus group 1
Early 201577_at 627.1 NME1* Non-metastatic cells 1, protein (NM23A)
200812_at 633.8 CCT7 Chaperonin containing TCP1, subunit 7 (eta)
201202_at 875.7 PCNA Proliferating cell nuclear antigen
205436_s_at 890.0 H2AFX H2A histone family, member X
201476_s_at 904.6 RRM1 Ribonucleotide reductase M1 polypeptide
200910_at 922.9 CCT3 Chaperonin containing TCP1, subunit 3 (gamma)
202330_s_at 924.1 UNG Uracil-DNA glycosylase
202503_s_at 1060.0 KIAA0101* KIAA0101
222077_s_at 1146.2 RACGAP1 Rac GTPase activating protein 1
204170_s_at 1188.5 CKS2 CDC28 protein kinase regulatory subunit 2
Consensus group 2
Early 204766_s_at 530.6 NUDT1 Nudix (nucleoside diphosphate linked moiety X)-type motif 1
204825_at 629.0 MELK Maternal embryonic leucine zipper kinase
203270_at 636.6 DTYMK Deoxythymidylate kinase (thymidylate kinase)
218585_s_at 768.5 DTL Denticleless homolog (Drosophila)
220085_at 772.6 HELLS Helicase, lymphoid-specific
Late 205741_s_at 3587.9 DTNA Dystrobrevin, alpha
204279_at 3816.5 PSMB9 Proteasome (prosome, macropain) subunit, beta type, 9 (large multifunctional
peptidase 2)
204416_x_at 3944.6 APOC1 Apolipoprotein C-I
202307_s_at 3987.2 TAP1 Transporter 1, ATP-binding cassette, sub-family B (MDR/TAP)
209040_s_at 4243.6 PSMB8 Proteasome (prosome, macropain) subunit, beta type, 8 (large multifunctional
peptidase 7)
Consensus group 3
Early 204825_at 629.0 MELK Maternal embryonic leucine zipper kinase
202503_s_at 1060.0 KIAA0101* KIAA0101
202705_at 1095.9 CCNB2 Cyclin B2
222077_s_at 1146.2 RACGAP1 Rac GTPase activating protein 1
204170_s_at 1188.5 CKS2 CDC28 protein kinase regulatory subunit 2
Late 208997_s_at 3296.1 UCP2 Uncoupling protein 2 (mitochondrial, proton carrier)
205798_at 3499.9 MMP7 Matrix metallopeptidase 7 (matrilysin, uterine)
202307_s_at 3724.7 PPGB Protective protein for beta-galactosidase (galactosialidosis)
209166_s_at 3946.3 IL7R Interleukin 7 receptor
206707_x_at 3987.2 TAP1 Transporter 1, ATP-binding cassette, sub-family B (MDR/TAP)
208812_x_at 4485.7 HLA-C Major histocompatibility complex, class I, C
To gain a better understanding of the biology underlying dif-ferent loci on the developmental landscape, it might also be helpful to include more pathological conditions unrelated to cancer in the analysis. For many diseases, we have sufficiently good understanding of etiology and pathophysiology to be able to use them as 'landing lights' on the developmental surface.
Conclusion
The results presented here suggest that there is great poten-tial for better understanding of human disease in a 'macrobio-logical' approach to analyzing high-throughput data. Shifting our focus from single sets of genes or processes to the biology of aggregates on the order of the entire transcriptome is likely to be useful in establishing highly robust molecular correla-tions between seemingly unrelated disease phenotypes.
Materials and methods
Data
All gene expression data with the exception of the lung devel-opment validation series came from the public domain. Developmental time courses were profiled on several
differ-ent Affymetrix chips (MG-430 2.0, MG-430A, MG-U74, Mu11K, HG-U133A). To exclude potential platform-related bias, we restricted ourselves to Affymetrix U133A or HG-U133 Plus 2.0 arrays for cancer gene expression profiles. A detailed description of all data sets can be found in Additional data file 6.
Data preprocessing
When available, .CEL files were downloaded and arrays were normalized and expression measures calculated using the robust multi-array average [36,37]. When raw data were not available, MAS5 preprocessed expression values were down-loaded, quantile-normalized and log2-transformed.
Cross-platform comparison and homology mapping
[image:16.612.57.553.92.357.2]On Affymetrix arrays, a gene is often assayed by several probe sets. We first reduced each platform to unique Entrez Gene IDs. To avoid artifacts in downstream analyses caused by biased probe set selection, we randomly chose the probe set that would represent a gene on a particular platform. Probe sets with no Entrez ID were removed. In the next step, we used the homologene database (NCBI) to define orthologs between the human and the mouse. Entrez IDs with no ortholog were removed from all platforms. Finally, we Cancer core program genes before and after cell cycle subtraction
Figure 8
Cancer core program genes before and after cell cycle subtraction. Genes overexpressed in >20/32 data sets and with an average DT rank <1,000 are marked in red and their names are listed below the table (left panel). Analogously for the right panel, with the parameter relaxed to overexpression in >15/32 data sets to account for the reduced number of genes after elimination of CC genes. Genes belonging to the GO category 'cell cycle' are marked as orange asterisks (and with orange boxes in the right panel) to allow a better assessment of the effects of CC subtraction.
•
Average rank across 10 developmental timelines
Ov
ere
x
pressed in y out of 32 cancer data sets
•
1,000
Average rank across 10 developmental timelines
Ov
ere
x
pressed in y out of 32 cancer data sets
AURKB - CCNE1 - CCT3 - CDC2 - CDC20 - CDCA4 - CDK2AP1 - CDT1 - CENPA - CKS2 - DNMT1 - DTL - DTYMK - ELAVL1 - EZH2 - FLJ14668 - H2AFX - KIF20A - LMNB1 - MCM2 - MCM7 - MELK - NME1 - PCNA - POLD1 - PSMD14 - RFC4 - SNRPA - TIMELESS - TOPBP1 - TRIP13 - TTK - UNG
ACTL6A - BANF1 - CCT7 - CDK2AP1 - CSE1L - CSTF2 - DNMT1 - DTYMK - ELAVL1 - FLJ14668 - HNRPAB - MRE11A - NME1 - NUDT1 - NUP107 - PARP1 - POLR2H - PSMD14 - RAE1 - RDBP - SEC61G - SFRS9 - SMARCC1 - SNRPA - SNRPA1 - SNRPE - SSB - USP39
Differentially expressed and cell cycle - independent genes All differentially expressed genes
2,000 3,000 4,000 1,000 2,000 3,000 4,000
0
5
10
15
20
25
51
0
1
5
2