1
Dual stimulation of antigen presenting cells using carbon nanotube−based
vaccine delivery system for cancer immunotherapy.
Hatem A. F. M. Hassan
1, Lesley Smyth
2, Julie T.−W. Wang
1, Pedro M. Costa
1, Kulachelvy
Ratnasothy
2, Sandra S. Diebold
3, Giovanna Lombardi
2*, Khuloud T. Al−Jamal
1*Hatem A. F. M. Hassan, Pedro M. Costa,
Julie T.−W. Wang, Khuloud T. Al−Jamal
1
Institute of Pharmaceutical Science, Faculty of Life Sciences & Medicine, King's College
London, Franklin−Wilkins Building, London SE1 9NH, United Kingdom
Lesley Smyth, Kulachelvy Ratnasothy, Giovanna Lombardi
2
Immunoregulation Laboratory, MRC Center for Transplantation, King’s College London,
Guy’s Hospital, London SE1 9RT, United Kingdom
Sandra S. Diebold
3
Division of Immunology, Infection, and Inflammatory Diseases, King’s College London,
Guy’s Hospital, London SE1 9RT, United Kingdom
*Corresponding authors: khuloud.al-jamal@kcl.ac.uk, giovanna.lombardi@kcl.ac.uk
Current address for Lesley Smyth:
School of Health, Sport and Biosciences, University of East London, Stratford Campus, Water
Lane, London E15 4LZ, UK
Current address for Sandra S. Diebold
:Immunotoxicology Team, Biotherapeutics Division, National Institute for Biological
Standards and Control (NIBSC), Blanche Lane, South Mimms, Potters Bar, Hertfordshire, EN6
3QG, UK
3
Supplementary materials
Ethylenediaminetetraacetic acid (EDTA) was purchased from Sigma (UK). Bicinchoninic acid (BCA) protein assay reagent was purchased from Fisher Scientific (UK). Sulfo−SMCC was purchased from Biovision (USA). Amicon Ultra 0.5 ml 30 k and Amicon Ultra 0.5ml 3 k were purchased from Millipore (Germany). Horseradish peroxidise (HRP) conjugated goat anti-mouse IgG was purchased from Cayman chemical (USA). HRP conjugated goat anti-mouse IgG1 was purchased from Bethyl laboratories (USA). HRP conjugated goat anti-mouse IgG2c was purchased from Southern Biotech (USA). Penicillin, streptomycin, RPMI 1640 medium, 2-mercaptoethanol, L-glutamine, HEPESbuffer solution and SYBR Gold were purchased from Life Technologies (UK). 10% heat inactivated foetal calf serum (FCS) was purchased from First Link (UK). Allophycocyanin (APC) anti−CD11c, fluorescein isothiocyanate (FITC) anti−H−2kb, phycoerythrin (PE) anti−I−A[b], PE CD40, PE anti−CD80, PE anti−CD86, FITC IgG2a, κ isotype, PE IgG2a κ isotype, PE IgG2a κ isotype, PE IgG2 κ isotype, FITC IgG2b κ isotype, APC IgG2a κ isotype were purchased from Becton Dickinson (USA).
Supplementary methods
Synthesis of OVA−CpG conjugate
Synthetic steps are illustrated in Scheme S1.
Maleimide−activation of OVA
4 Activation of thiol−modified CpG
Thiol−modified CpG was dissolved in PBS at 10 mg/ml. DTT was dissolved in water at 77 mg/ml. To 200 µl of thiol−modified CpG (2 mg CpG), 20 µl of DTT were added and stirred together for 60 min at RT. Using the 0.1 M NaCl/PBS buffer and a 3 kDa Amicon 0.5 spin filter, excess DTT was removed by spinning at 14000 rpm for 12 min. The washing step was repeated three more times; the last washing step was performed using a conjugation buffer consisting of 2 mM EDTA in PBS (pH 7.1). Activated thiol−modified CpG was recovered from the 3 kDa Amicon 0.5 spin filter as a concentrated solution of 30−40 µl.
OVA conjugation with CpG
Maleimide−activated OVA and activated thiol−modified CpG were mixed and stirred together for 90 min at RT. Using the 0.1 M NaCl/PBS buffer and a 3 kDa Amicon 0.5 spin filter, excess CpG was removed by spinning at 14000 rpm for 12 min. The washing step was repeated six more times; the last washing step was performed using PBS. OVA−CpG conjugate was recovered from the 3 kDa Amicon 0.5 spin filter as a concentrated solution of 70 µl. Conjugated OVA and CpG content was determined using BCA assay and NanoDrop, respectively.
Determination of OVA content in synthesized conjugates using BCA assay
The BCA assay was performed as previously described with some modifications [1]. A calibration curve was prepared using 25−2000 μg/ml of OVA in PBS (pH7.4). For the quantification of OVA contained in the OVA−CpG conjugate, collected samples were diluted 25 times prior measurements. Following the determination of unreacted OVA concentration in the collected filtrates, OVA content in S−/+(OVA−CpG), (OVA)S−/+(CpG) or (αCD40)S−/+(OVA−CpG) was calculated using the following
equation as µg of OVA per mg of S−/+:
[Initially added amount of OVA (μg) − unreacted OVA detected in the filterate (μg)]
5
Determination of CpG content in synthesized conjugates using NanoDrop
To determine the CpG content in OVA−CpG conjugate, standard concentrations of CpG were prepared ranging from 20 to 800 μg/ml, each standard was spiked with OVA at a final concentration of 500 μg/ml. The concentration of the prepared CpG standards was measured using NanoDrop ND−1000 spectrophotometer (NanoDrop Technologies, Wilmington, USA). A calibration curve was plotted for the measured CpG concentration versus the prepared CpG concentration. The OVA content in the OVA−CpG sample was adjusted to 500 μg/ml, afterwards CpG concentration was measured using NanoDrop. From the calibration curve the actual CpG concentration was determined. The same procedure was followed for the determination of CpG content in S−/+(OVA−CpG), (OVA)S−/+(CpG) or
(αCD40)S−/+(OVA−CpG) with few modifications. Standard concentrations of CpG were prepared
ranging from 20 to 800 μg/ml, each standard was spiked with OVA at a final concentration of 150 μg/ml. OVA concentration in filtrate samples collected following filtration of S−/+(OVA−CpG),
(OVA)S−/+(CpG) or (αCD40)S−/+(OVA−CpG) was adjusted to 150 μg/ml before determining the CpG
concentration. Following the determination of unreacted CpG concentration in the collected filtrates, CpG content in S−/+(OVA−CpG), (OVA)S−/+(CpG) or (αCD40)S−/+(OVA−CpG) was calculated using
the following equation as µg of CpG per mg of S−/+:
[Initial amount of CpG (μg) − unreacted CpG detected in the filterate (μg)]
[Initial weight of S−/+ (mg) added to the reaction]
Determination of αCD40 content in (αCD40)S−/+ using BCA assay
A calibration curve was prepared using 25−500 μg/ml of αCD40 in PBS and the BCA assay was carried out as described before. αCD40 content in (αCD40)S−/+ was calculated using the following equation as
µg of αCD40 per mg of S−/+:
[Initial amount of αCD40 (μg) − αCD40 detected in the filterate (μg)]
6 In vitro stability
S−/+(OVA) and S−/+(CpG) were dispersed in PBS (pH 7.4) at 1 mg/ml and transferred to dialysis
membranes of 100 kDa MWCO and 10 kDa MWCO, respectively. The dialysis membranes were then exposed to constant agitation in PBS (pH 7.4) at 37 ◦C for 1, 3 or 7 days. To determine OVA or CpG
contained in the conjugates at the specified time points by gel electrophoresis, S−/+(OVA) containing
10 µg OVAwas transferred to the wells of 15% native, non-reducing gel and S−/+(CpG) containing 1
µg CpGwas transferred to the wells of 2% agarose gel. OVA and CpG bands were detected by gel staining with Coomassie Brilliant blue and SYBR Gold, respectively.
Culture medium
The complete culture medium used throughout the experiments consisted of RPMI 1640 medium, supplemented with 100 IU/ml penicillin, 100 μg/ml streptomycin, 2 mM L−glutamine, 50 μM 2−Mercaptoethanol, 0.01 M HEPES buffer solution and 10% heat inactivated FCS. Cells were incubated in a humidified atmosphere of 5% CO2 at 37 oC.
Determination of BM−DC phenotypes following treatment with (OVA)S−/+(CpG) and S−/+(OVA−CpG) in vitro
BM−DCs were incubated for 24 hr with OVA, CpG, (OVA)S−/+(CpG) or S−/+(OVA−CpG) each
contained 5 μg/ml OVA. Expression of MHC I, MHC II, CD40, CD80 or CD86 by the CD11c+ve
BM−DCs was determined using flow cytometry as described before [1]. Briefly, BM−DCs harvested following the incubation period were incubated for 30 minutes with a mixture of fluorescently−labelled antibodies consisting of anti−CD11c antibody and anti−MHC I, MHC II, CD40, CD80 or CD86 antibody. BM−DCs incubated with fluorescently−labelled isotype non−specific antibodies were used as controls. Stained BM−DCs were analyzed using CellQuest software (BD Bioscience, US) operated FACSCalibur and subsequent analysis was carried out using FlowJo software (TreeStar, US).
Optimization of OVA/CpG doses required for induction of OVA presentation in vitro
7 Treated BM−DCs were harvested and co−cultured with CD8+ T cells isolated from OT−I mice spleen
at 1:4 ratio and CD8+ T cells proliferation was assessed using 3H−thymidine incorporation assay.
Quantification of OVA−specific antibodies produced following immunization with (OVA)S−/+(CpG) or S−/+(OVA−CpG) in mice using ELISA
C57BL/6 mice (n= 3) were injected via the footpad with PBS, OVA−CpG, (OVA)S−/+(CpG) or
S−/+(OVA−CpG) each at 6 μg OVA. At day 21 post injection, mice were bled via the inferior vena cava,
collected blood samples were allowed to clot at R.T. then mice sera were separated by centrifugation at 16000 g for 20 min. Quantification of OVA−specific antibodies in the mice sera using ELISA was performed using a previously reported method [2]. Using 100 μl per well of 1 μg/ml OVA in PBS (pH 7.4), wells of high protein binding polystyrene 96−well plate (Corning Costar, USA) were coated and incubated overnight at 4 oC. The plate was 3 times washed using 0.05% Tween 20 in PBS and blocking
was performed using 4% BSA in Tween 20/PBS for 1 h at R.T. The plate was 3 times washed and mice sera were two fold diluted using Tween 20/PBS then transferred in triplicates to the plate and incubated for 3 hr at R.T. Following the mice sera removal, the plate was five times washed using Tween 20/PBS. Horse radish peroxidise−conjugated goat anti−mouse IgG, IgG1 and IgG2c were diluted in Tween 20/PBS at 1:10,000 then 100 μl of each were transferred to the plate and incubated for 1 hr at R.T. The plate was five times washed using Tween 20/PBS. OVA−specific antibodies were detected by the addition of TMB, reaction was stopped by the addition of 0.2 M sulphuric acid. The absorbance was measured at 450 nm using (FLUOstar Omega, BMG LABTECH, Germany).
Determination of BM−DC phenotypes following treatment with (αCD40)S−/+(OVA−CpG) in vitro
BM−DCs were incubated for 24 hr with S−/+(OVA−CpG), mixture of unconjugated αCD40 and
S−/+(OVA−CpG) or (αCD40)S−/+(OVA−CpG) each contained 0.5 μg/ml OVA, 0.5 μg/ml CpG and/or
1.8 μg/ml αCD40. As a positive control BM−DCs were treated with 2.5 μg/ml CpG. Expression of MHC I, MHC II, CD40, CD80 or CD86 by the CD11c+ve BM−DCs was determined using flow
8
Assessment of the anti−tumour response induced by S−/+(OVA−CpG) in melanoma OVA−B16F10−Lucsubcutaneous tumour model
C57BL/6 mice (n= 8) were subcutaneously inoculated in both flanks with 2.5 × 10⁵ OVA−B16F10−Luc.
On the 3rd and 10th days post tumour inoculation mice were immunized via footpad injection with
S−/+(OVA−CpG) containing 12 or 25 µg of both OVA and CpG in 50 µl PBS. PBS injected mice were
used as untreated controls. A calliper was used to measure the tumour length (L) and width (W), and the tumour volume was calculated using the following equation: Tumour volume= 0.52 × W2 × L. Mice
were sacrificed when the tumour volume reached 1000 mm3.
Assessment of the anti−tumour response induced by S−/+(OVA−CpG) in melanoma B16 subcutaneous tumour model
C57BL/6 mice (n= 8) were subcutaneously inoculated in both flanks with 2.5 × 10⁵ B16 cells (obtained
from Cancer Research UK Cell Service Laboratory). On the 3rd and 10th days post tumour inoculation,
mice were immunized via footpad injection with S−/+(OVA−CpG) containing 25 µg of both OVA and
CpG in 50 µl PBS. PBS injected mice were used as untreated controls. Tumour growth was monitored using calliper measurements as described before.
Assessment of anti−tumour response induced by S−/+(OVA−CpG) in melanoma OVA−B16F10−Luc lung pseudo−metastatic tumour model
C57BL/6 mice were intravenously inoculated with 2.5 × 10⁵ OVA−B16F10−Luc cells. On the 7th day
post tumour inoculation, mice were randomly assigned to 2 groups (n= 6−8). On the 4th and 9th days
post tumour inoculation, mice were immunized via footpad injection with S−/+(OVA−CpG) containing
9
10
Table S1. Zeta potential of the functionalized MWNTs and synthesized conjugates.
Zeta potentiala (mV)
MWNT 1 −20.9
S−/+ −7.27
(OVA)S−/+(CpG) −43.7
S−/+(OVA−CpG) −41.9
11
Table S2. Loading efficiencies of the conjugates.a
OVA loading
efficiency (%) efficiency (%) CpG loading αCD40 loading efficiency (%)
(OVA)S−/+(CpG) 41 ± 6.8 52.4 ± 5.2 −
S−/+(OVA−CpG) 26 ± 5.9 24.8 ± 4.6 −
(αCD40)S−/+(OVA−CpG) 16.5 ± 6.4 15.5 ± 4.2 56.4 ± 7.2
12
Figure S1. Optimization of CpG or OVA/CpG doses required for induction of BM−DC maturation or OVA presentation in vitro, respectively. (A) Dose−dependant stimulation of BM−DC maturation by CpG in vitro. BM−DCs were incubated for 24 h with 1, 5 or 10 µg/ml CpG and then analyzed for CD40 or CD86 expression using flow cytometry. BM−DCs were stained with specific fluorescently labelled antibodies or their corresponding isotype control antibodies, 10 x 104 cells were
acquired using flow cytometry and the analysis was performed using FLowJo 7.6.5 software. The MFI of the positive CD11c−expressing BM−DCs was measured to assess the fold change in the expression of each marker with respect to the naïve BM−DCs. The optimal CpG dose for induction of BM−DC maturation was found to be 5 µg/ml. (B) Dose−dependant stimulation of CD8+ T cell proliferation in
vitro by OVA + CpG or OVA−CpG. BM−DCs were incubated for 24 h with OVA + CpG or OVA−CpG each contained 1, 5 or 10 µg/ml of both OVA and CpG. As a control, BM−DCs were incubated for 24 h with OVA alone at 1, 5 or 10 µg/ml. Treated BM−DCs were co−cultured with CD8+ T cells, isolated
from the spleen of OT−I C57BL/6 mice, at 1:4 ratio for 3 days. On the last 18 h, CD8+ T were pulsed
with 1 µCi of 3H−thymidine and the CD8+ T cell proliferation was measured using 3H−thymidine
incorporation assay. Measurements were performed in triplicates for each condition, results represent the mean ± S.D. * P < 0.05, ** P < 0.01, *** P < 0.001. Stimulation of BM−DCs with 5 µg/ml of both OVA and CpG contained in with OVA + CpG or OVA−CpG was found optimal for OVA presentation.
A B
1 5 10
0.0 0.5 1.0 1.5 2.0 2.5 8 12 16 CD40 CD86
CpG (g/ml)
M ea n fo ld c ha ng e in M FI Naïv e BM-DC
T ce ll alone +
CD8
1 5 10
0.0 0.52 4 6 8 10 12 OVA
OVA + CpG OVA-CpG
(g/ml)
[image:12.595.74.536.87.337.2]13
Figure S2. In vitro stability. (A) Assessment of in vitro stability of S−/+(OVA) using PAGE. S−/+(OVA)
was dispersed in PBS (pH 7.4) at 1 mg/ml and exposed to constant agitation for 1, 3 or 7 days at 37 ◦C.
At the indicated time points, S−/+(OVA) containing 10 µg OVA was transferred to the wells of 15%
native, non-reducing gel. Bands were detected by gel staining with Coomassie Brilliant blue. (B)
Assessment of in vitro stability of S−/+(CpG) using agarose gel electrophoresis. S−/+(CpG) was dispersed
in PBS (pH 7.4) at 1 mg/ml and exposed to constant agitation for 1, 3 or 7 days at 37 ◦C. At the indicated
time points S−/+(CpG) containing 1 µg CpGwas transferred to the wells of a 2% agarose gel. Bands
were detected by gel staining with SYBR Gold.
S−/+(OVA)
A B
14
Figure S3. Effect of (OVA)S−/+(CpG) or S−/+(OVA−CpG) on BM−DC maturation in vitro.
BM−DCs were incubated for 24 h with 5 µg/ml CpG, OVA, (OVA)S−/+(CpG) or S−/+(OVA−CpG), each
contained 5 µg/ml OVA. BM−DCs were stained with fluorescently labelled specific antibodies against MHC I, MHC II, CD40, CD80 or CD86, and cell analysis was performed using flow cytometry. Representative histograms are shown for CD11c−expressing BM−DCs stained with specific fluorescently labelled antibodies or their corresponding isotype control antibodies.
MHC I
MHC II
CD40
CD80
CD86
Naïve BM−DC OVA S−/+
(OVA)S−/+(CpG) S−/+(OVA−CpG) CpG
[image:14.595.62.515.108.443.2]15
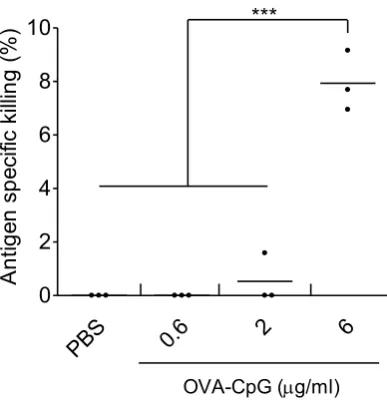
Figure S4. Determination of the optimal dose of OVA−CpG to induce antigen−specific killing using in vivo CTL assay. C57BL/6 mice (n= 3) were immunized, via footpad injection, with OVA−CpG containing 0.6, 2 or 6 µg of both OVA and CpG. On day 7 following immunization, a 1:1 splenocytes mixture consisting of target cells pulsed with 200 nM SIINFEKL and labelled with 0.5 µM CFSE (target cells) and unpulsed control cell labelled with 5 µM CFSE was intravenously administered to the control or immunized mice. Splenocytes were harvested, 18 hr later, from the control or immunized mice and analyzed using flow cytometry analysis. Antigen−specific killing induced by each treatment was determined. Each dot represents killing of target cells by each mouse, the mean value for each treatment is shown as a horizontal bar. *** P <0.001.
PBS 0.6 2 6
0 2 4 6 8 10
OVA-CpG (g/ml) ***
A
nt
ig
en
sp
eci
fic
ki
llin
g
(%
16
Figure S5. Assessment of in vivo CTL response. C57BL/6 mice (n= 3−5) were immunized, via footpad injection, with either 6 µg OVA (contained in (OVA)S−/+(CpG) or S−/+(OVA−CpG)) or 3 µg
OVA (contained in OVA−CpG + αCD40 or (αCD40)S−/+(OVA−CpG)). The S−/+ unconjugated or
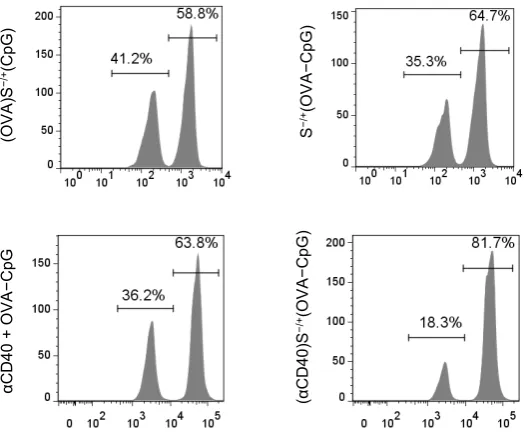
conjugated αCD40 was used at 10 µg. On day 7 following immunization, a 1:1 splenocytes mixture consisting of target cells pulsed with 200 nM SIINFEKL and labelled with 0.5 µM CFSE (target cells) and unpulsed control cell labelled with 5 µM CFSE was intravenously administered to the control or immunized mice. Splenocytes were harvested, 18 hr later, from the control or immunized mice and analyzed using flow cytometry analysis. Representative histograms are shown for the detection of target and control cells, in the harvested splenocytes, using flow cytometry.
(OVA
)S
−/
+(Cp
G
)
S
−/
+(OV
A
−C
pG
)
(α
C
D
40
)S
−/
+(OVA
−C
pG
)
αC
D
40
+
OVA
−Cp
[image:16.595.184.447.129.349.2]17
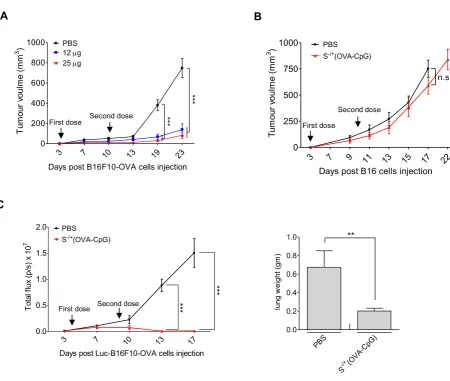
Figure S6. Assessment of anti−tumour immunotherapeutic efficiency of S−/+(OVA−CpG) in subcutaneous or lung pseudo−metastatic tumour models. (A) C57BL/6 mice (n=8) were subcutaneously injected with 2.5 × 10⁵ OVA−B16F10−Luc cells. On the 3rd and 10th days post tumour
cells injection, tumour−inoculated mice were immunized via footpad injection with S−/+(OVA−CpG)
containing 12 or 25 µg OVA. Tumour volume was monitored using calliper measurement. Results are expressed as mean value ± SEM. (B) Anti−tumour immune response antigen specificity. C57BL/6 mice (n=8) were subcutaneously injected with 2.5 × 10⁵ B16 cells. On the 3rd and 10th days post tumour cells
injection, tumour−inoculated mice were immunized via footpad injection with S−/+(OVA−CpG)
containing 25 µg OVA. Tumour volume was monitored using calibre measurement. Results are expressed as mean value ± SEM. (C) Pseudo−metastatic lung tumour model. C57BL/6 mice (n=6−8) were intravenously injected with 2.5 × 10⁵ OVA−B16F10−Luc cells. On the 4th and 9th days post tumour
cells injection, tumour−inoculated mice were immunized via footpad injection with S−/+(OVA−CpG)
containing 12 µg OVA. Tumour growth was monitored using whole body imaging. (Left) Quantification of photon flux, expressed as number of photons per second (p/s). Values are expressed as mean value ± SEM. (Right) The weights of the lung excised from scarified tumour inoculated mice. Values are expressed as mean value ± S.D. ** P < 0.01, *** P < 0.001.
A
3 7 10 13 19 23
0 200 400 600 800 1000
First dose Second dose ***
***
PBS
12g
25g
Days post B16F10-OVA cells injection
Tu m ou r v ou lm e (m m 3 ) B C
3 7 10 13 17
0.0 0.5 1.0 1.5
2.0 PBS
S-/+(OVA-CpG)
***
***
First dose Second dose
Days post Luc-B16F10-OVA cells injection
To ta l f lu x (p /s ) x 1 0 7 PBS (OVA-CpG) -/+ S 0.0 0.2 0.4 0.6 0.8 1.0 ** lu ng w ei gh t ( gm )
3 7 9 11 13 15 17 22
0 250 500 750
1000 PBS
S-/+(OVA-CpG)
First dose
Second dose
n.s.
Days post B16 cells injection
[image:17.595.83.534.92.473.2]18
References
[1] Hassan HAFM, Smyth L, Rubio N, Ratnasothy K, Wang JTW, Bansal SS, et al. Carbon nanotubes' surface chemistry determines their potency as vaccine nanocarriers in vitro and in vivo. Journal of Controlled Release. 2016;225:205-16.