University of Huddersfield Repository
Arebi, Lufti, Gu, Fengshou, Hu, Niaoqin and Ball, Andrew
Misalignment Detection using a Wireless Sensor Mounted on a Rotating Shaft
Original Citation
Arebi, Lufti, Gu, Fengshou, Hu, Niaoqin and Ball, Andrew (2011) Misalignment Detection using a
Wireless Sensor Mounted on a Rotating Shaft. In: Proceedings of the 24th International Congress
on Condition Monitoring and Diagnostics Engineering Management. COMADEM, Stavanger,
Norway, pp. 12891299. ISBN 0954130723
This version is available at http://eprints.hud.ac.uk/id/eprint/10712/
The University Repository is a digital collection of the research output of the
University, available on Open Access. Copyright and Moral Rights for the items
on this site are retained by the individual author and/or other copyright owners.
Users may access full items free of charge; copies of full text items generally
can be reproduced, displayed or performed and given to third parties in any
format or medium for personal research or study, educational or notforprofit
purposes without prior permission or charge, provided:
•
The authors, title and full bibliographic details is credited in any copy;
•
A hyperlink and/or URL is included for the original metadata page; and
•
The content is not changed in any way.
For more information, including our policy and submission procedure, please
contact the Repository Team at: [email protected].
Misalignment Detection Using a Wireless Sensor Mounted on
a Rotating Shaft
Lutfi AREBI1, Fengshou GU1 Niaoqing HU2 and Andrew BALL1
1. University of Huddersfield, Queensgate, Huddersfield HD1 3DH, UK, [email protected], [email protected], [email protected]
2. College of Mechatronics Engineering and Automation, National University of Defense Technology, Changsha 410073, China.
ABSTRACT
Mechanical systems such as motors, pumps, engines and turbines are all operation based on different shafts. Due to the heavy use of shafts, various faults such as cross-sectional cracks, looseness and misalignment may occur during their service life. In this study a novel approach to monitoring the shaft problems is investigated. The advancement in low cost and low power Micro Electro Mechanical Systems (MEMS) make it possible to develop an integrated wireless sensor which can be mounted on the surface of rotating shafts to obtain vibration signals for condition monitoring. This measurement scheme can make the fault diagnosis of rotating shafts more effective because the signal to noise ratio is higher due to the direct sensor installation and combined response measurements. This paper focuses on using this sensing scheme to monitor shaft misalignment. Both theoretical analysis and experimental results show that the scheme outperforms the Instantaneous Angular Speed (IAS) measurement in detecting shaft misalignments.
Keywords: Wireless Accelerometer, Shaft Misalignment, Encoder, Instantaneous Angular Speed
1.
INTRODUCTION
Shaft misalignments cause not only machine vibration but also additional dynamic load, which accelerates
Ǥǡ͵ͲΨ ǯ
(Hariharan et al., 2009). ͲΨ ǯ problems (Bognatz et al., 2009).
Hence, an in-depth study and an accurate knowledge on the vibration characteristics is very helpful in understanding and diagnosing the rotor misalignment to avoid any failures or damages that may arise (Tejas H. et al., 2009). Despite the rapid increase in the understanding of rotor dynamics, no satisfactory analysis explains the range of observed phenomena (Hariharan et al., 2009). Vance (1988) and Goodman (1989) observed that misalignment is present due to improper machine assembly and sometimes the thermal distortion of the bearing housing supports, resulting in abnormal rotating preload. However, a perfect alignment between the driving and driven shafts cannot be attained. Gibbons (1976) first derived the misalignment reaction forces from those generated in different types of couplings.
Xu and Marangoni (1994a) showed analytically that the vibration due to coupling misalignment mainly occurs at even multiples of the rotor speed. Sekhar and Prabhu (1995) numerically evaluated the effect of coupling misalignment on the vibration response of the rotor. They suggested 2X vibration response as a characteristic signature of misaligned shafts. Dewell and Mitchell (1984) showed experimentally that 2X and 4X vibration components are largely dependent upon coupling misalignment.
Piotrowski (1995) concluded that vibration due to misalignment is usually characterized by a 2X running speed component and high axial vibration levels. When a misaligned shaft is supported by a rolling-element bearing, these characteristic frequencies may also appear. Tejas and Ashish (2009) found from the measured forces that the presence and type of misalignment (parallel and angular misalignment) has significant influences on the harmonic content of the misalignment excitation forces.
Recently, (Lees, 2007) studied the effect of parallel misalignment in rigidly coupled rotors. It shows that excitation develops at twice the rotor speed due to misalignment.
From the literature, it is clearly proven that misalignment produces high vibration levels in bearings and couplings. It is influenced by the machine speed and the stiffness of the coupling. e.g., rubber couplings are more tolerant and tend to produce less amounts of vibration.
In general, the majority of misalignment studies in the past are theoretical, whereas experimental investigations are relatively limited. The outcome of these studies may not be accurate, since in practice there are many more sources of observed vibration characteristics in an actual rotor system. Moreover, all of these studies used a wired accelerometer which is usually attached to the bearings housing which attenuate the shaft dynamics considerably.
In this paper a wireless accelerometer is mounted directly on a shaft to measure the dynamics when shafts are misaligned. A theoretical analysis is conducted to understand dynamics and outputs of the accelerometer. Then a test evaluation is carried out to show the performance of the accelerometer in detecting the misalignments, which is benchmarked by the measurements of angular speed (IAS) (Li et al 2004 and Gu et al 2006). This has minimal influences from bearing house vibrations.
2.
MODEL OF MISALIGNED SHAFTS
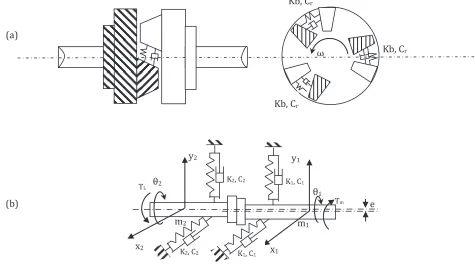
A rotor system is represented in general terms in FIGURE 1. It consists of a motor and a loader (DC generator with torque measurement device) which are connected for mechanical functionality by a flexible coupling. The coupling reduces extra forces on the system caused by any form of imperfection such as misalignment between the motor shaft and the loader shaft, which is magnified in the Figure.
FIGURE 1 System schematic and simplified spider coupling construction for modelling
r
FIGURE1 System schematic and Spider coupling model Motor Loader
Bearing Coupling
Wireless accelerometer
Bearing
2.1 Model of rotor with misalignment
The model considered is comprised of two shafts with mass m1 and m2 respectively. The shafts are
connected by a flexible coupling composed of two three-jaw hubs and one six-legged intermediate elastomeric element. For ease of model, the coupling is treated as three pins on one flange and three rings on other flange and with a rubber sleeve between the ring and pin at some distance of radius r from motor shaft centre, as shown by the graph at the bottom right of FIGURE 2. This simplified construction retains the key features of the coupling i.e. the ring and pin can move relatively in radial and rotational direction due to an elastomeric rubber sleeve.
[image:4.595.67.542.360.632.2]The system shown in FIGURE 1 can be modelled as FIGURE 2. Two rigid shafts, mounted on ball-rolling bearings, are connected by the coupling with N pairs of pins/rings on each flange, each pair having a finite stiffness Kb. The system is assumed to be balanced dynamically and hence the exciting forces arise only from misalignment and bearings, more specifically, they arise from varying forces in the coupling and bearing. In addition, it is also assumed that the pins on the flange of the first shaft are arranged around a circle centred on the centre of the shaft cross section, whereas on the second rotor the pins are again positioned on a circle displaced by e from the centre of the rotor as illustrated in FIGURE 1 and 3. The wireless accelerometer is mounted tangentially on the second rotor as illustrated in FIGURE 1 and 3. The analysis of the motion commences with the first rotor by applying ǯ second law. Recalling that the first rotor rotates at speed , whilst the second rotor at this varies as shown in FIGURE 2(b). The variation in the angular speed anticipated to the acceleration acting on a wireless sensor. In addition, the transitional acceleration that each rotor generates due to supporting bearings is derived.
FIGURE 2. Schematic diagram of the vibrations (a) coupling (b) model acting forces
Note that the locus of coupling pins: on rotor 1 basically follow a single circle, whereas those on rotor 2 are following a circle of different diameter as shown in FIGURE 2. The first shaft is considered to be rigid and has very large tortional inertia Jm and lateral stiffness value K1 and has displacements x1, y1, Ʌ1. The
second shaft has tortional inertia JLand stiffness value K2 and has displacements x2, y2, Ʌ2. This model
retains the physics of the situation. The model equations are derived and can be written as: e
K2, C2
m1
m2
(a)
ɘ
Kb, Cr
Kb, Cr
Kb, Cr
(b)
y2 y1
Tm
TL
Ʌ1
Ʌ2
x1
x2
K2, C2
K1, C1
(1) Where the excitation forces and torques are:
Oscillating torque generated by coupling due to misalignment:
Oscillating torque generated by eccentric mass due to misalignment:
Oscillating forces generated by eccentric mass due to misalignment:
And
, are polar moments of inertia for motor rotor and loader rotor are the mass of the rotor and loader
e is the misalignment between shaft and eccentricity of the mass from geometric centre;
r is radius of the centre of coupling pin position on reference shaft;
r1, r2 are radius of shaft 1 and shaft 2 respectively;
is the driving torque; is the tortional load;
N is the number of equivalent pins/rings in each flange; is the coupling stiffness of each pair of pin/ring; C1, C2 are damping of rotor1 and 2 respectively;
K1, K2 are stiffness of rotor1 and 2 respectively;
Cr is coupling critical damping;
When the wireless sensor rotates around a centre, its principal sensitivity axis also rotates and hence Sensor output due to the gravity acceleration is
Using ODE45 function available in MatLab, equation (1) can be solved to obtain displacements and velocity of both rotors in the directions of interest. Then accelerations: ax, ay, aw and aton rotor 2 can be
calculated by differentiating the corresponding velocities.
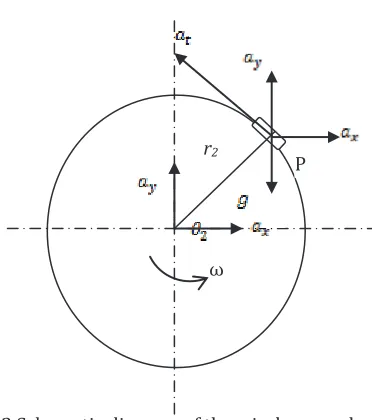
2.2 Output of wireless sensor
FIGURE 3 illustrates the relationship of different acceleration componenets at P where the wireless sensor is mounted. Decomposing these accelerations in the tangential direction, an electrical output waveform from the sensor can be obtained. This will be explained in the next section. ax and ay are the transitional
accelerations in the x and y direction respectively, whereas at is the total tangential acceleration, and aw
is the rotational or angular acceleration due to circular motion.
The accelerations at the sensor position can be found by decomposing ax and ay into tangential direction by:
(3)
and by calculating acceleration due to rotational angular acceleration by
(4) and then by adding them:
(5)
Therefore, the total output at P will be the sum of all accelerations at the tangential direction divded by the sensitivity of the sensor S.
(6) As shown in Equation (6), the output of
the wireless sensor is a combination of different accelerations. These accelerations can be measured simultaneously by one sensor mounted on the surface of the shaft. It means that it is likely to detect all different rotor problems with a cost effective approach. Moreover, it has high sensitivity to incipient deviations and produces a comprehensive condition of the rotor system.
3.
SIMULATION STUDY
[image:6.595.65.517.413.683.2]To gain a full understanding of the dynamic behaviour of the rotor system, a simulation study is conducted based on a bearing test rig with a layout shown in FIGURE 1 and rotor parameters shown in
[image:6.595.300.486.429.639.2]TABLE 1. The parameter of damping coefficient is selected with a high value so that the transient effects are minimised and the effect of misalignments are highlighted.
FIGURE 3 Schematic diagram of the wireless accelerometer mounted on rotor with different accelerations
ɘ
P
r2
TABLE 1 Parameters for simulation study
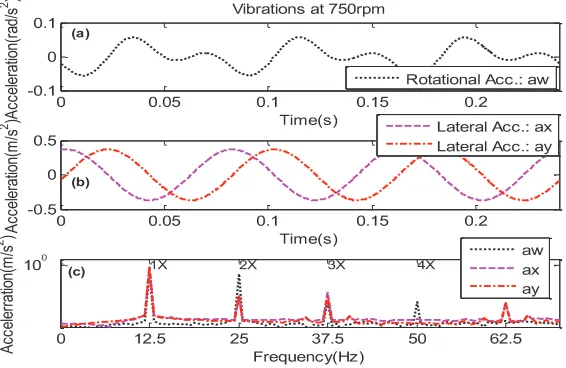
[image:7.595.157.434.88.342.2]3.1 Characteristics of vibrations due to misalignment
FIGURE 4 shows a typical result from numerical simulation studies when the motor operates at a speed of 750rpm. It can be seen from FIGURE 4(a) and (b) that waveforms of lateral accelerations: ax, and ay are close to sinusoidal waves whereas the waveform of rotational acceleration aw exhibits a faster rate of fluctuation. These show that shaft misalignment leads to shaft fluctuation in different directions, but with different frequency contents.
Further examination of the results in the frequency domain has found that the fundamental rotational component 1X dominates the spectra, as shown FIGURE 4(c). Moreover, the spectra show distinctive 2X components, which is the main feature used commonly for diagnosing misalignments (Sekhar et al, 1995, and Dewell DL et al, 1984). Especially, the rotational acceleration shows more significant amplitudes at 2X and 4X whereas lateral vibrations exhibit distinctive components at 2X, 3X and 5X but not 4X. These indicate that both rotational and lateral acceleration is sensitive to the problem with misalignment, but at different frequency components. In general, these spectrum features show that the model is adequate for exploring the shaft misalignment and examining the output behaviours of the wireless accelerometer.
!" # ! $ %
(a)
& " ! !" # ' ( ) ) * +
,
(b)
- ! ' ( ) ) * . - ! ' ( ) ) * /
0 $ 1
2
3 4 5 # ) / 6 7
,
89 : 9 ; 9 < 9
(c)
+
.
[image:7.595.148.431.550.734.2]/
FIGURE 4 Waveforms and spectra of lateral and rotational acceleration.
Description Symbol Unit Value
Shaft1 Diameter D1 m 0.04
Shaft1 Length L1 m 0.760
Shaft1 Mass m1 Kg 10
Shaft2 Diameter D2 m 0.035
Shaft2 Length L2 m 0.360
Shaft2 Mass m2 Kg 20
Bearing Stiffness K1 K2 N/m 1x10⁸
Bearing Damping C1 N/(m/s) 6.325x10³
Bearing Damping C2 N/(m/s) 8.944 x10³
Radius of centre for the equivalent pin/ring
r m 0.125
Coupling Damping Cr N/(m/s) 30.984
Coupling Stiffness Kb N/m 107
Moment of inertia Jm Kg m2 0.08
Moment of inertia JL Kg m2 0.16
Eccentricity e m 5x 10⁻⁴
Torsional load TL Nm 10
= = >=? =>@ = >@ ? = >A
B
=>C
B
=>A
=
=>A
U
PV MWXY Z[ [ \ ] \ ^ _ `ab c de fg hi
(a) D EF
D EH D EK D E D EHj D EK
= @ A>? A? k l>? ? = mA >? @= nop
@= nq @= p
r
SM sL M It KWu vY Z[ [ \ ] \ ^ ^ _ ` ab c d e fg
hi (b) wx yx zx {x
[image:8.595.175.405.76.261.2]D EF D EHj D EK t NV | PIM J}D E
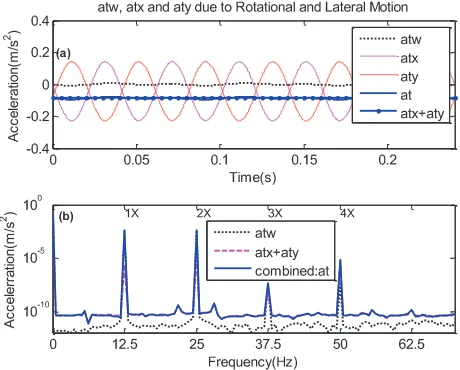
FIGURE 5 Waveforms and spectra of lateral and rotational acceleration at the sensor position
FIGURE 5(a) shows the tangential components: atx, aty and atw measureable at thesensor position due to accelerations: ax, ay and aw. It can be seen that atx and aty are fluctuating twice as fast as their original, but with the opposite phase. Combining these two components together produces a DC component. On the other hand, atw keeps the same phase but with a difference in magnitude due to the constant of the sensor position on the shaft surface. By combining the three components, the total accelration at at P exhibits mainly the feature of atw, but with a clear DC shift due to the combination of
atx and aty.
Moreover, the root mean squared (RMS) value of at is 0.0864, much larger than either 0.0863 of the combination of atx and aty or 0.00398 of atw. This shows that the wireless sensor output will have a higher output and hence more sensitive to changes due to faults.
In the frequency domain, the spectrum resulted from the combination of atx and aty is similar to that of
atw but has lower amplitudes, shown in FIGURE 5(b). However, compared with the spectra of ax and ay, the 4X components show up in the spectrum of atxy. The spectrum from the full combination of atxy and
atw exhibits noticeable differences at various shaft frequencies. In particular, the amplitude difference between atw and at is marginal at 1X and 2X, showing that these two components are mainly from the effects of rotational oscillation. However, amplitudes at 3X and 4X show a distinctive increase, which means that the contribution from lateral vibration is more significant at these two components and that the combined spectrum is more sensitive to changes due to misalignments.
= =>= ? =>@ = >@ ? = >A =>A ? = >k
B @= B ? = ?
@= ~ MI XN S L EL E
U
PV M WX Y Z[ [ \ ] \ ^ ^ _ ` ab c de fg hi (a)
DEj D X >@ C
~ MI XN S MD > @
= @ A>? A ? kl >? ? = m A>? l? @= p
Z[ [ \ ] \ ^ ^ _ ` ab c de fg hi r
SMs LM It KWu v Y ~ Mt ESLV N ~ M IX NS L E LE
@
> @C
G
A
= >= = k
m
wx yx zx {x
(b) D Ej D X
[image:8.595.173.404.526.706.2]~ M IX N S
¡ ¢£ ¤ ¥¦ §¨ ©ª
« ¬ ®¯° ±²
¡¢£ ¤ ¥¦ §¨ ©ª
« ¬ ®¯° ±² ³ ´ µ®¶· ¯®´ ¶ ·¯ ¸
¹ ´¯·¯®´ ¶ ·¯ ¸ ³ ´ µ®¶· ¯®´ ¶ ·¯ ¸ ¹ ´¯·¯®´ ¶ ·¯ ¸
º ¡¢£ ¤ ¥¦ §¨ ©ª
»« ¬ ®¯° ±²
» ¼
¡ ¢£ ¤ ¥¦ §¨ ©ª
« ¬ ®¯° ±²
½ ¾¿ÀÁÂÁà ¿ÁÀ½Ã¾Â ÂÃÀĽà Á½À¾Å¿Ã Ä¿ÀÄÃÆ ÃÁÀ¿¾Å ÆÃÀÃÅÇà ¾½ÈÉ
¾½Ê
Ë ÌÍÎÏÍÐÑÒÓÔ ÕÖ
× Ø ØÙ ÚÛ ÜÝ Ù Þß
Óà¿Öá âÍÑãÌÏä åæç ÑÑÀæÌåä è éÌÍêÍëë á ÍÐëåÌàã ÃÁÅÀÆÌâä ¾ì ¿ì Âì Åì Áì Äì Ãì
íàëÍêéÐÍ ½ÀÄÅä ä
½ ¾¿ÀÁÂÁà ¿ÁÀ½Ã¾Â ÂÃÀĽà Á½À¾Å¿Ã Ä¿ÀÄÃÆ ÃÁÀ¿¾Å ÆÃÀÃÅÇà ¾½ÈÉ
¾½Ê
Óí¿Ö á âÍÑãÌÏä åæîç á
Ë ÌÍÎÏÍÐÑÒÓÔ ÕÖ
ï ð ñ Úò × ó ÜÝ ß
¾ì ¿ì Âì Åì Áì Äì Ãì ô ôõôö ôõ÷ ôõ÷ö ôõø
ù øô ù ÷ô ô ÷ô øô ú û ûü ýþ ÿ
÷ õ
ôõ
ô ôõôö ôõ÷ ôõ÷ö ôõø
ù ù ø ô ø ÷ ý ú ÿ
As for the sensor output, the gravidity acceleration 9.81m/s^2 has to be superimposed to waveform at
which resultsin a waveform shown in FIGURE 6(a). This superimposition alters the spectrum at only 1X, i.e. increases by a factor of 9.81. Other spectral features remain the same, as shown in FIGURE 6(b).
3.2 Characteristics of spectral amplitude with misalignment and speed
In order to examine further the changes of spectral amplitude for misalignment diagnosis, a simulation study is performed under different motor speeds and different degrees of misalignments. FIGURE 7 shows the amplitude changes for the first 4 harmonics. By comparing amplitudes between the combination and the rotation, it can be observed that:
The amplitude of 1X from combination remains unchanged with an increase in shaft speeds and with the degrees of misalignment. However, it is slightly lower compared with that of rotational motion. It means that amplitude at 1X is not suitable for misalignment detection.
The amplitude of 2X from combination increases with both shaft speeds and the degrees of misalignment. In addition, it also has similar amplitudes with that of rotational motion. Thus it is a good indication of misalignment at higher speed. The amplitude of 3X from combined acceleration increases with both shaft speeds and the degrees of misalignment. Specifically, there is a significant
increase regardless of speed changes. Comparatively, the amplitude of 3X from rotational oscillation is lower and remains the same over different speeds. These changes in 3X mean that it can be a better indicator for misalignment detection, compared with that of 2X. However, its amplitude values are 7 orders lower, which may be influenced by measurement accuracy.
Similarly with 4X, the amplitude of 4X from the combination increases with shaft speeds and the degrees of misalignment. In addition, it has higher amplitudes. It can be a secondary indicator for the misaligned shafts. However, the amplitude of 4X from rotational oscillation has no change with speed and misalignment and hence it is not an effective indicator.
In general, the amplitude variation of combined acceleration at 2X, 3X and 4X can be good indicators of misalignment. However, 3X has very low amplitude and can be influenced by measurement noise. On the other hand, the amplitudes of rotational oscillation at only 2X and 3X can be based on misalignment detection.
FIGURE 8. Waveforms and spectra for different degrees of misalignment
4.
TEST EVALUATION
To evaluate the predicted performance of wireless sensors in detecting misalignment a test study is conducted based on a bearing test which has a similar layout as shown in FIGURE 1 and can be induced conveniently with different degrees of misalignment.
4.1
Experiment setup
The test rig consists of a 3-phase electrical induction motor to provide a prime power source and a DC generator to apply load to the motor. The motor is connected to the generator through two pieces of shafts, which are connected by three pairs of flexible couplings and supported by bearings in two bearing housings. The construction allows the study of different types of misalignments such as angular and parallel misalignments in different parts of the shaft system. In addition, the test rig has a variable speed controller and can run in a speed range from 60rpm to 1450rpm.
A MEMS accelerometer wireless sensor, developed by Arebi et al. 2010, is mounted directly on the second shaft connecting to the shaft of the motor. The principal sensitivity axis of the sensor is along the tangential direction of shaft rotation. To benchmark the results from the wireless sensor, a shaft encoder is mounted at the end of the induction motor. Both the wireless channel and encoder channel are measured simultaneously at a sampling rate of 96kHz. At such a high rate, the pulse-width modulation (PWM) signal from the wireless sensor and the frequency modulated (FM) signal from the encoder can be recorded accurately.
During post-processing, the DCM signal is low pass filtered to obtain the acceleration signal at tangential direction. The pulse train signal is applied by a FFT based demodulation algorithm (Gu, et al 2006) to obtain an IAS signal. As only a relative comparison of detection performance is made between the wireless sensor and the shaft encoder, the unit of angular speed is used directly, rather than converting it into angular acceleration by multiplying IAS by a constant of angular frequency.
Two tests were conducted for detection performance evaluation. The first test was the baseline measurement under which the system was adjusted with minimal difference between the two flanges of the coupling by a dial indicator. The other takes the measurements when the two flanges were set to a 0.64mm offset between the two flanges. In each test measurements were taken at shaft running speeds: 307.4, 455.8, 605.4, 755.8, 1057 and 1204 rpm.
4.2
Results and discussion
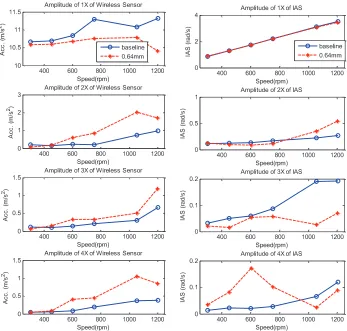
FIGURE 9 Measured spectral amplitudes versus speed and misalignments
However, the IAS signals of FIGURE 8(b1) and (b2) from the encoder show hardly any changes at 1X and 2X due to the misalignment. Surprisingly, the spectrum shows an amplitude decrease at 3X and increase at 4X, which is inconsistent with model prediction. This may be due to additional noise influences when the encoder is mounted on the motor shaft and problems with the motor rotor causes further influence on the output of the encoder.
FIGURE 9 shows the variation trend of spectral amplitudes with speeds. The spectral amplitudes of wireless accelerometer at 2X, 3X and 4X show an increasing trend with speed, which is consistent with model prediction. Especially, these amplitudes show good performance in separating the misalignment from the baseline when speed is higher than 600rpm.
On the other hand, at only 2X spectral amplitudes of IAS show an expected speed trend. Nevertheless, it allows the misalignment to be separated from the baseline at a speed higher than 1000rpm, which is much lower in detection performance compared with that of a wireless sensor.
5.
CONCLUSION
A wireless measurement scheme is investigated in order to monitor shaft problems. A model of the pin type coupling-roller-ball bearing system with misalignment has been derived to simulate the dynamics of a misaligned shaft system at different speeds. Through the experiment and simulation work, the validity of the model and measurement scheme has been successfully verified in a wide range of operating speeds. Both the measured and numerical results spectra show that misalignment can be characterized primarily by spectral amplitudes at 2X, 3X and 4X of shaft running speed, on which misalignment detection can be extracted. Because these components consist of both rotational and lateral vibrations, the detection performance of the wireless measurement scheme is much better compared with IAS measurements.
! " "# "
" $% "" ""$%
78 89 :; <= >?
5 (..-@3(' A
BC4. )*6. $ ' '
! " "#
"
#
D
& ' ()*+,-. /0#1 /02 *3.).44 5 .64/3
78 89 :; <= >?
5 (..-@3(' A
! " "#
$%
"
"$%
& ' ()*+,-. /0D1 /02 *3.).44 5 .64/3
78 89 :; <= >?
5 (..-@3(' A
! " "#
$%
"
"$%
& ' ()*+,-. /01 /02 *3.).44 5 .64/3
78 89 :; < = >?
5 (..-@3(' A
EFF GFF HFF IFFF IJFF
F
J
E K L MNOPQRS TU IV
TU WK X
Y Z [ \] ^ _ `a b
X MSSRcdML e
fgh SNOiS F jGE
L L
EFF GFF HFF IFFF IJFF
F F jk I Y Z [ \] ^ _ `a b
X MSSRcdML e K L MNOPQRS TU
JV TU WK X
EFF GFF HFF IFFF IJFF
F
F jI F jJ Y Z [ \] ^ _ `a b
X MSSRcdML e K L MNOPQRS TUl
V
TU WK X
EFF GFF HFF IFFF IJFF
F
F jI F jJ Y Z [ \] ^ _ `a b
X MSSRcdML e K L MNOPQRS TU
REFERENCES
Analog Devices, Inc, ADXL202E Catalogue, at http://www.analog.com, [1/2/2009].
Arebi Lutfi. (2010). Rotor Misalignment Detection using a Wireless Sensor and a Shaft Encoder. Diagnostic Engineering Research Centre. University of Huddersfield UK. CEARC2010 conference.
Bognatz S.R. 1995. Alignment of critical and non critical machines. Orbit 23Ȃ25.
David M. Alter. 2008. Using PWM Output as a Digital-to-Analog Converter on a TMS320F280x Digital Signal Controller, DSP Applications-Semiconductor Group. Texas Instruments, SPRAA88A.
Dewell DL and Mitchell LD. 1984. Detection of a misaligned disk coupling using spectrum analysis. ASME Trans. J. Vibration, Acoustics, Stress & Reliability Design. 106, 9-16.
Gibbons C.B. 1976. Coupling misalignment forces. Proceedings of the 5th Turbo Machinery Symposium, Gas Turbine Laboratory, Texas A & M University, pp. 111Ȃ116.
Goodman MJ. 1989. Dynamics of rotor Ȃ bearing systems. London, Unwin Hyman Ltd.
ǤǤǤǤǤǤǡʹͲͲǡDz
Instantaneous Angular Speed for Machdzǡ ǡǤʹͲǡǡ pp.1444-1460.
Hariharan V., PSS. Srinivasan, Kongu Engg. 2009.Vibration analysis of misaligned shaft Ȃball bearing system. Indian Journal of Science and Technology, Vol.2 No. 9, ISSN: 0974- 6846.
Hengstler, Inc. TECHNICAL DATASHEET Incremental Encoder RI32
http://www.hengstler.com/en/products/shop.php,catID=1011&artID=34. [1/2/2009]
Lee Y.S., Lee C.W. 1999. Modeling and analysis of misaligned rotorȂball bearing systems. Journal of Sound and Vibration 224 17Ȃ32.
Lees A. W. 2007. Misalignment in rigidly coupled rotor. Journal of Sound and Vibration 305 261Ȃ271.
Li Y. Gu F. Ball A.D. Bennett N. 2004. The measurement of Instantaneous Angular Speed. Mechanical Systems and Signal Processing, Vol. 19, No 4, pp. 786-805.
Lutfi Arebi, Yibo Fan, Fengshou Gu and Andrew Ball. 2010. Investigation of Wireless Sensor Directly Deployed on Rotating Shaft and Its Potential for Machinery Condition Monitoring. Proc. Of COMADEM2010, Japan.
Piotrowski J. 1995. Shaft Alignment Handbook. Marcel Dekker Inc., New York,
Rao S. Singiresu. 2004. Mechanical Vibrations. University of Miami USA. Pearson Education, Inc. Fourth Edition. International Edition.
Sekhar A.S., Prabhu B.S. 1995. Effects of coupling misalignment on vibration of rotating machines. Journal of Sound and Vibration 185, 655Ȃ671.
Stephen Jesse, J. Wesley Hines, Andrew Edmondson. 1999. Motor Shaft Misalignment Bearing Load Analysis. Maintenance and Reliability Center College of Engineering, The University of Tennessee, Computational Systems Incorporated
Tejas H. Patel, AshishK. Darpe. 2009. Experimental investigations on vibration response of misaligned rotors. Mechanical Systems and Signal Processing, Vol.23, No 7, pp 2236Ȃ2252.
Vance JM. 1988. Rotor dynamics of Turbomachinery. New York, John Wiley & Sons.