2018 International Conference on Modeling, Simulation and Optimization (MSO 2018) ISBN: 978-1-60595-542-1
E-commerce Service Equilibrium Prediction Simulation
Based on Ontology
Zhong WU
1and Chuan ZHOU
2,*1Physical Education School, Wuhan Business University, Wuhan, China
2Power Engineering Department, Wuhan Institute of Shipbuilding Technology, Wuhan, China
*Corresponding author
Keywords: E-commerce service, Ontology, Equilibrium prediction, Simulation.
Abstract. In the process of e-commerce service users to accurately forecast demand, can expand
electricity service scope, improve the quality of electricity services. In this paper, a process of e-commerce service based on ontology user demand equilibrium prediction method. First build electric company service equilibrium recommend user ontology, calculate the semantic similarity between ontology, have similar collections, on the basis of general prediction to target users near to the object as a group, the forecast probability calculation of high trust subgroup, balanced by the dynamic measurement uncertainty neighbor prediction, effectively completed the demand for electricity service user equilibrium predictions. Simulation experiments show that the proposed method can effectively improve electricity service users demand forecasting accuracy, strong use value.
Introduction
With the continuous development of mobile internet technology, the amount of information on the internet is increasing day by day, and the recommendation of business objects under the electricity supplier mode has attracted people's special attention [1]. As a new information service mode, demand forecast can effectively alleviate the problem of information overload [2]. However, in most e-commerce services, user demand forecasting system cannot accurately calculate the similarity between users’ ontology, accordingly reducing user demand prediction accuracy. Under such condition, improving the quality of e-commerce service demand forecast has been paid much attention by the relevant people, and some progress has been made.
However, there are many problems in existing research, such as large deviation [3], difficult to resist the interference of external factors [4], and cannot accurately calculate the similarity between users [5].
In view of the problems arising above, it proposes a balanced recommendation method based on ontology for e-commerce services. The simulation experiment shows that the proposed method can effectively improve the accuracy of the recommended system.
Forecasting Principle of User Demand
In the e-commerce service demand forecasting process, the concept of business service context ontology is divided into two types of the concept of characteristics and the concept of e-commerce service characteristics according to the semantics, establishing the demand forecast rules. Current user environment and user requirements details are matched by the actual-time demand forecast reasoning of e-commerce. And forecasting the characteristics of user preferences to e-commerce services under the real-time situation, selecting service projects in line with the feature which will be recommended to the user from the feature set, and completing business services in the forecast. The concrete realization of the process as described below.
It is assumed that E represents the set of users and forecast objects, l
R is the concept of e-commerce service characteristics,plis the concept of e-commerce service characteristics,
i
potential feature vector of e-commerce services, then user demand forecast rules are established by equation (1).
l l
E A
i
R p
P E S
U a
(1) In equation (1), ais the relationship network between users, is any two forecast objects, SAis the relationship between the recommended objects.
Suppose that erepresenting the user's current environment, using the equation (2) to match the user current environment and the rules of the user requirements forecast.
l
y A
E e
T p S
P
(2)
Suppose that qrepresents the trusted neighbor user group, Ijon behalf of the similarity of user jwith all neighbor candidate users, by using the equation (3) to forecast the user preferences to e-commerce service features under real-time situations, establish the objective function of user demand forecast in e-commerce requirement service, and complete user demand forecast.
y E
e P
T a P
(3) But by the traditional method the recommendation can only be selected on the basis of single index, which reduces the accuracy of the demand forecast of e-commerce service. A method of equilibrium forecast for e-commerce service demand based on ontology is proposed.
Equilibrium Prediction of Customer Demand for E-commerce Service Based on Ontology Calculation of Similarity Threshold between E-commerce Users
When we do equilibrium prediction of customer demand for e-commerce service, we need to build user ontology for e-commerce service, getting the attribute system of user ontology knowledge, based on that system user attributes are divided into 3 different types. Firstly, when the users register, they provide the basic information of the document which is defined as user basic information. Secondly, it is the document of social information set, which we use to structure the users’ knowledge. Thirdly, it is the information document of user's project set. If any user is interested in e-commerce service, he will evaluate the project that he is interested in. Accordingly, we define the document as the scoring information matrix of user interest items. According to the different types of the above documents, the basic attributes, main features and interest of a user can be described in details.
According to the principles above, the similarity of the two users’ ontology is calculated by using the equation (4).
1 21 2
1 2 1 2 2 1
,
property
p p Sim o o
p p p p p p (4) In equation (4), p1and p2mean the attribute set of O1 and O2 respectively. p1p2 is the elements number of p1and p2 intersection. p1 p2 is the elements number of set p1not belonging to set p2. While p2p1 represents the elements number of set p2not belonging to set p1. represents the similarity threshold calculated by equation (5).
1 1
2 2
1 2
,,
property depth O depth O
depth O depth O Sim o o
In equation (5), depth O
i is the maximum value of the entire conceptual path of ontology.The Accurate Calculation of Similarity between Users
In the two users’ ontology, there is the common concept of sequence. In the common sequence between ontology the concept point is consistent, and the order is the same, which can reflect the similarity more accurately between two users’ ontology. The number of common sub sequence, levels, program these 3 factors are calculated respectively, then in a comprehensive summary, calculating the accurate similarity between the user ontology. Specific steps as follows.
The Calculation of the Number of Common Sub Sequences of User Ontology. It is assumed
that CS O O
1, 2
represents the common sub sequence of two users’ ontology. And the similarity of
1, 2
CSnum O O represents the common sub sequence is calculated by the equation (6).
1 2
1 2
1 2
2 , ,
,
i i NSC O O SC O O CSnum O O
S O S O
(6)
In equation (6), Oi is the number of its sub sequences, NCS O O
1, 2
represents the common sub sequences of the two ontology.The Calculation of the Hierarchy of the Common Sub Sequence of the User's Ontology.
Suppose that DCrepresents the depth of the common sub sequence, the similarity between the levels of the common sub sequence is obtained by the equation (7).
1 2
1 2
1 2
, ,
,
c Pec
D depth LCS O O
CS O O
CSnum O O
(7)
In formula (7), depth represents the distance from the concept to the root node of the ontology.
1, 2
LCS O O represents the minimum common sub sequence.
The Length Calculation of the Common Sub Sequence of the User's Ontology. In the two
ontology, the longer the length of the common sub sequence is, the higher the similarity is between the corresponding two users. The length factor of the common sub sequence is obtained by using the equation (8).
1
2
1 2
1 2
, ,
,
Pec
Max lenth CS O O CSlen O O
CS O O
(8)
Combining the equations (6), (7) and (8), the similarity function of the user ontology is obtained by using the equation (9).
1 1 2 1 2 2 1 2
1 2 1 2
, ,
si ,
, ,
Pec
f CSnum O O CSlen O O f
m O O
CS O O CSnum O O
(9)
In the equation (9), f1 and f2represent the weights of the similarity between the two types of user ontology.
The initial weights of user ontology similarity function are set up in sigmoid. The similarity threshold above is taken into consideration, and the similarity function is introduced into the equation (9). The similarity between users is accurately calculated by using equation (10).
1 2 si
1, 2
1 1
x
x x
m O O e
f x
Realization of Equilibrium Prediction of E-commerce Service
On the basis of the user ontology similarity above, collecting the neighbor objects of forecast target user, establishing the user demand forecast group for e-commerce service, calculating the trusty subgroup with higher prediction probability, doing the balance prediction by dynamic measurement of uncertain neighbor, effectively completing the prediction of user requirements for e-commerce services. The specific implementation process, as shown below.
Assuming Ijrepresenting user aof a service without scoring, Ra j, is the forecast user scoring to the service. In the service without user’s score, the forecast user provides the maximum score to recommended selectively to the user, by using the equation (10) to get f x
and search k neighbors for the unknownIj, using the equation (11) to obtain the scores with user ontology forecast.
, ,
,
,
a
a b b j b
a j x
a b j
sim U U R R
R R
sim U U f x I
(11)In equation (10),Ra represents the scoring for other service types by user Uain e-commerce,
a, b
sim U U representing the scoring intersection of user Ua and userUb. Rbrepresents the scoring for other service types by user Ub.
It is assumed that S U
a the prediction set selected by user ontology and S I
j the prediction set selected by e-commerce, according to the equation (12), through them we calculate the common scoring number between user ontology more than user demand forecast group of the set threshold.
, ,
x a x
a
j a j a
U sim U U S U
S I R S U
(12) In equation (12) , Uxrepresents xusers set. represents the threshold of similarity calculation between the service types of the e-commerce system.
By the equation (13), the trusty subgroup with higher prediction accuracy is obtained from the user's demand prediction group.
,
x a
j
j a j
U S U S I
S I R S (13)
In equation (13), is the set trusty degree threshold. By equation (14), the user demand equilibrium prediction model in the process of e-commerce service is established.
,
,
,
, ,
x j x x j y a j a
a b y j
R R U I I
R R
sim U U R R
(14)
In equation (14), Raand Rx represents the average score to other services of user Ua and
x
U respectively. Rjand Ryrepresents the average score value of the total number of known users
j
I and Iy. represents the neighbor of the user.
Simulation Experiment Results and Analysis
experiment we totally recruited 200 student volunteers to participate in the use of the prototype system. The experimental time was 100 days. During the experiment, the experimenter had to order every meal through the interactive interface of mobile client inputting that time situation and and selecting restaurants. The system generated one user demand forecast table based on the situation.
Ratio of Customer Demand Forecast Efficiency in E-commerce Service
[image:5.612.200.405.189.313.2]By using the improved algorithm and literature 3, 4 and 5 algorithm to predict user demand in e-commerce service, the prediction efficiency of different methods is compared at different time, and the results are shown in Figure 1 as below.
Figure 1. Comparison of the prediction efficiency of different algorithms.
Figure 1 analysis shows that with the same experimental days in the literature of 3, 4, and 5 the prediction efficiency all was lower than that of the improved algorithm. Through the analysis of the whole experimental process, we could know that the prediction average efficiency of literature 3, 4, and 5 is about 66.03%, 67.98%, 76.48% respectively, while that of the improved algorithm is about 94.92%, being increased by 43.73%, 39.62%, 24.10% to compare the three method above, which shows that the improved algorithm has high prediction efficiency.
The Average Absolute Deviation Ratio of User Demand Forecast in E-commerce Service
MEA which represents the average absolute deviation is defined as the recommended accuracy measurement standard for different algorithms. By MEA we calculate the deviation between the predicted user scoring and the actual user scoring. The smaller the MAE value is, the higher the accuracy of the recommendation results is. The equation (15) is used to calculate MAE.
, ,
1 ˆ
u i u i
MAE r r
n
(15)
In equation (15), rˆu i, represents the forecast results, ru i, representing the collection of the types of e-commerce services, and n representing the size.
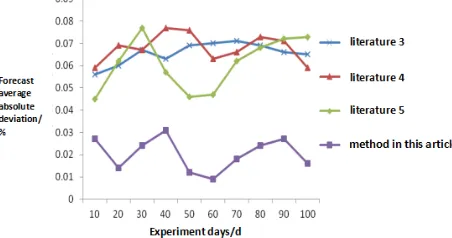
[image:5.612.191.417.610.729.2]By the improved algorithm and literature 3, 4, and 5 algorithms to predict user demand in e-commerce service, the average absolute deviation prediction of different methods is compared at different time, and the results are shown in Figure 2 as below.
Figure 2 shows that with the same experimental days under the condition that the average absolute deviation of literature 3, 4, and 5 is much higher than that of the improved algorithm. From the analysis of the whole experimental process, the prediction average efficiency literature 3, 4, and 5 is about 0.0656%, 0.068% and 0.0609% respectively, while that of improved algorithm about 0.0202%, which shows that the improved algorithm has small prediction deviation.
Comprehensive and Effective Comparison of User Demand Forecast
By the improved algorithm and the algorithm of literature 3, 4, and 5 algorithm to do forecast experiment for e-commerce service user demand, within a given time period, comparing the accuracy of several algorithms (T)%, reliability E (%) and memory, with the results we could measure the comprehensive effectiveness of different algorithms to e-commerce service equilibrium recommendation. The results are shown in table 1.
Table 1. The comprehensive effectiveness with different algorithms to user demand forecast of e-commerce service.
Algorithms (T)% E(%) algorithm of literature 8 69.17 62.91 algorithm of literature 9 71.13 65.28 algorithm of literature 10 76.31 73.12 Improved algorithms 95.32 94.38
Analysis of Table 1 shows that in terms of accuracy, the prediction accuracy of literature 3, 4, and 5 is about 69.17%, 71.13% and 76.31 respectively, while the traditional method is about 95.32%. In terms of the reliability of prediction, the prediction accuracy of 3, 4, and 5 is about 62.91%, 65.28% and 73.12% respectively, while the traditional method is about 94.38% . All above have improved that the comprehensive effectiveness of this article method is higher than the other three algorithms, which can meet the actual demand.
Acknowledgement
This research was supported by the Colleges and Universities Outstanding Youth and Middle Aged Scientific and Technological Innovation Team Project of Hubei Province ( No. T201628), the Humanity and Social Science Youth foundation of Ministry of Education of China (No.14YJCZH165), and the Science Research Foundation of Wuhan Business University (No.2015KA009).
References
[1] L. Guo, J. Ma, Z.M. Chen and H.R. Jiang, Incorporating Item Relations for Social Recommendation, Chinese Journal of Computers. 37 (2014) 219-228.
[2] A.T. Yang, Y. Tang, J.B. Wang and J.G. Li, Personalized Friends Recommendation System Based on Game Theory in Social Network, Computer Science. 42 (2015) 191-194.
[3] Z.H. Huang, Top-n Recommendation Algorithms for Cloud Data, Acta Electronica Sinica. 43 (2015) 54-61.
[4] Y. Jiang, Research and Simulation on Information Trust Calculation Model of P2P Network Nodes, Computer Simulation. 31 (2014) 298-301.